

Advertisement
Advertisement
Natural Gas, WTI Oil, Brent Oil Forecasts – Oil Retreats As Gasoline Inventories Rise
By:
Key Points:
- Natural gas moved higher as traders ignored the disappointing EIA report.
- WTI oil pulled back towards $73.00 as traders focused on rising gasoline inventories.
- Brent oil declined towards the $76.00 level.

Natural Gas
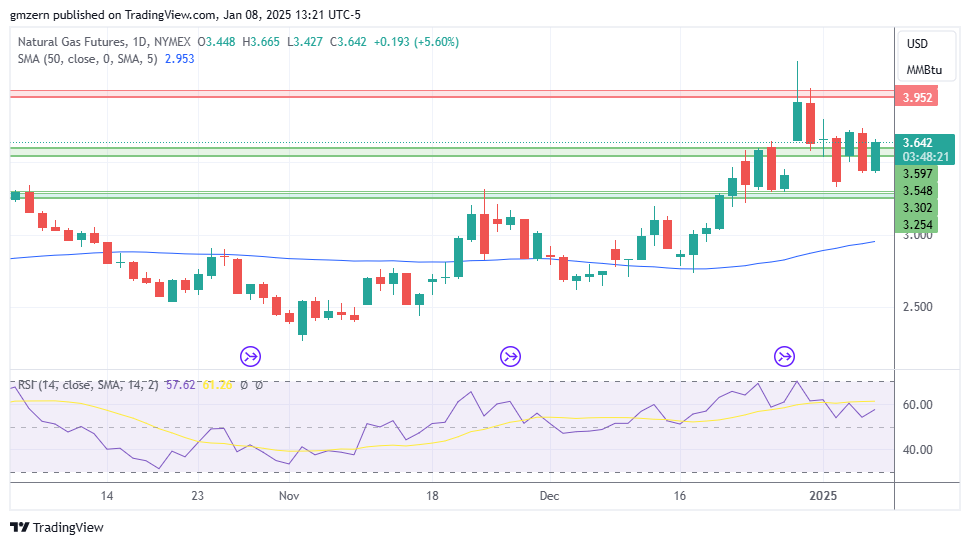
Natural gas gains ground as traders focus on the EIA report, which showed that working gas in storage declined by -40 Bcf from the previous week.
In case natural gas stays above the $3.60 level, it will move towards the resistance at $3.95 – $4.00.
WTI Oil
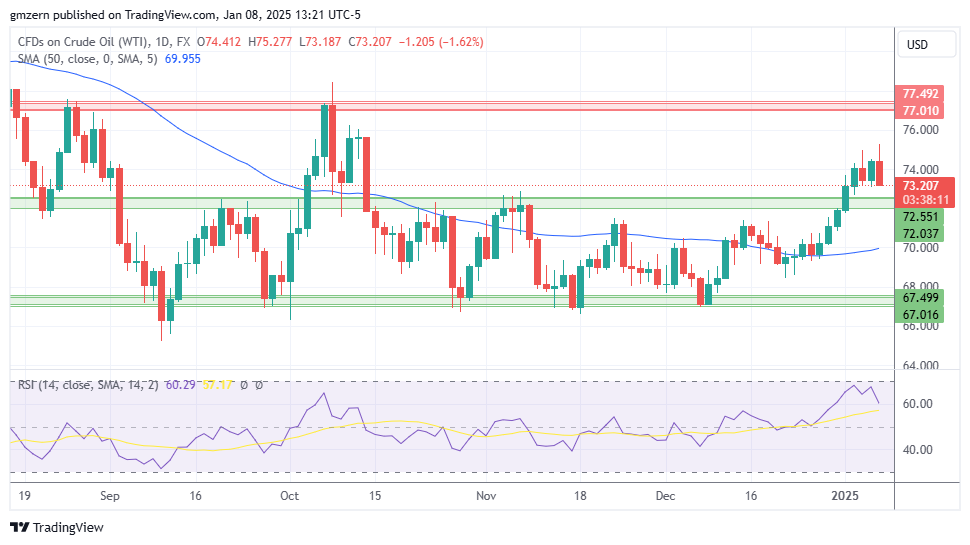
WTI oil pulled back as EIA report showed that gasoline inventories increased by 6.3 million barrels, compared to analyst forecast of +1.5 million barrels.
The nearest support level for WTI oil is located in the $72.00 – $72.50 range. A move below the $72.00 level will push WTI oil towards the 50 MA at $69.95.
Brent Oil
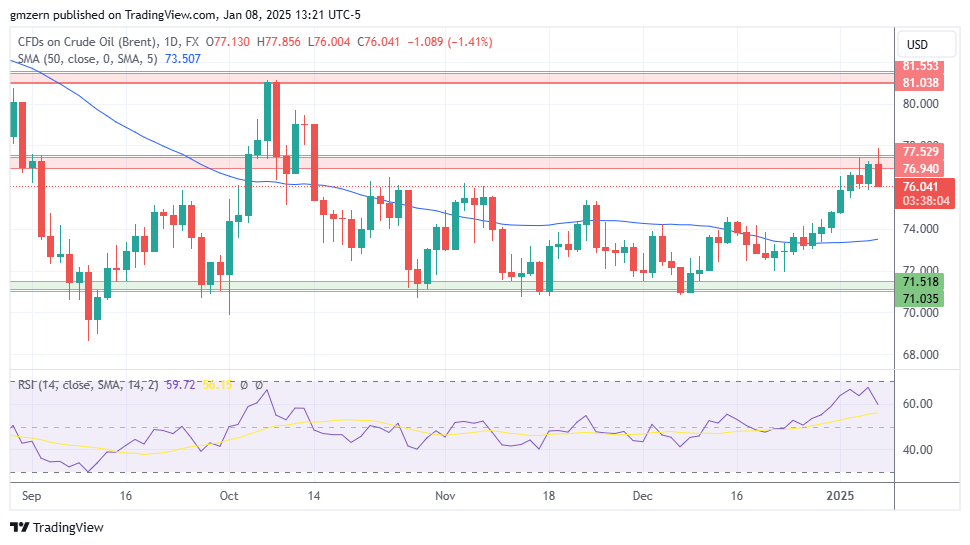
Brent oil pulled back after an unsuccessful attempt to settle above the resistance at $77.00 – $77.50.
If Brent oil settles below the $76.00 level, it will head towards the 50 MA at $73.50.
For a look at all of today’s economic events, check out our economic calendar.
About the Author
Vladimir Zernovauthor
In more than 15 years of trading in the financial markets, Vladimir dealt with a wide range of brokers and financial instruments. His career as a day-trader at a proprietary trading firm goes back to 2007. Later, Vladimir turned to longer time frames and became an independent trader and analyst managing his own portfolio. Using his experience, he helps traders find the best broker in his reviews.
Did you find this article useful?
From Our Partners
Latest news and analysis


Advertisement
