
Advertisement
Advertisement
Crypto Crash: BTC, ETH, Altcoins Drop as Fear & Greed Index Hits Lowest Level in 8 Months
By:
Key Points:
- Cryptos are crashing and investors seem to be in ‘Panic Mode’ according to Fear & Greed Index.
- The last time the index dropped to these levels, cryptos bounced back strongly.
- ETH has performed poorly this year but could be gearing up to make a comeback.

In the past 24 hours, BTC has retreated by 7.7% and its price stands at $86,950 at the time of writing, while ETH is down 9.8% during this same period, currently trading slightly below the $2,400 level.
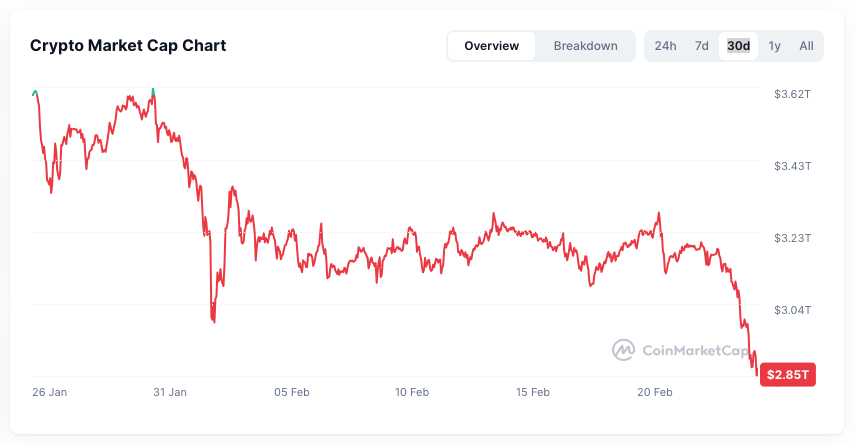
The selling pressure has pushed the combined market cap of cryptocurrencies below the $3 trillion level for the first time in the past 30 days, as tracked by CoinMarketCap.
Investors appear to have panicked now that what was initially perceived as a pullback has evolved into a much more concerning retreat. Trading volumes reflect the extent of the sell-off, as they have nearly tripled in the past 24 hours in the spot markets.
Investors are in Panic Mode – Time to Buy?
The Fear & Greed index shows how market sentiment has shifted radically, as the benchmark has dropped to its lowest level since June 2024 and currently stands at 29.
Although we are not yet in ‘Extreme Fear’ territory, this 8-month low indicates that concerns are starting to emerge about how fears of a recession in the U.S. and Donald Trump’s intentions to enter a trade war with China, the European Union and U.S. neighboring countries could impact the performance of cryptocurrencies.
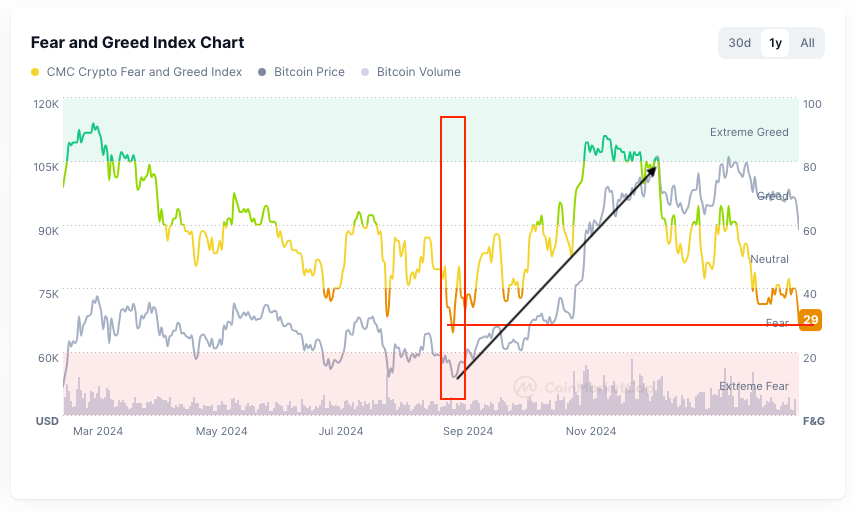
Perhaps interestingly, back in June when the F&G index dropped to these levels, the price of BTC started to hit its floor at around $53,950. Just a month after, BTC rose to its current all-time high. History may not repeat itself, but it often rhymes.
Meanwhile, the Altcoin Season index, which tracks the performance of the top 100 cryptocurrencies compared to that of Bitcoin (BTC) over the past 90 days indicates that there aren’t many signs indicating that this category could be ready to bounce back higher.
The overall weakness that the top 5 altcoins have experienced lately confirms this bearish view, as Ethereum (ETH) and Solana (SOL) have performed poorly since 2025 with losses of 27.5% and 25.9% respectively.
XRP has been the only crypto in the top 10 to perform positively this year, primarily as company-specific developments like its victory against the SEC in court catapulted its price to the point that the asset retested its January 2018 all-time high.
Path of Least Resistance for ETH is Upwards
As usual, ETH’s price action can be a good barometer to analyze the state and prospects of altcoins.
The daily chart shows that ETH is already bouncing off a key support found at $2,325 during today’s session.
Apart from this, another two levels could act as support in case the price keeps dropping in the next few hours or days.
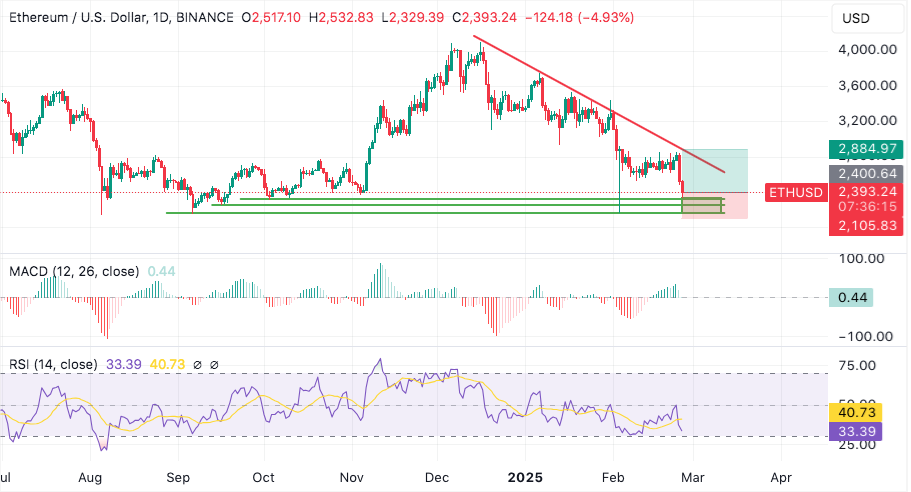
Momentum indicators are favoring further drops ahead, as the Relative Strength Index (RSI) has moved below the signal line, meaning that momentum has shifted. This is consistent with the readings seen in the MACD’s histogram, as positive momentum is starting to fade.
Nevertheless, the path of least resistance at this point seems to be upwards considering that sellers would have to break through three robust support areas to generate meaningful gains.
Even if the sell-off continues, ETH’s maximum downside potential currently stands at around 10% if the price collapses to the $2,170 level – the third horizontal support line drawn in the chart.
Meanwhile, the upside potential is appealing as the next resistance found in the daily chart stands at $2,800 – a 16.7% climb from current levels.
Conservative traders could probably wait for confirmation of a reversal if the price bounces decisively off any of these levels and the move is accompanied by a buy signal in the RSI or the MACD.
For now, the short-term outlook is bearish but both sentiment and technical indicators seem to be telling us that the market could soon find a floor.
About the Author
Bob MasonChief Crypto Boss
TEST 30 He has written extensively for a broader audience and his current focus is on developments relating to the financial markets including, but not limited to currencies, commodities, alternative asset classes, and global equities.
Latest news and analysis


Advertisement