
Advertisement
Advertisement
Natural Gas, WTI Oil, Brent Oil Forecasts – Oil Retreats As U.S. Imposes Additional Iran-Related Sanctions
By:
Key Points:
- Natural gas pulled back amid profit-taking.
- WTI oil moved lower as traders focused on new Iran-related sanctions.
- Brent oil pulled back towards the $77.00 level.

Natural Gas
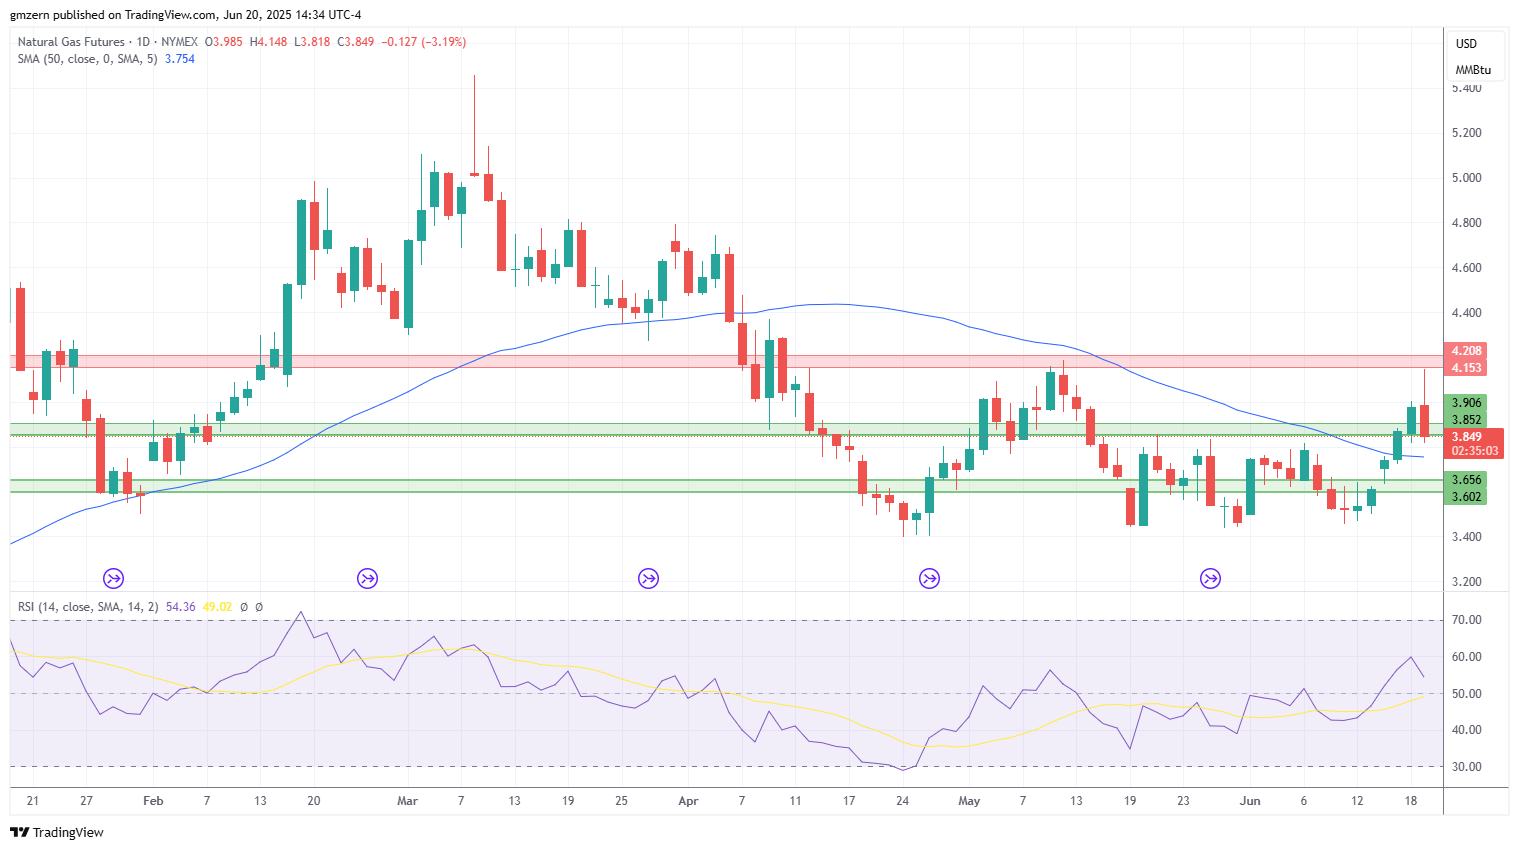
Natural gas tested new highs but lost momentum and pulled back as traders rushed to take profits off the table.
If natural gas settles below the $3.85 level, it will head towards the 50 MA at $3.75.
WTI Oil
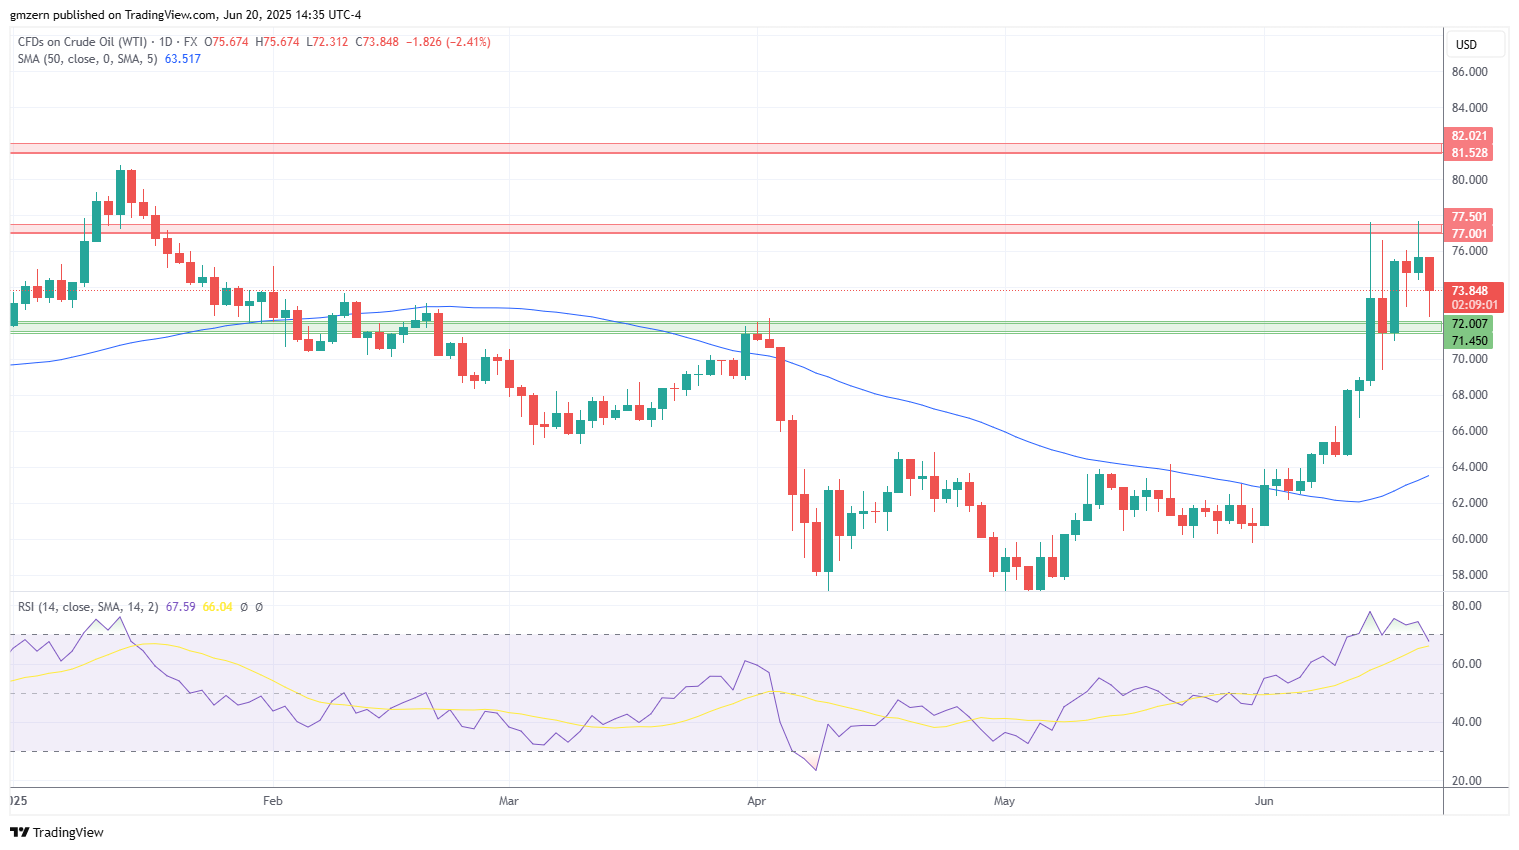
WTI oil pulled back as U.S. introduced additonal Iran-related sanctions. Markets view this move as a sign that U.S. prefers to use diplomatic methods in its relations with Iran.
The technical picture remains unchanged as WTI oil is stuck in a wide range between the support at $71.50 – $72.00 and resistance at $77.00 – $77.50.
Brent Oil
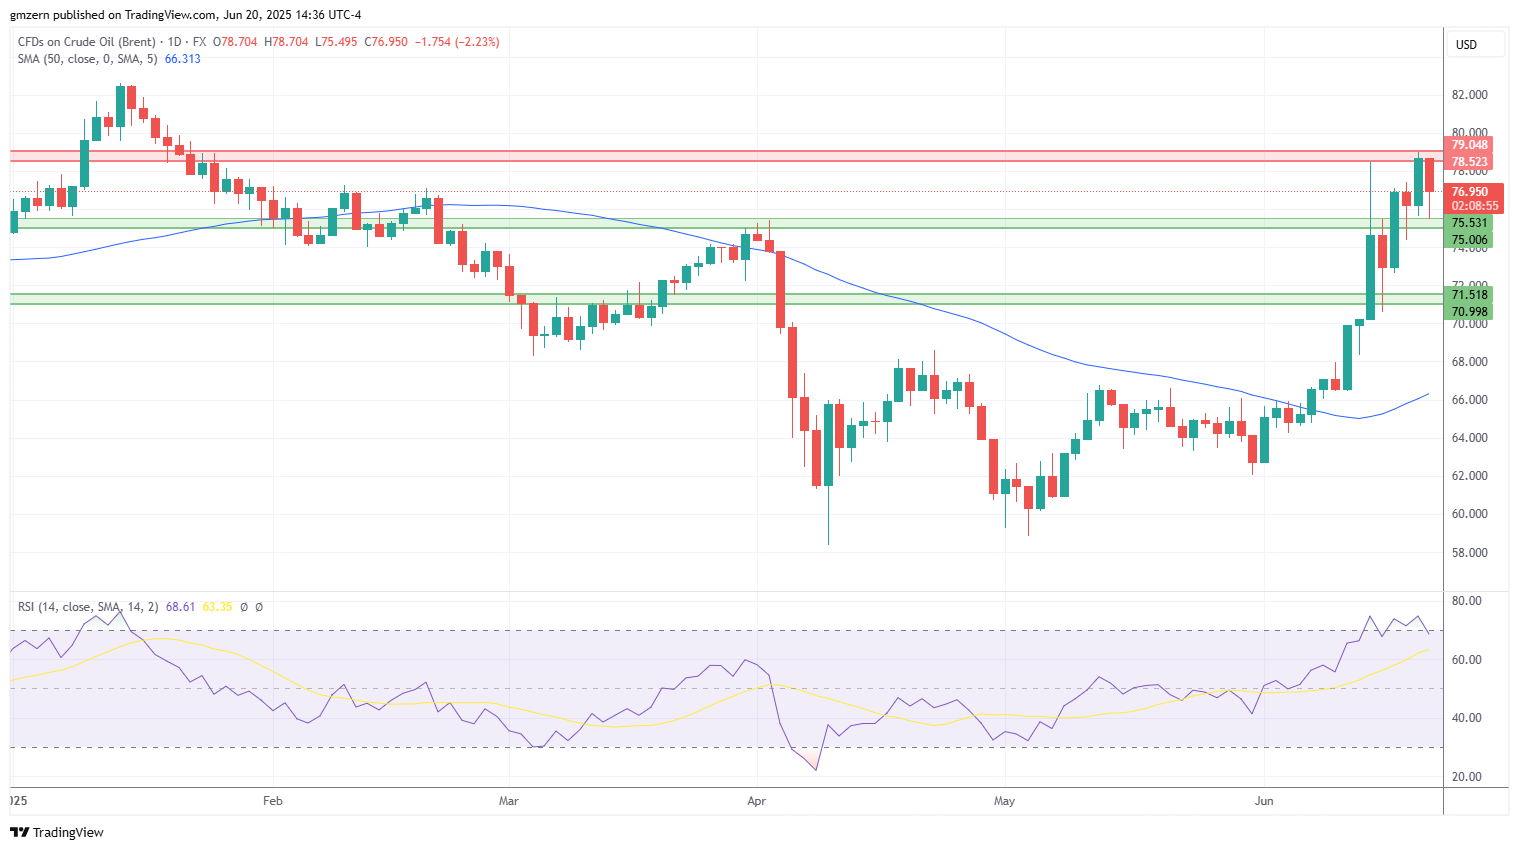
Brent oil has also moved away from recent highs as geopolitical risk premium declined.
A successful test of the support at $75.00 – $75.50 will push Brent oil towards the next support level at $71.00 – $71.50.
For a look at all of today’s economic events, check out our economic calendar.
About the Author
Vladimir Zernovauthor
In more than 15 years of trading in the financial markets, Vladimir dealt with a wide range of brokers and financial instruments. His career as a day-trader at a proprietary trading firm goes back to 2007. Later, Vladimir turned to longer time frames and became an independent trader and analyst managing his own portfolio. Using his experience, he helps traders find the best broker in his reviews.


Advertisement