
Advertisement
Advertisement
Oil and Natural Gas Technical Analysis: Breakouts Amid Iran-Israel Conflict
By:
Key Points:
- WTI Crude Oil (CL) breaks above the 200-day SMA amid the Iran-Israel conflict.
- Natural Gas (NG) continues its bullish momentum above $3.00.
- US Dollar Index (DXY) rebounds from 98.00 but shows signs of uncertainty.

WTI crude oil (CL) edged higher to around $73.00 during early Asian trading on Thursday. Rising geopolitical tensions are creating market uncertainty and supporting crude oil prices as markets react to the potential escalation of conflict. Tensions escalated further after reports that former President Trump privately approved attack plans for Iran.
The Wall Street Journal reported Trump’s conditional approval of strikes, pending Iran’s response to its nuclear program. Iran rejected US demands, raising fears of direct US involvement in the Israel-Iran conflict. These tensions increase the risk to Middle Eastern energy infrastructure and add upward pressure on oil prices.
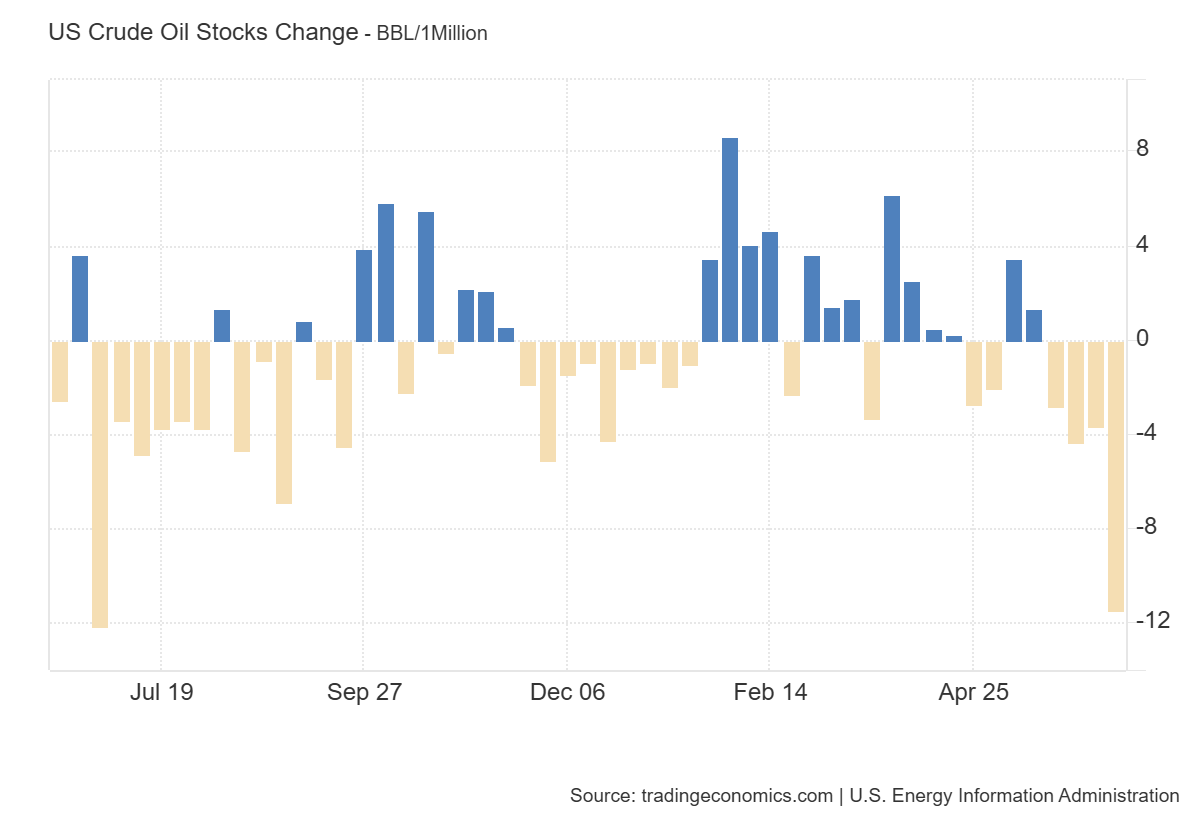
Despite rising geopolitical tensions, US crude oil inventories recorded their most significant weekly draw in a year. The chart below shows that the EIA reported a drop of 11.473 million barrels, far exceeding expectations. However, the upside may be limited, as the International Energy Agency lowered global demand forecasts and raised supply estimates in its latest report.
WTI Crude Oil (CL) Technical Analysis
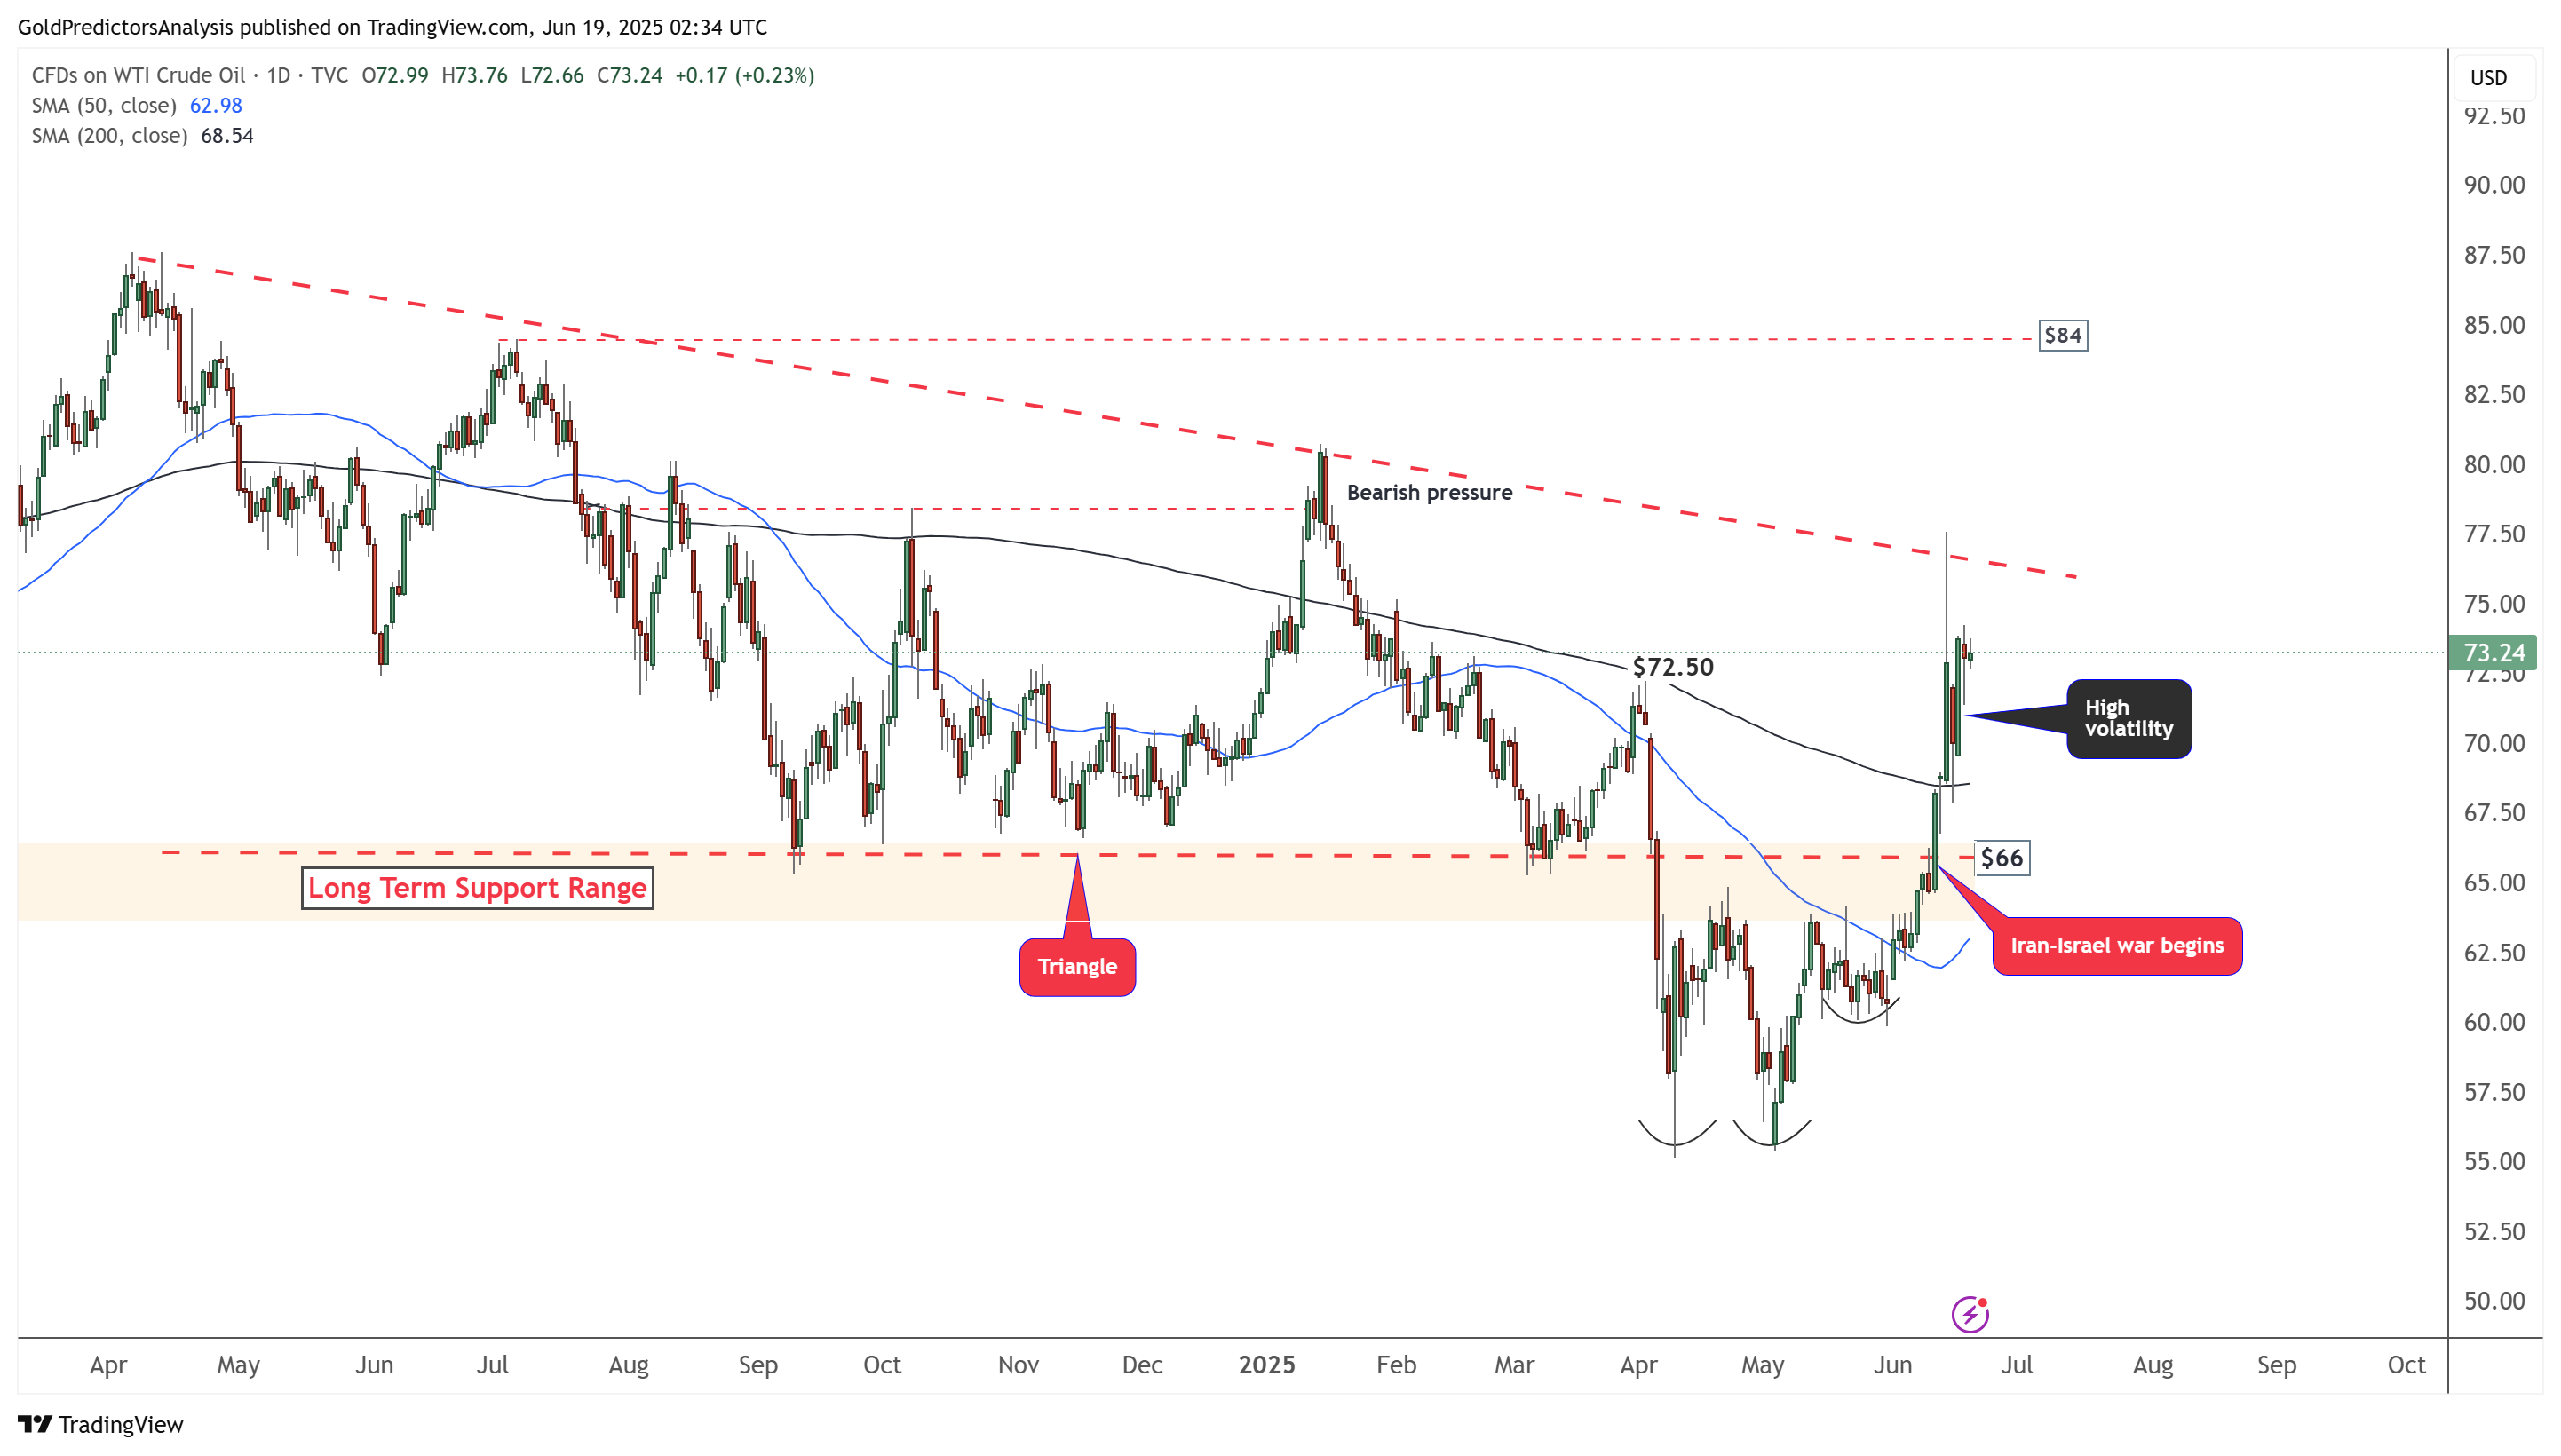
WTI Oil Daily Chart – Price Surge
The daily chart for WTI crude oil shows that the price has surged above $66 in response to the conflict between Iran and Israel. The price has broken above the 200-day SMA and is exhibiting high volatility following the breakout. This volatility suggests that the price may soon break above the red dotted trend line. This breakout could potentially trigger a strong move toward the $80 to $84 area.
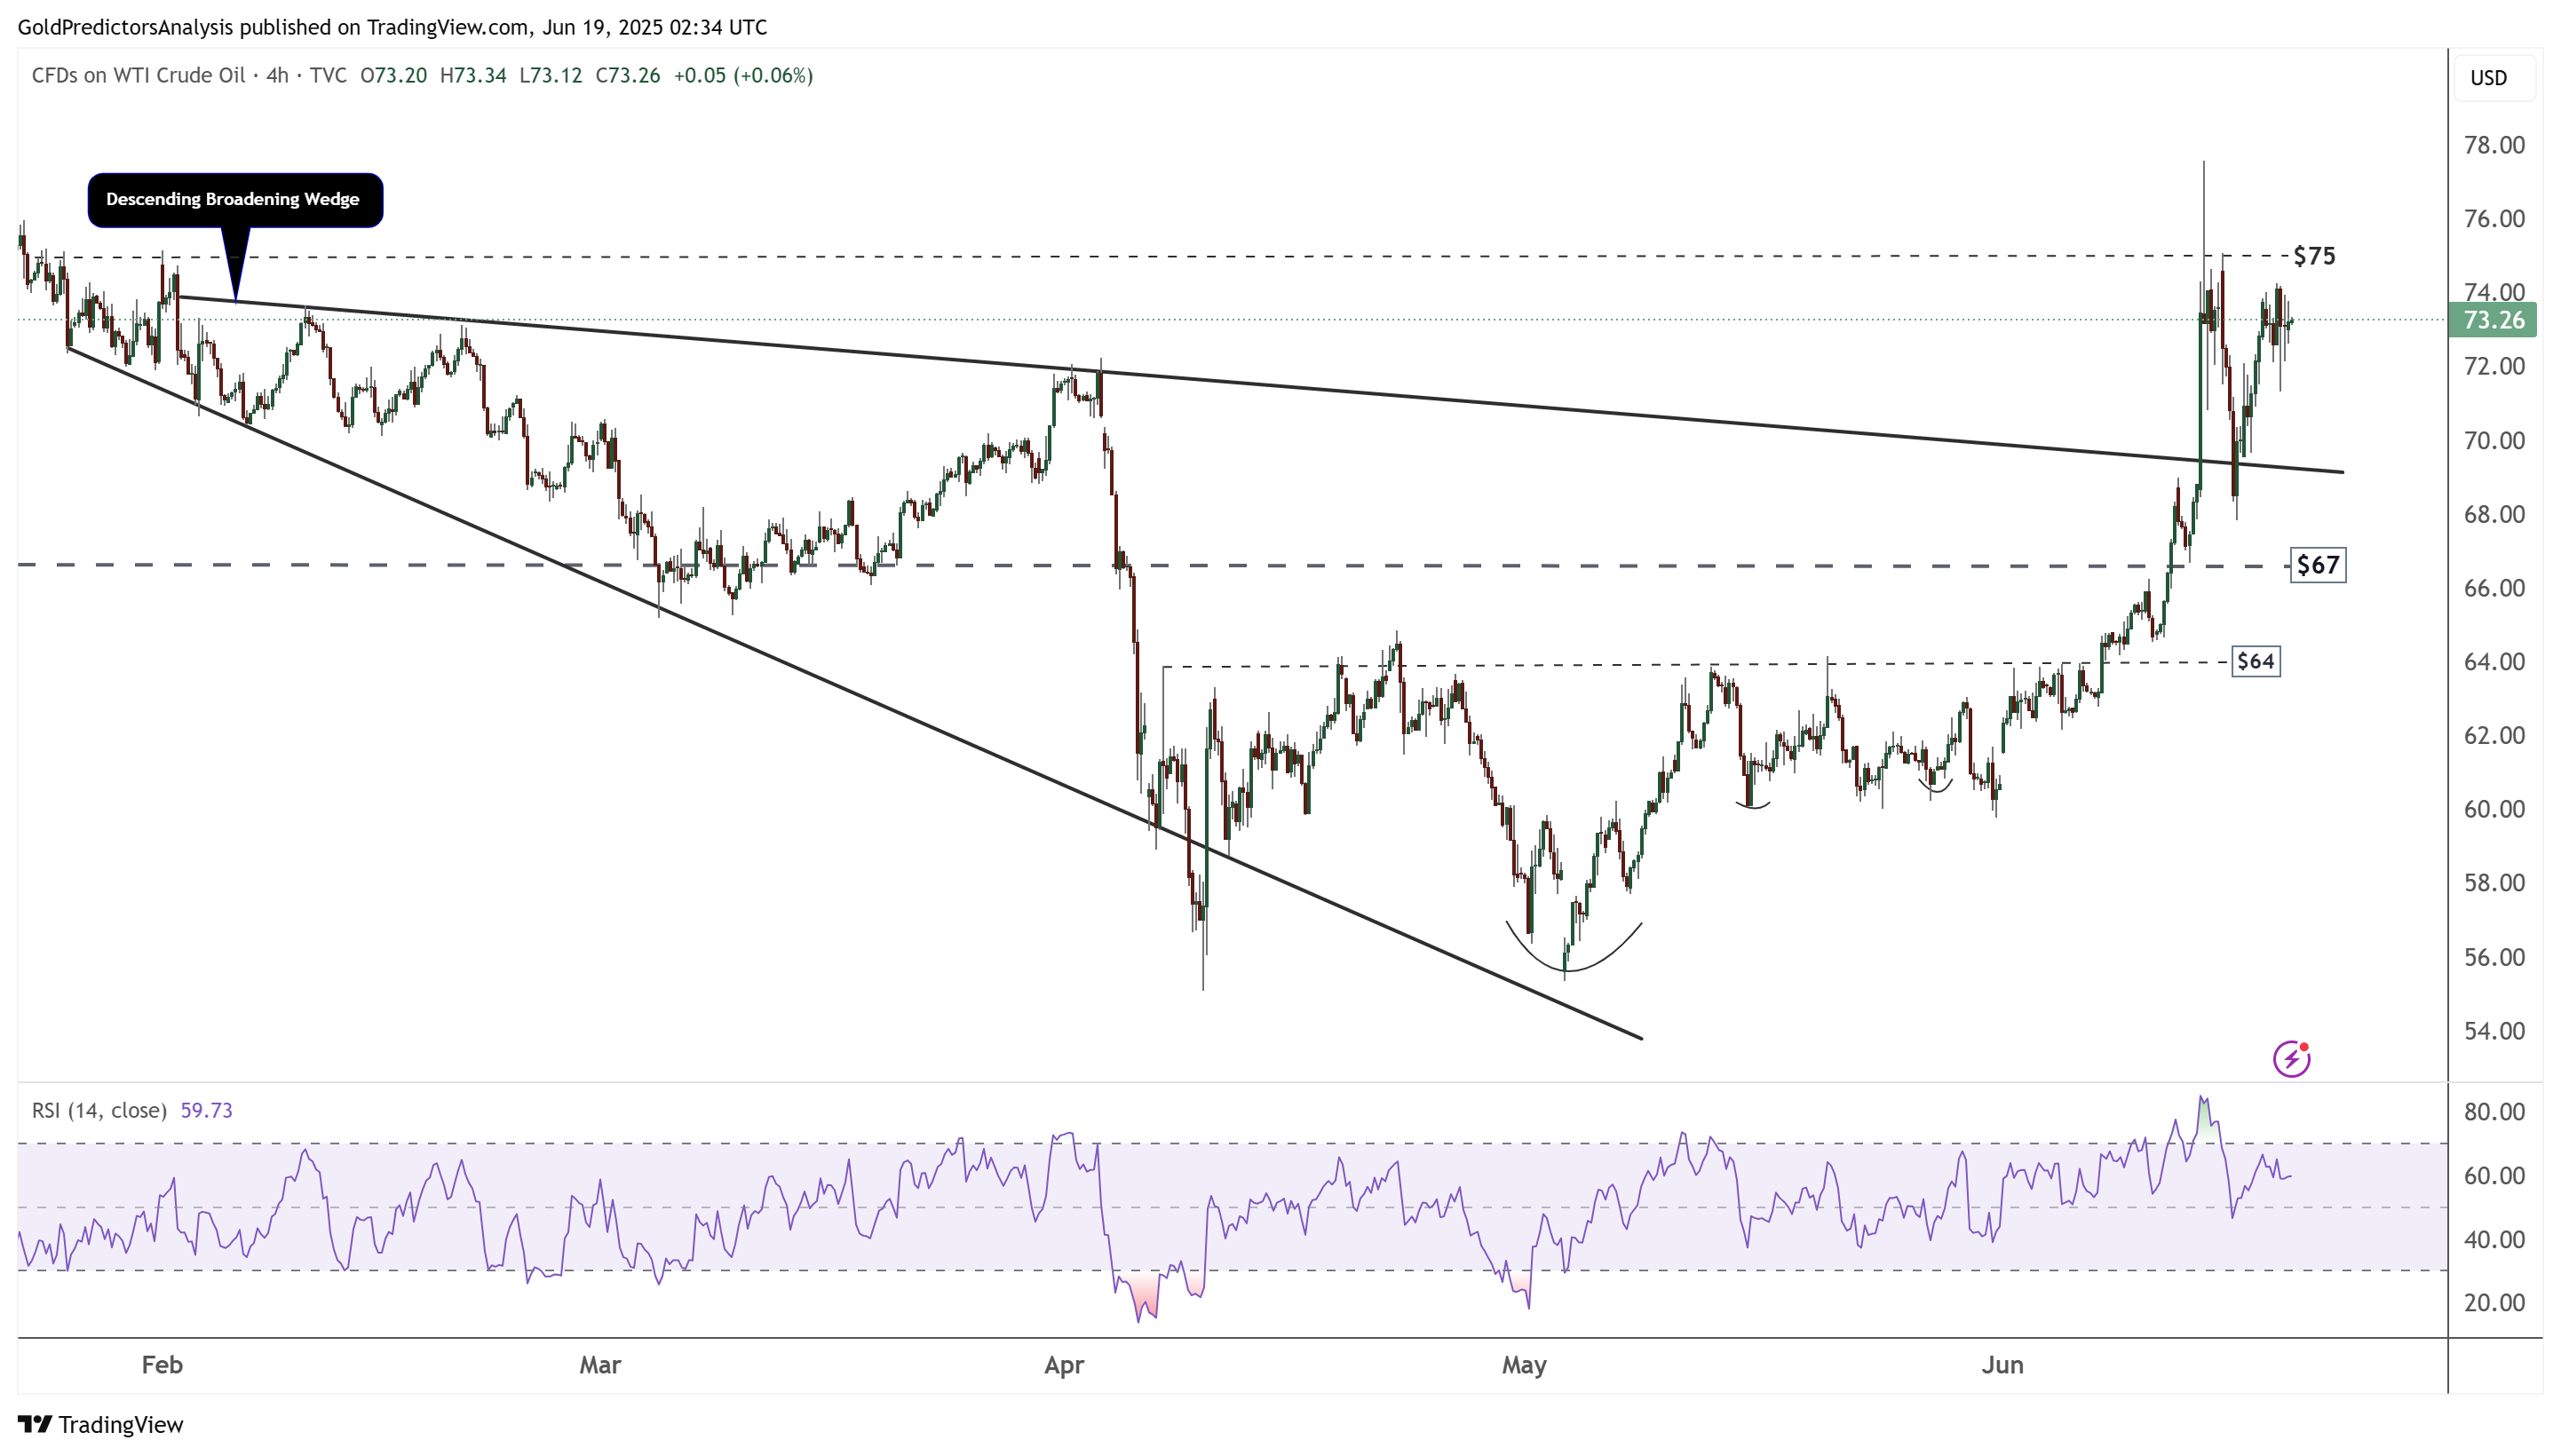
WTI Oil 4-Hour Chart – Descending Broadening Wedge
The 4-hour chart for WTI crude oil indicates that the price has broken out of the descending broadening wedge pattern and reached the pattern’s target, located near the $75 area. The price is now consolidating below $75 and is showing signs of building further positive momentum.
A break above $75 could trigger a move toward $80, while a break above $80 may lead to a rally toward $84. The risk of supply disruptions in the Middle East has fueled this strong bullish momentum, supporting a continued positive outlook for WTI crude oil.
Natural Gas (NG) Technical Analysis
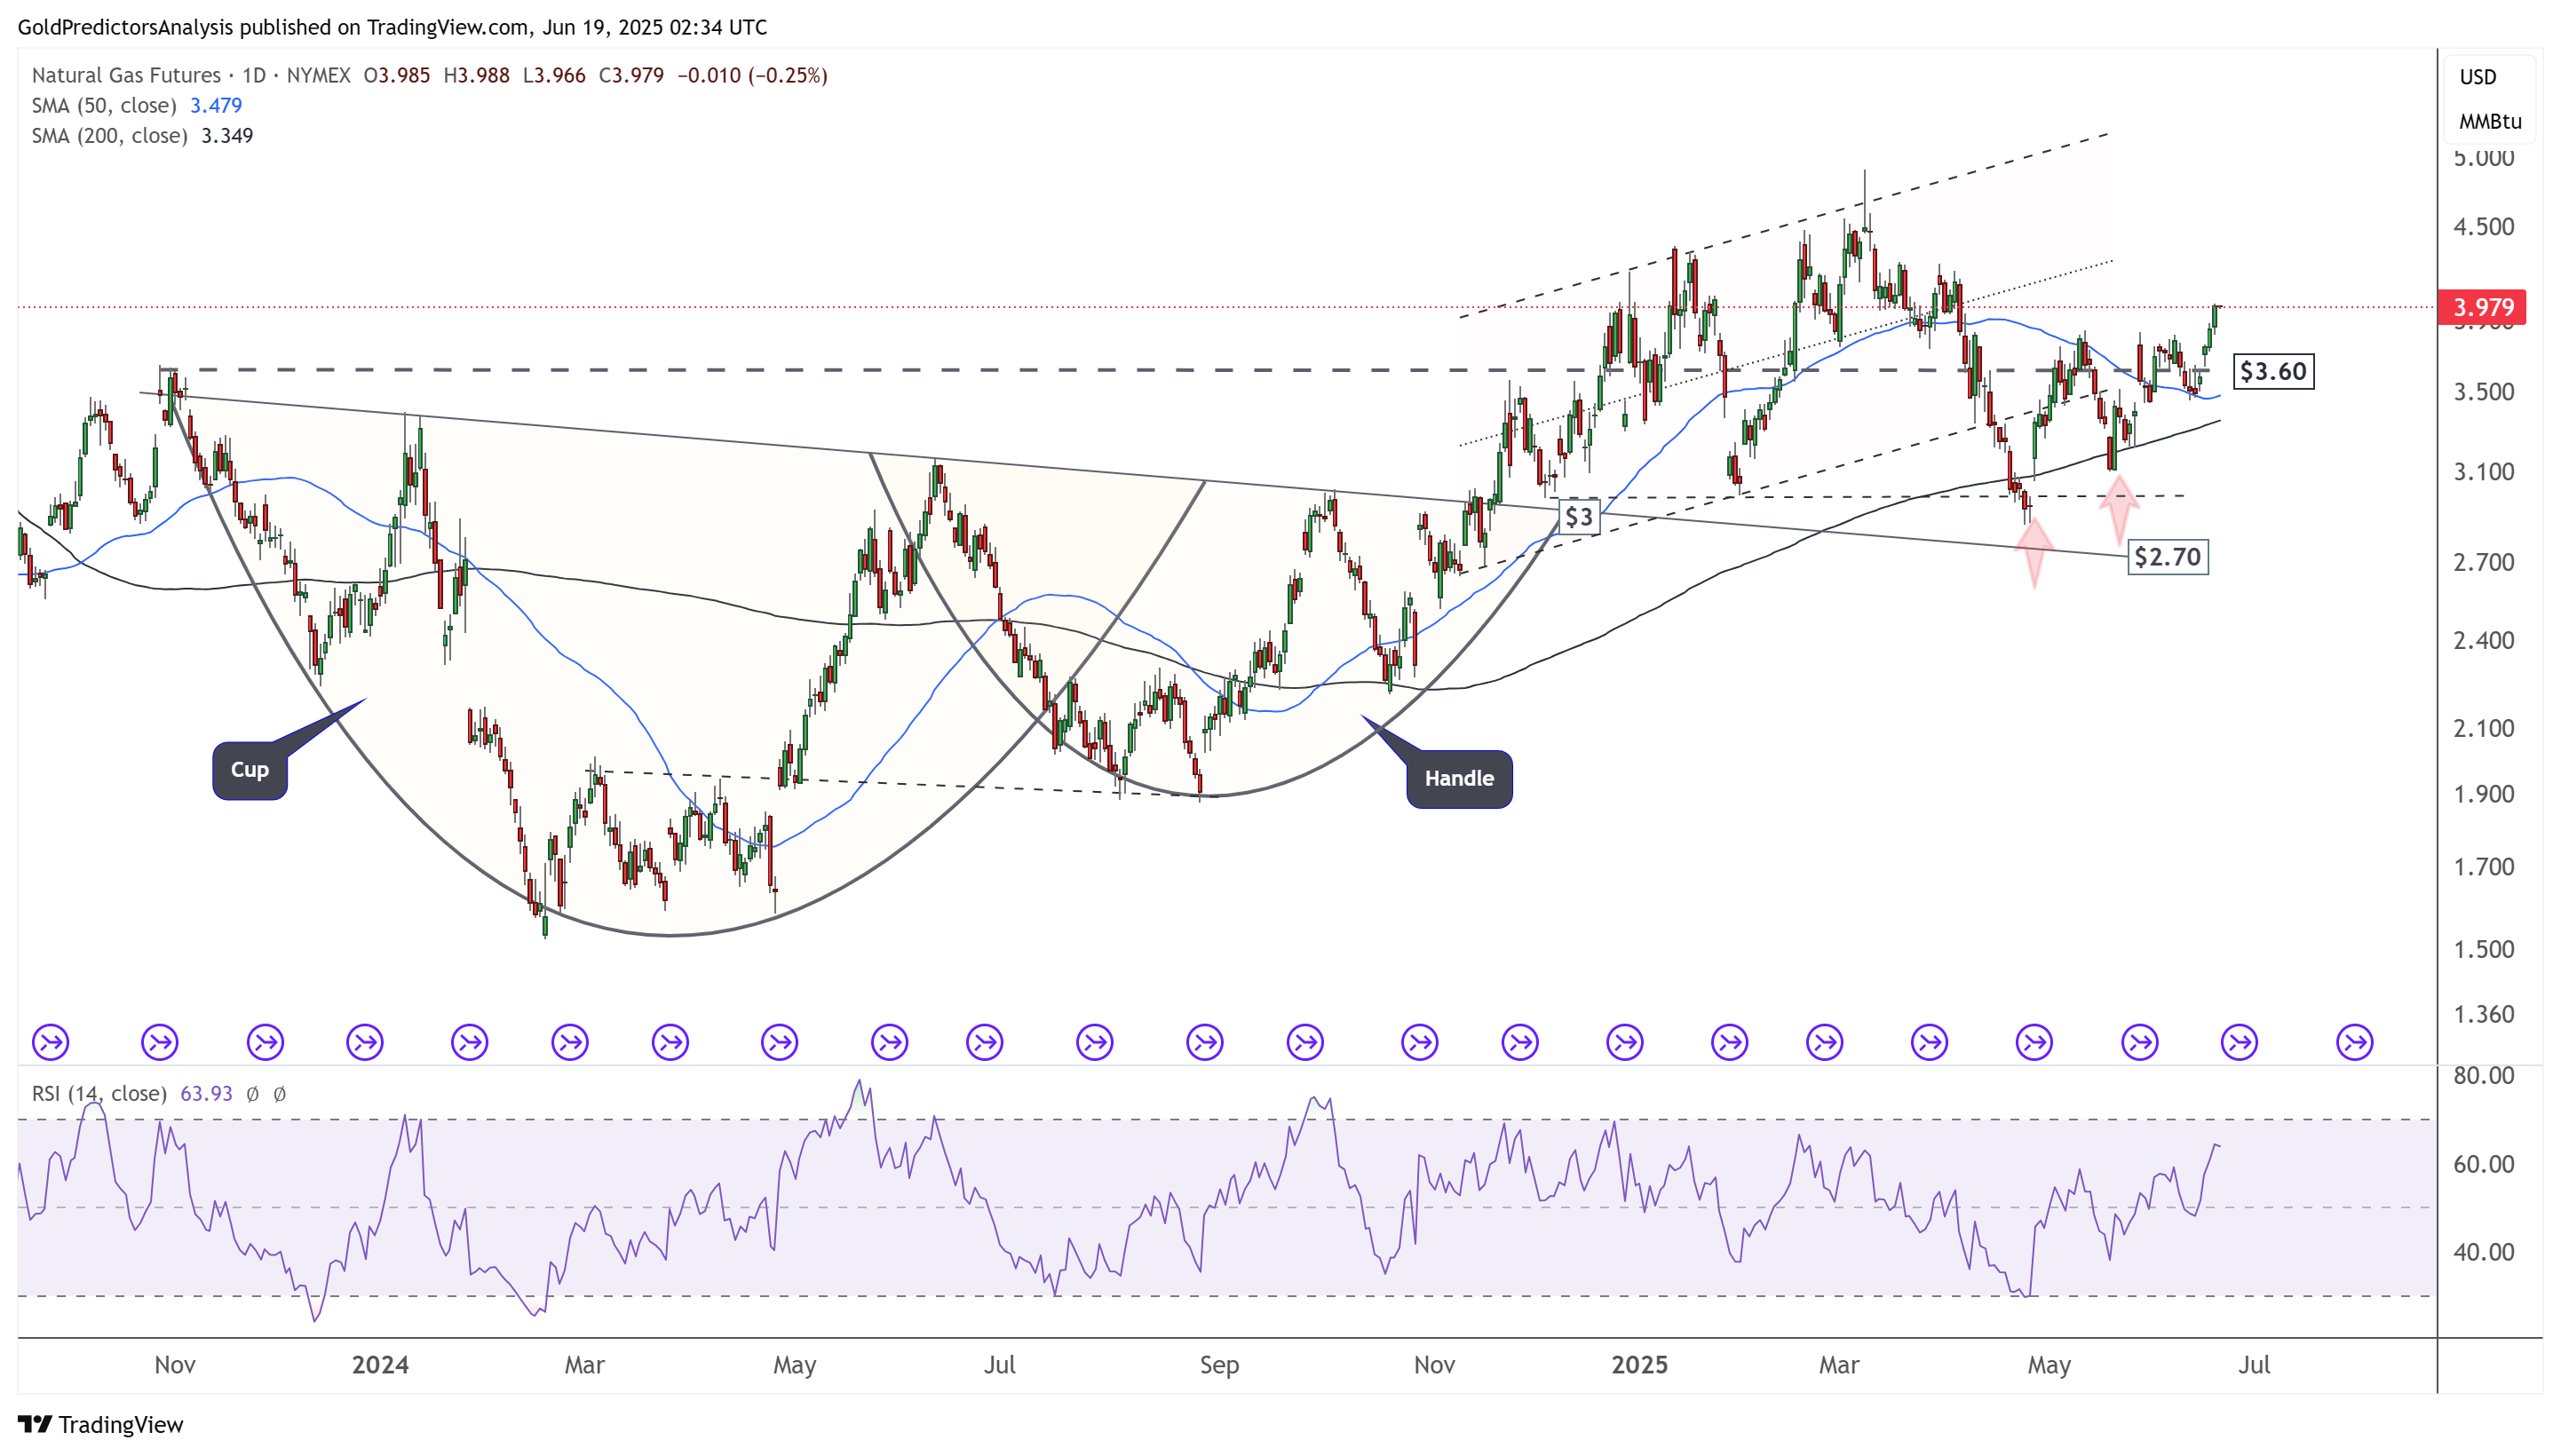
Natural Gas Daily Chart – Key Level of $3
The daily chart for natural gas indicates that the price is rebounding from the $3.00 support area, displaying bullish momentum. The price has broken above the 50-day SMA and continues its upward movement. The positive price action above $3.00 suggests a potential move toward the $5.00 area. Moreover, the emergence of a cup and handle pattern indicates long-term bullish momentum in natural gas prices.
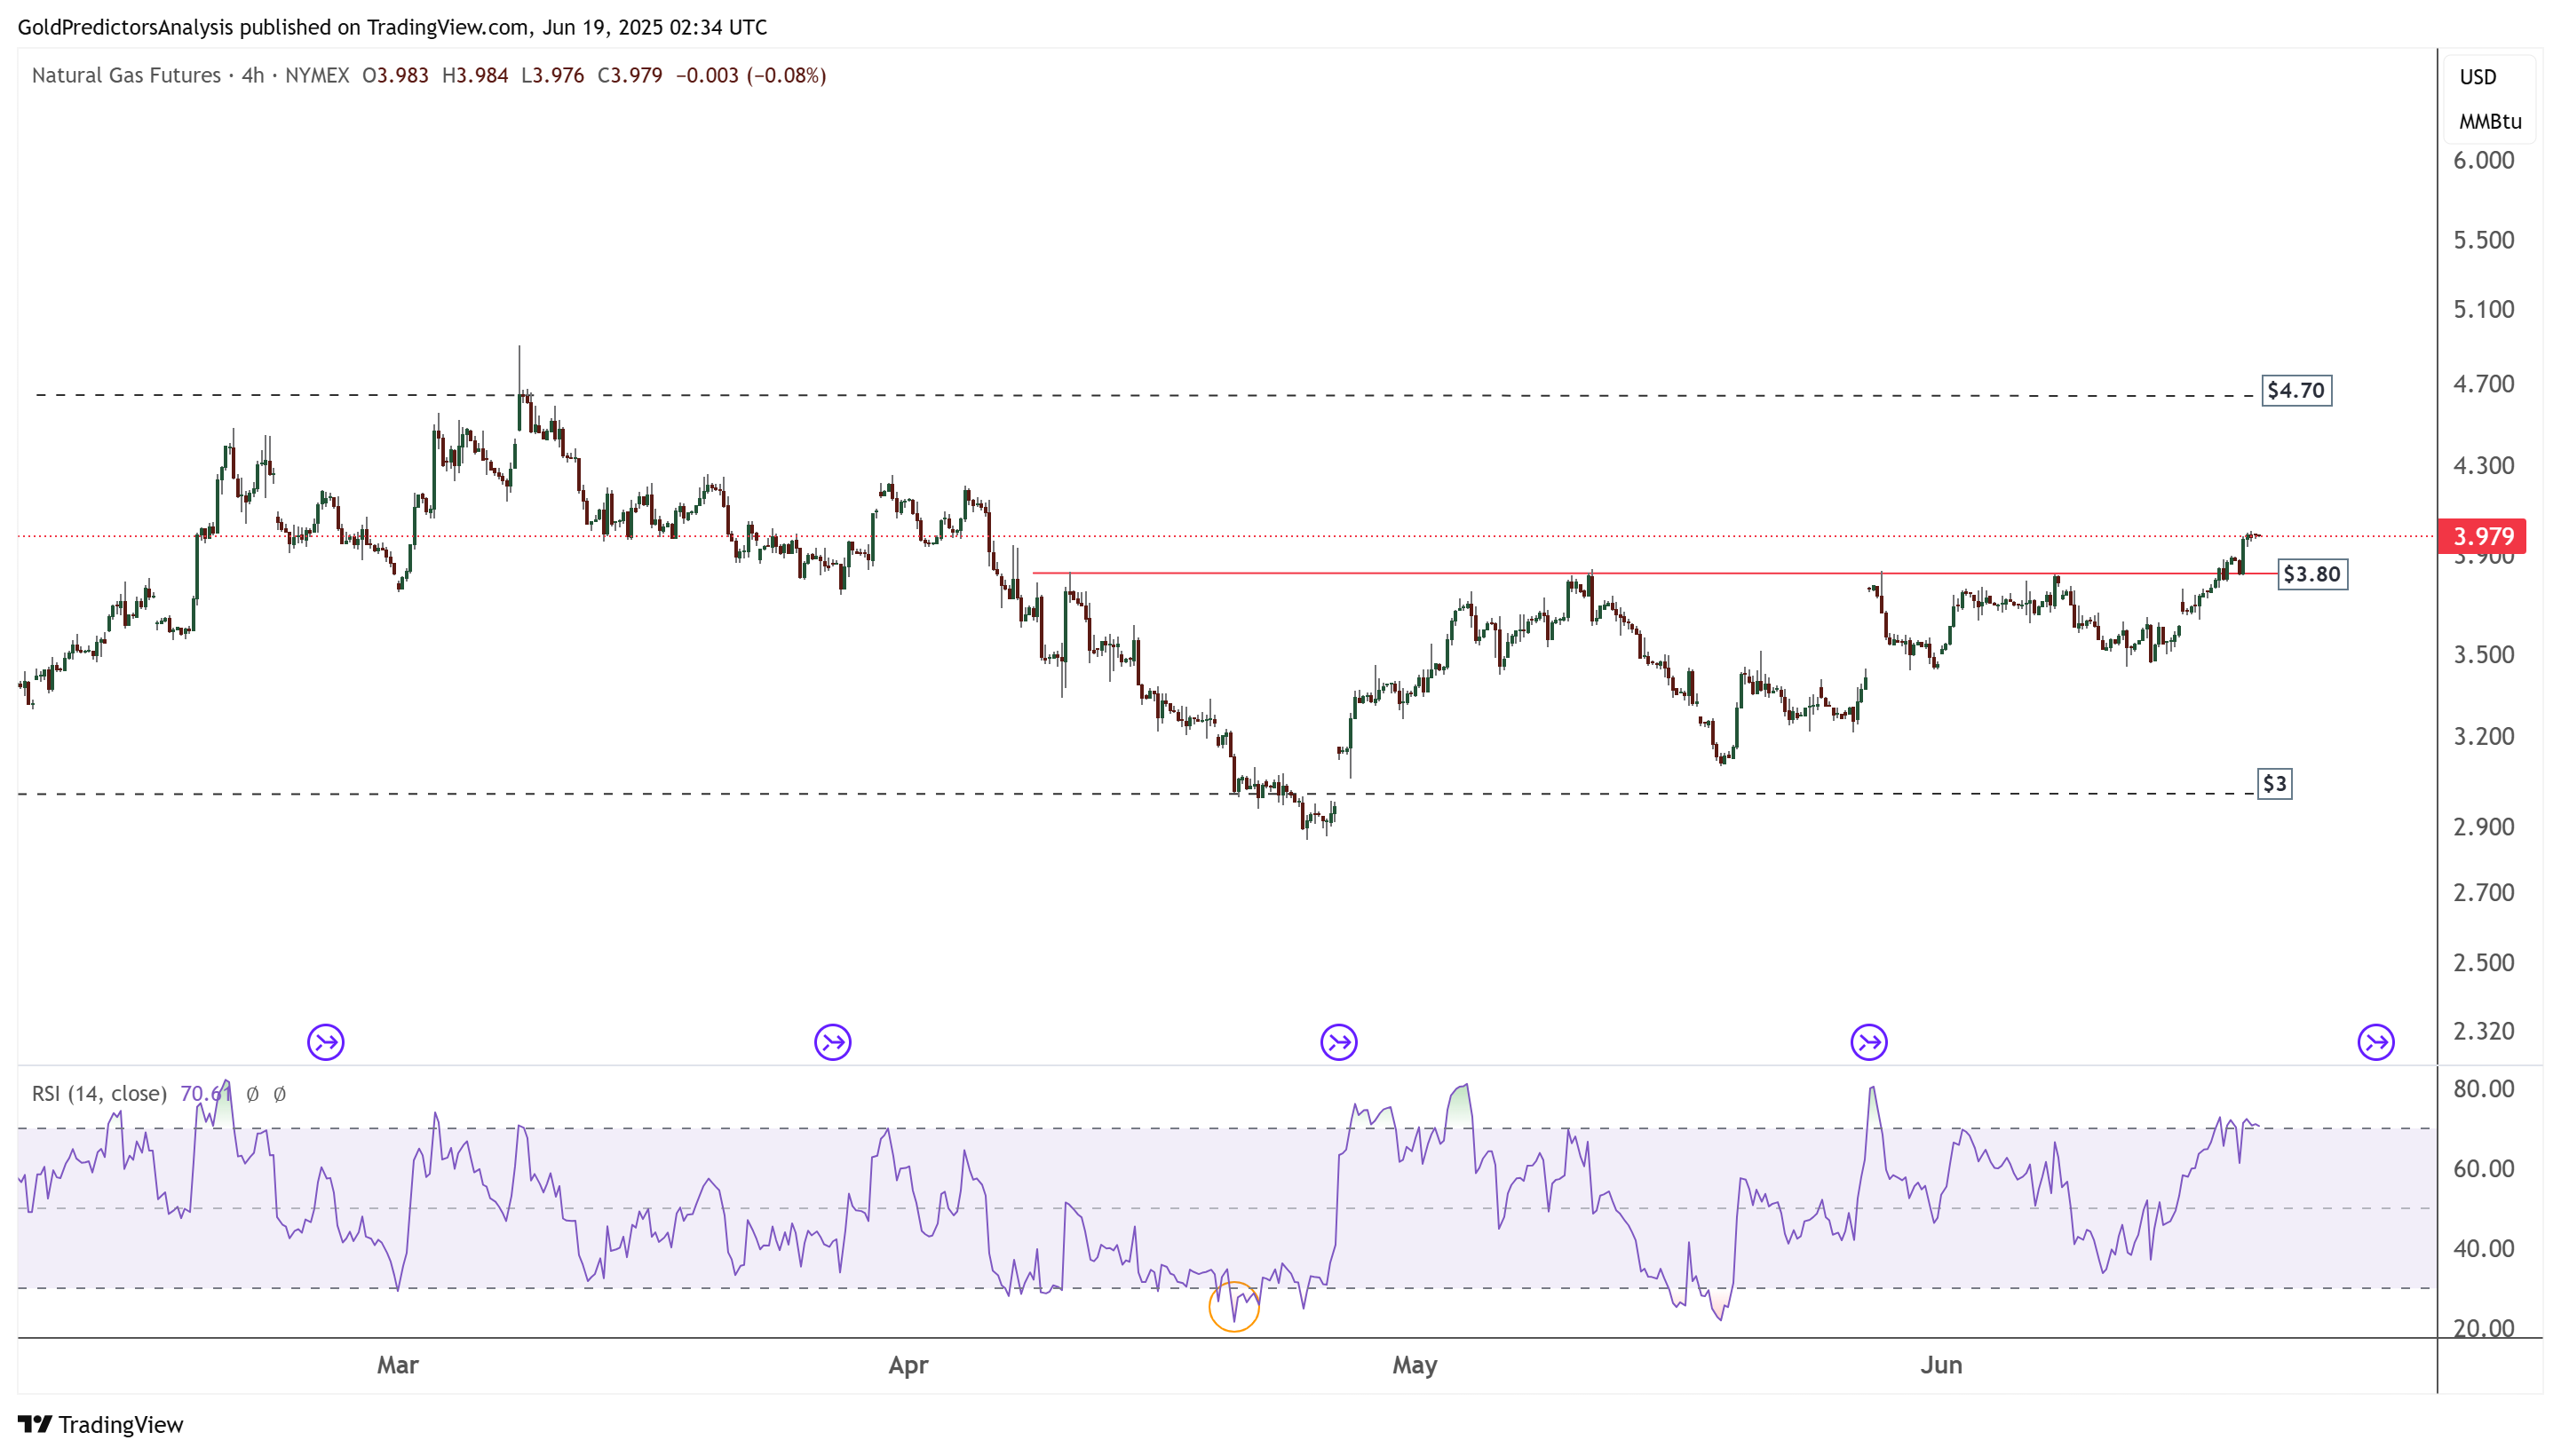
Natural Gas 4-Hour Chart – Breakout
The 4-hour chart shows that the price has broken above $3.80, indicating a potential move toward the $4.70 area. The price action between the $3.00 and $3.80 range was positive, suggesting a continuation of the bullish trend in the coming days.
US Dollar (DXY) Technical Analysis
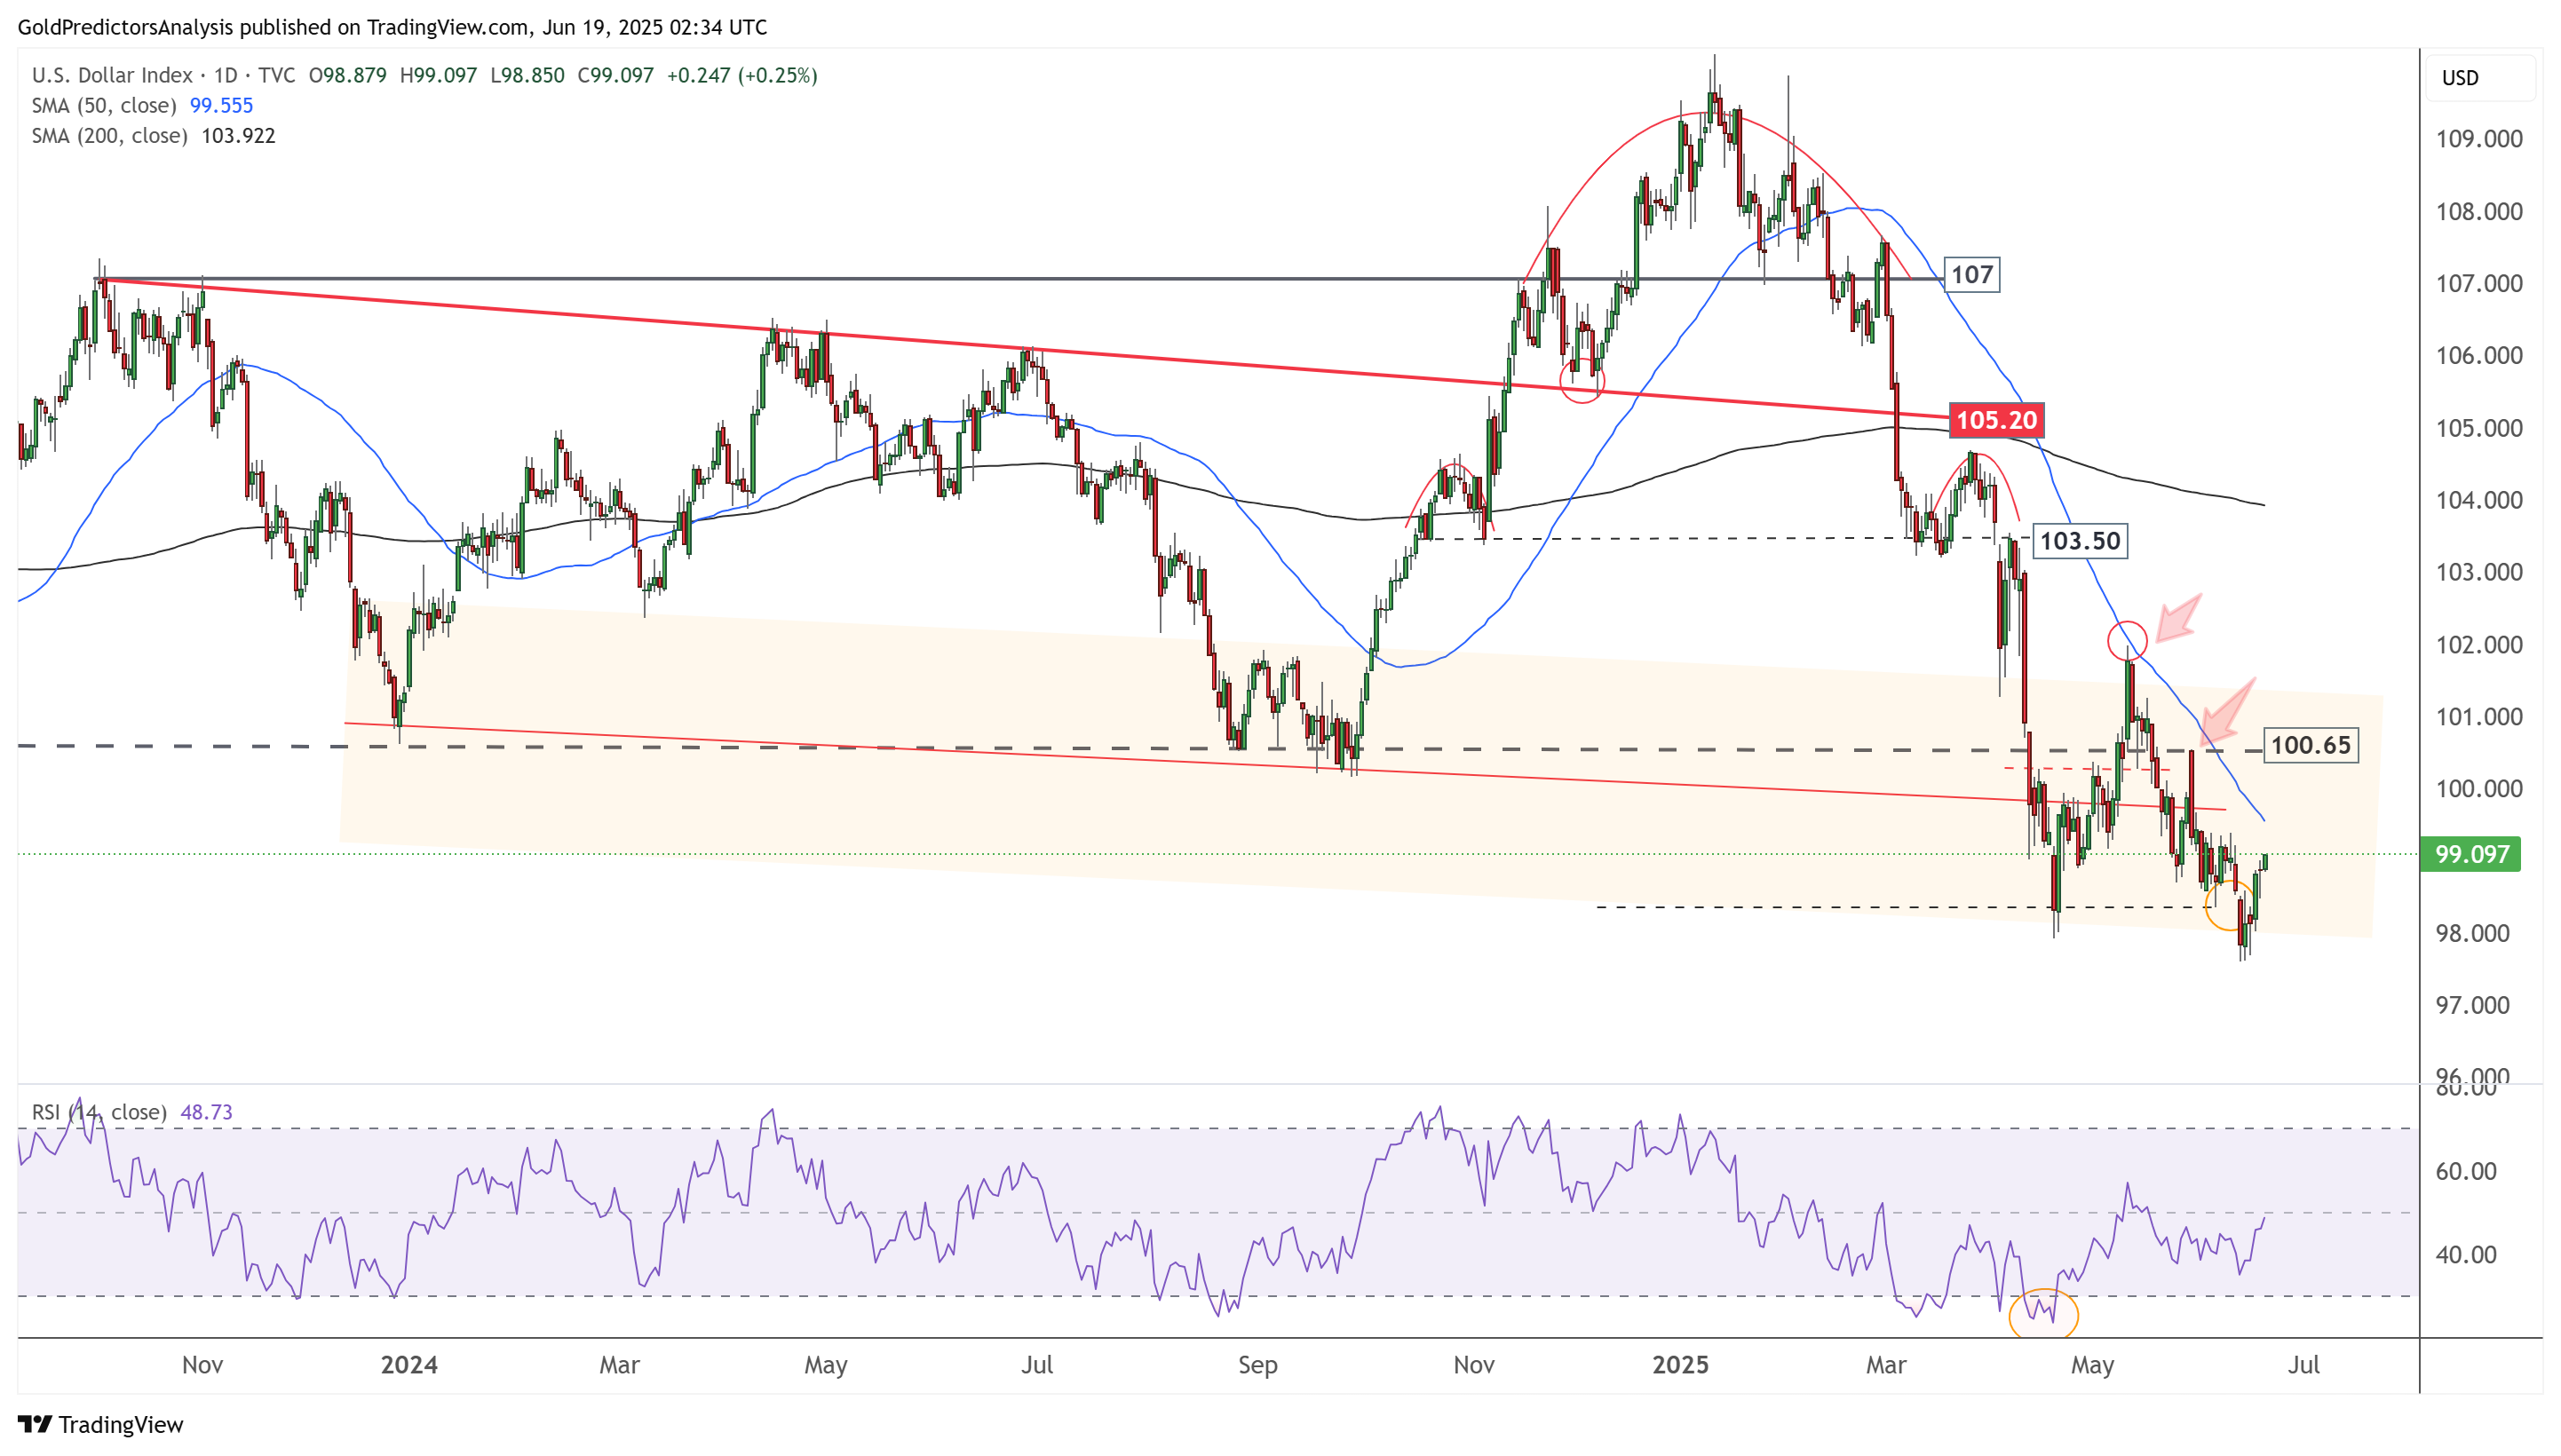
US Dollar Daily Chart – Rebound
The daily chart for the US Dollar Index shows a rebound from the 98.00 support area. The index is moving toward the 50-day SMA at 99.50. A break above the 50-day SMA could trigger a move toward 100.65. However, as long as the index stays below 100.65, bearish momentum is likely to continue.
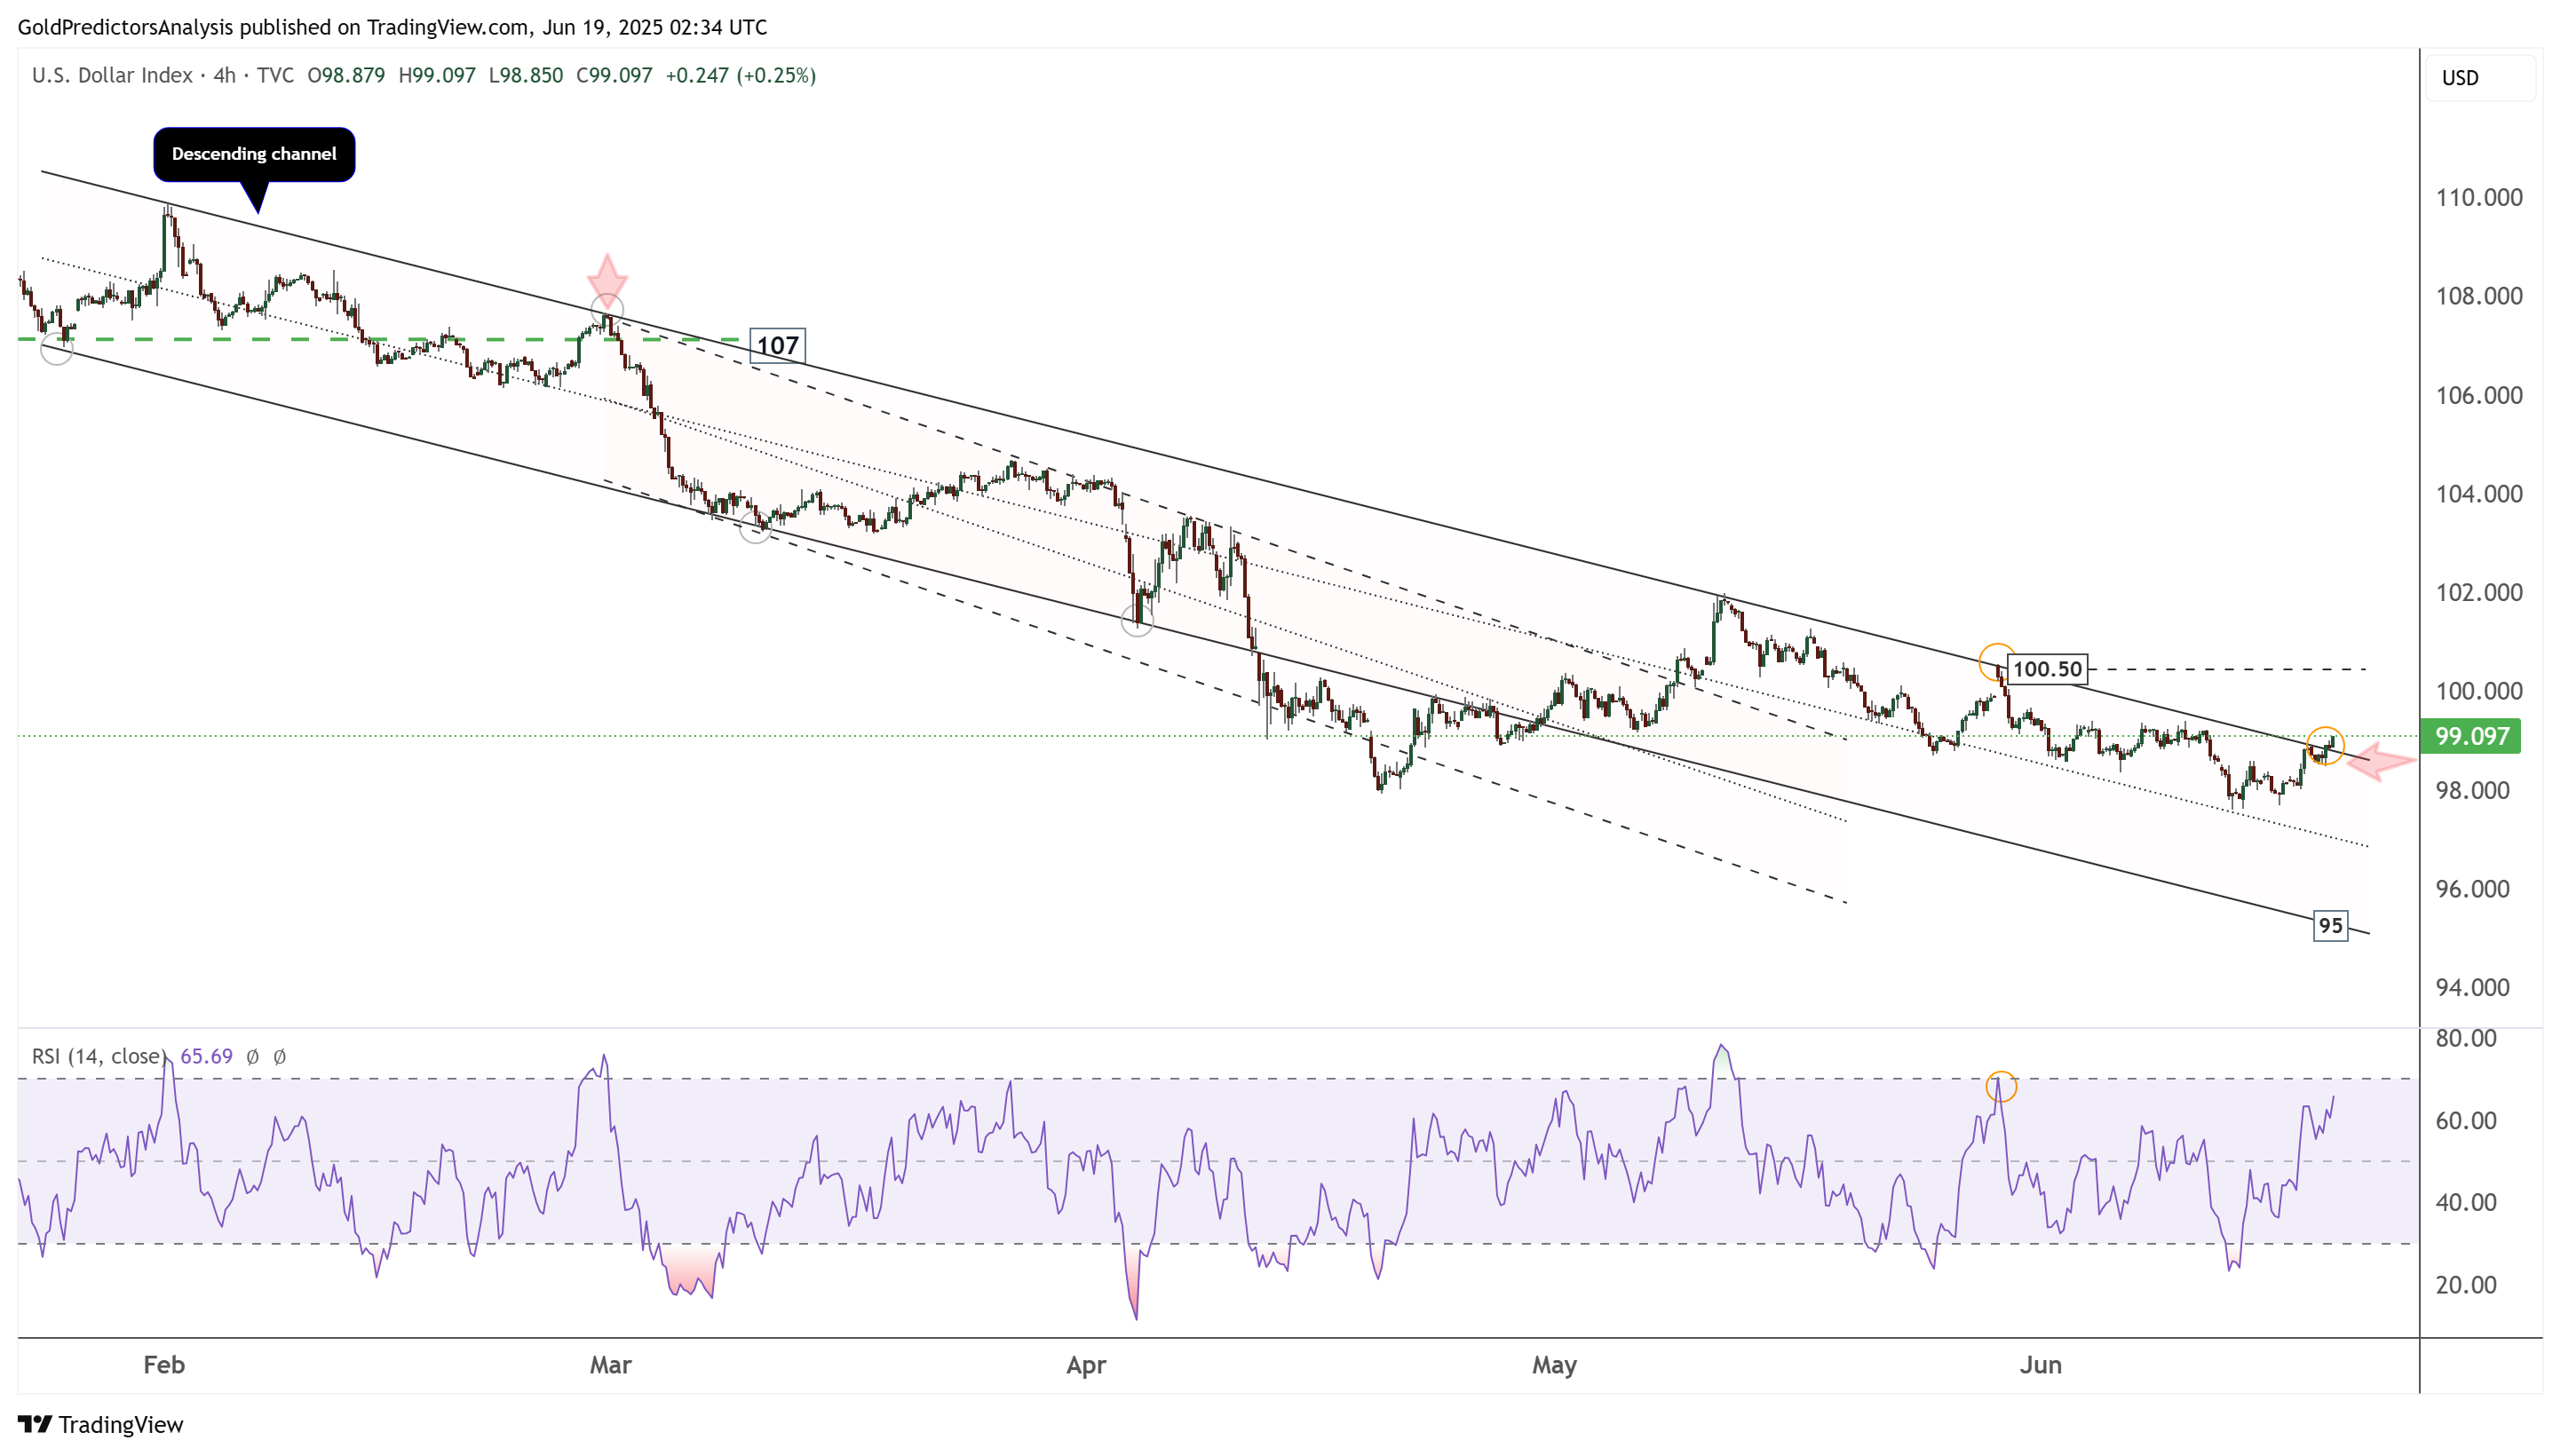
US Dollar 4-Hour Chart – Descending Channel
The 4-hour chart for the US Dollar Index also shows that the index is attempting to break above the descending channel and initiate a move toward the 100.50 resistance level. A break above 100.50 could trigger a rally toward the 102.00 area. However, failure to break above 100.50 may lead to another downward move in the index.
About the Author
Bob MasonChief Crypto Boss
123456789 30 He has written extensively for a broader audience and his current focus is on developments relating to the financial markets including, but not limited to currencies, commodities, alternative asset classes, and global equities.


Advertisement