
Advertisement
Advertisement
Silver Price Forecast: Consolidates Near Highs, Breakout or Breakdown Looms
By:
Silver consolidates in a potential bull pennant pattern, with bullish follow-through likely if price breaks above $32.99 toward $33.70 and higher.
Silver continued to consolidate on Monday as it confirmed the formation of a potential bull pennant pattern (purple). Monday’s low of $31.89 is the second point for the lower boundary line of a small symmetrical triangle. Notice that the pattern has formed above support of the 38.2% Fibonacci retracement level at $31.63 and it followed a sharp advance (pole). A successful test of the retracement level occurred on May 1. Buyers quickly took charge as seen by the long lower shadow. Similar bullish behavior took place today following the $31.89 low. Such intraday bullish behavior would be consistent with improving demand.
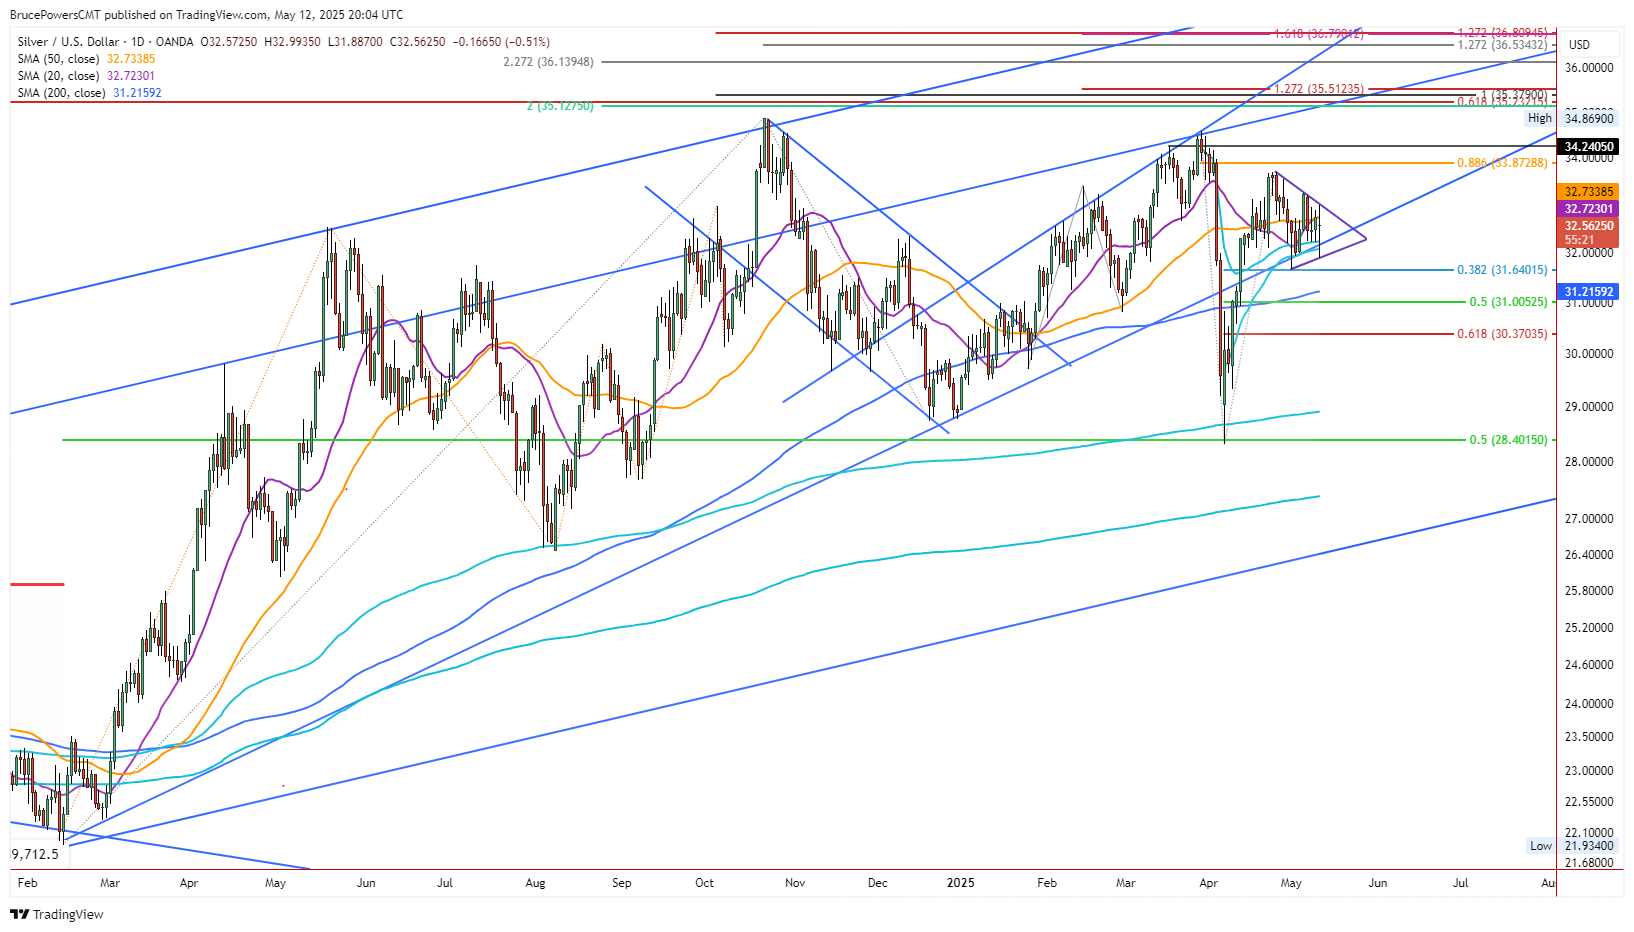
Above $32.99 is Bullish
The high for today of $32.99 is an initial upside price level to watch, as a breakout above it would follow an initial breakout for the bull pennant. Today’s low is the support price level to watch along with the lower boundary line. There are a couple related issues to be considered. Although there is a bull pennant pattern present, it has formed within an area of prior consolidation.
Therefore, the reliability of the upside follow-through following a breakout is questionable. Alternatively, a decline through the bottom of the pennant would be a bearish reversal from a small symmetrical triangle pattern. The potential bullish pennant pattern would be invalidated as it would not have triggered.
Confirmation of Strength Above $33.70
At the top of the pennant is the recent rally high of $33.70. That high becomes an initial short-term target and a new bullish signal if an upside breakout triggers. The prior swing highs around $34.24 to $34.59 from March would then become a target, as well as the long-term trend high of $34.87 from October. There was enthusiastic buying seen following the $28.32 swing low in early April. A 50% retracement was seen on the low and it was joined by an AVWAP level from the October 2023 swing low.
Bearish Below $31.89
A downside trigger, below $31.89 will likely lead to a test of support around the 200-Day MA, currently at $31.22. It can be watched along with the 50% retracement level at $31.00. Further down is the 61.8% Fibonacci retracement at $30.37. Finally, it can also be useful to recognize that the 20-Week MA has done a good job of defining support over the past several weeks. Therefore, a drop $31.91 will trigger a bearish decline below the 20-Week MA.
For a look at all of today’s economic events, check out our economic calendar.
About the Author
Bruce Powerscontributor
Bruce has been involved in the financial markets for over 20 years, as an analyst, trader, educator, and writer.


Advertisement