
Advertisement
Advertisement
SOL Hits Key Support on Weekly Chart – Can It Bounce Back to $180?
By:
Key Points:
- SOL has bounced off a key weekly support and could rise to $180 if momentum picks up.
- Solana-based decentralized apps have made five times more money than Ethereum’s.
- SOL has been in consolidation ahead of the American session today.

However, the weekly chart shows that SOL bounced off a key support this past week and this could set the stage for a strong comeback as a bullish pattern has now emerged.
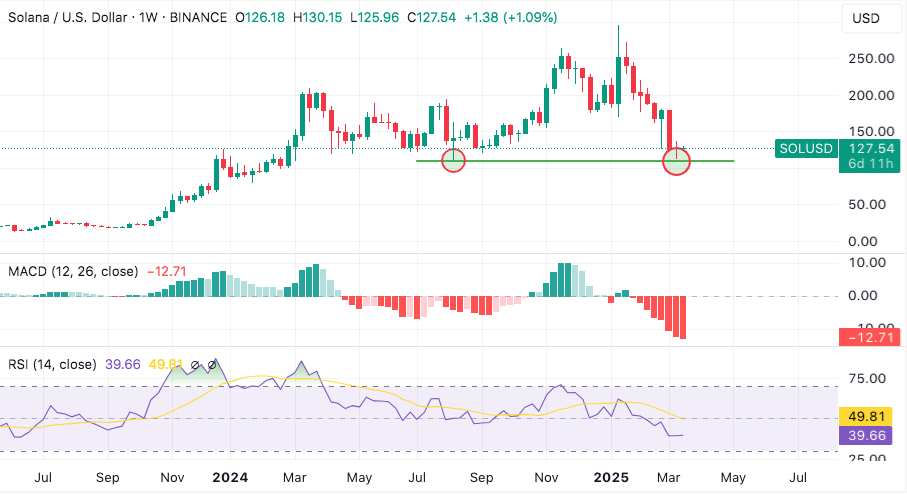
SOL is the second worst-performing asset of the top 5 with yearly losses of 32.6%, only surpassed by Ethereum (ETH) whose annual retreat currently stands at 42.7%.
The meme coin winter, as some have called the latest bearish cycle that this category has gone through, has impacted the valuation of this smart contracts platform since 2025 started.
The aggregated market value of this entire segment has plummeted from $137 billion back in December to $49 billion at the time of writing as the Federal Reserve has been reluctant to lower interest rates amid fears that Trump’s hostile trade policies could result in higher inflation.
However, SOL is still outperforming ETH as DeFi apps within its ecosystem seem to be making more money.
According to data from DeFi Llama, Ethereum dApps made $58.8 million in February compared to $268.2 million that Solana’s DeFi apps like Jupiter, Jito, and Raydium brought home during this period.
As its ecosystem keeps thriving, SOL’s bounce off its weekly support could be a sign that the token’s latest downtrend has hit a bottom.
Double-Bottom Pattern Confirmed by Momentum Indicators
Moving to the daily chart, Solana (SOL) has been recovering in the past few days after it came near the $110 level at some point last week. Momentum indicators have been improving and the Relative Strength Index (RSI) has already sent a buy signal.
Meanwhile, the MACD’s histogram shows that positive momentum has been steadily rising, which favors a bullish outlook for SOL.
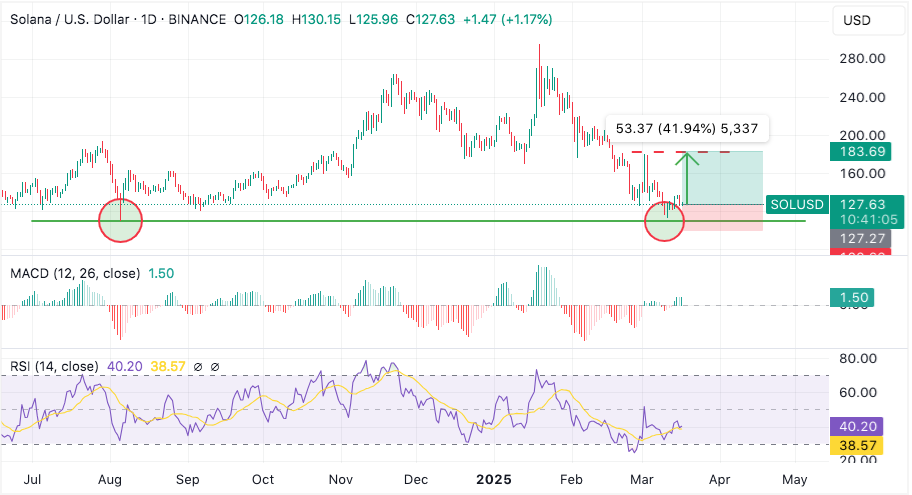
A double-bottom pattern has emerged as a result of this bounce off the $110-$112 area. However, SOL still has a long way to go to reverse its downtrend.
For that to happen, the price would have to rise by at least 42% to $180 or so to retest its most recent lower high and above the $190 level to decisively break above that resistance.
Double-bottoms are high probability setups and considering how depressed market sentiment is at the moment, we may not be too far from the market’s bottom.
An interesting opportunity emerges for swing traders as a result of this bounce. Now that momentum indicators have confirmed a bullish outlook, a long position with a stop price set below the $110 level offers a risk-reward ratio of 2.12 if SOL retests its lower high from March 2.
SOL Consolidates After Sunday’s Drop
Heading to the hourly chart, SOL is in consolidation mode after it shed some of its Thursday-Friday gains on Sunday. The $125 level is the most relevant support level in the near term for scalpers as a break above would accelerate the downtrend that started during the weekend.

Meanwhile, if the price rises above the $131 level during the American session, this would confirm a bullish short-term outlook that could push BTC above its weekend highs of $137 per token.
Both scenarios offer attractive risk-reward ratios although the most appealing of the two would be the bullish breakout above $132 as that trade offers a 2.7 RR ratio based as it has a higher exit target.
Momentum indicators favor a bearish outlook as the Relative Strength Index (RSI) has moved below the signal line. Meanwhile, the MACD’s histogram shows steadily declining momentum readings.
However, unless the price breaks below the $125 level this could still be a bear trap. The American session will likely determine the trend’s direction.
About the Author
Bob MasonChief Crypto Boss
TEST 30 He has written extensively for a broader audience and his current focus is on developments relating to the financial markets including, but not limited to currencies, commodities, alternative asset classes, and global equities.
Did you find this article useful?
Latest news and analysis


Advertisement