
Advertisement
Advertisement
Ethereum Price News: ETH Could Drop to $1,500 After Breaking Key Weekly Support
By:
Key Points:
- ETH broke below a key support in the weekly chart that could result in a drop to the $1,500 level.
- Solana’s DEXs made five times more money than Ethereum’s.
- ETH enters consolidation as traders wait for a catalyst before making their next move.

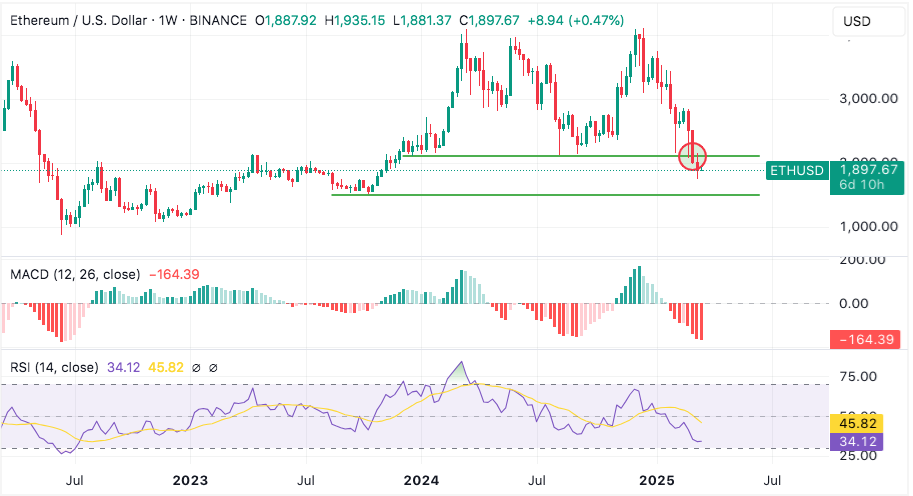
ETH’s weekly chart shows that the downtrend accelerated last week as Ethereum closed below the $2,000 psychological support area.
Momentum indicators continue to be heavily depressed as the Relative Strength Index (RSI) currently sits 27% below the signal line while negative momentum readings on the MACD’s histogram stand at their lowest level since June 2022.
As a result of this latest weakness, the ETH/BTC pair has hit its lowest level since December 2020 and currently sits at 0.02292.
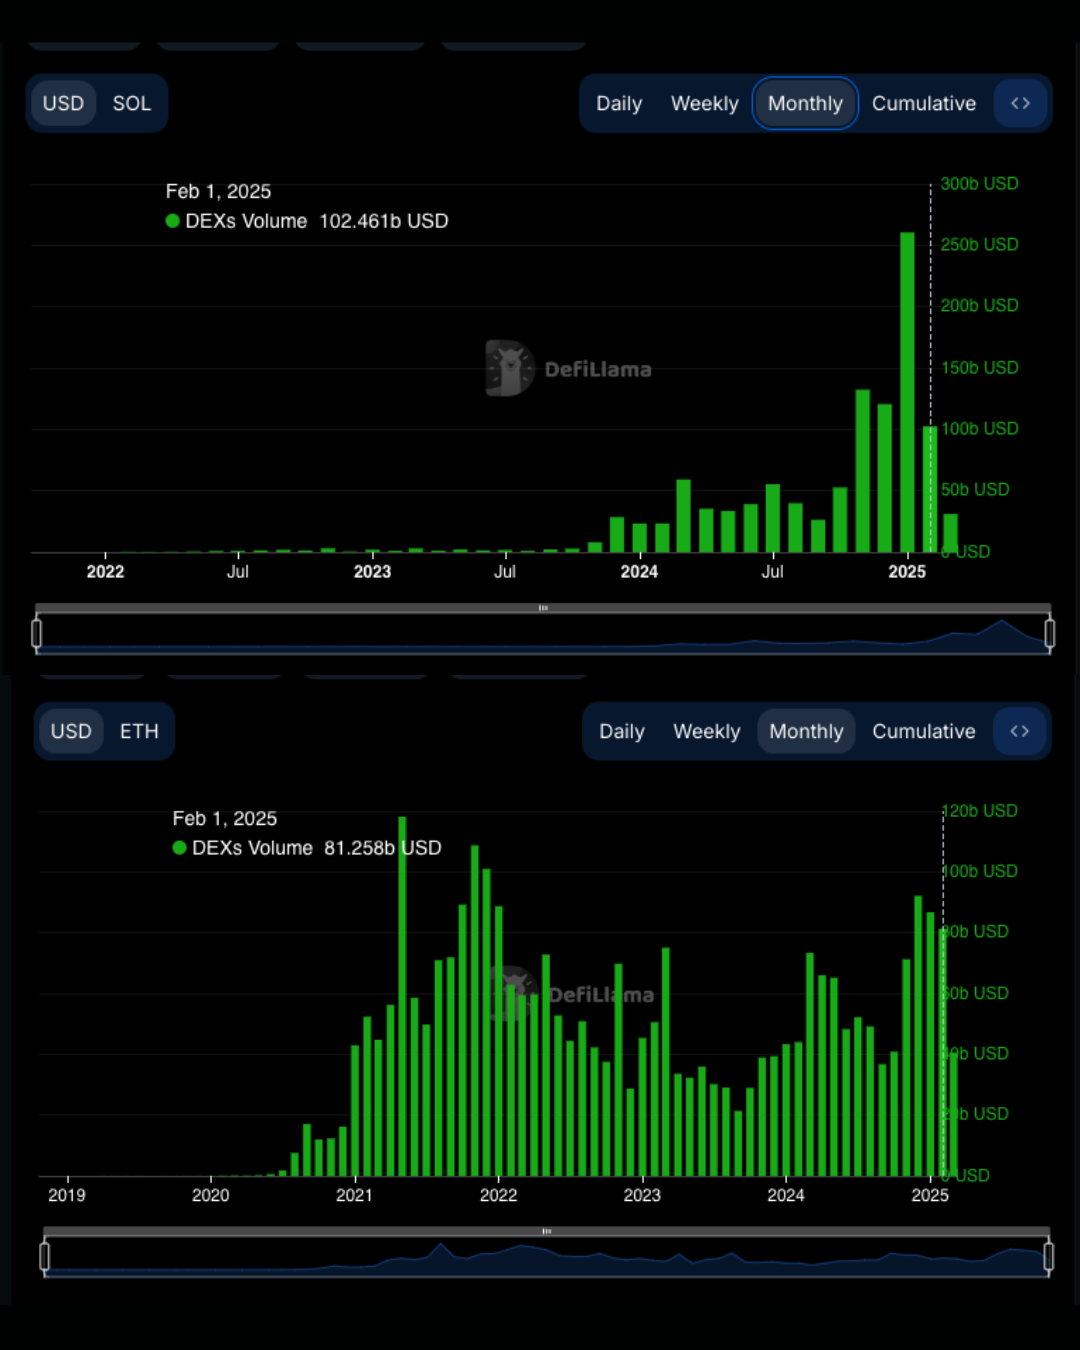
Meanwhile, the Ethereum ecosystem also shows signs of a slowdown compared to other networks. According to data from DeFi Llama, trading volumes on Ethereum-based decentralized exchanges have been surpassed by their Solana-based counterparts since November last year.
In February, trading volumes on Solana’s DEXs were 26% higher than those of Ethereum-based decentralized applications at $102 billion as the launch of popular meme coins like Official Trump (TRUMP) has increased the network’s activity.
Descending Price Channel Favors Bearish Outlook
Moving to the daily chart, we see a clear descending price channel in play as bears have taken full control of the price action.
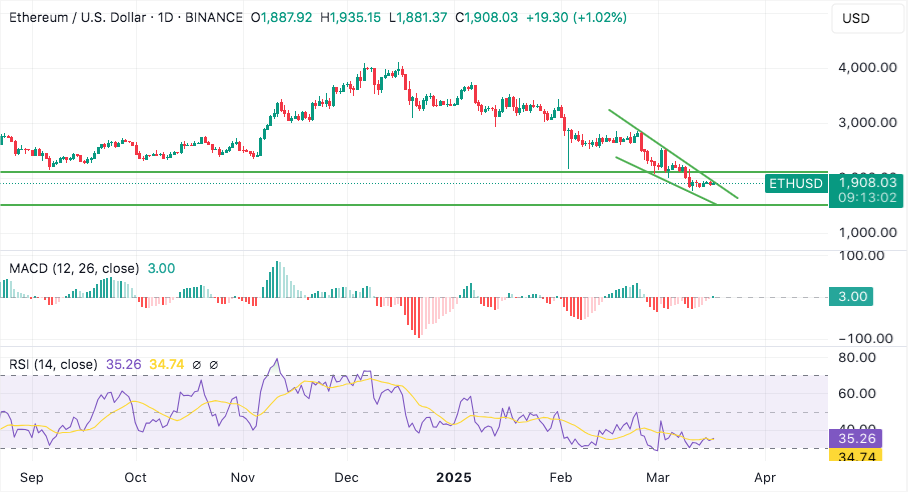
Market sentiment remains heavily depressed and the worst-performing tokens like ETH are more inclined to experience significant drops when the trend favors a bearish outlook in these conditions. Hence, short-sellers may experience higher gains by trading ETH.
Momentum readings have been improving in the past few days as ETH neared oversold levels. The Relative Strength Index (RSI) has not yet sent a buy signal but it is currently sitting on top of the signal line.
Meanwhile, the MACD’s histogram posted its first positive momentum reading today but the American session has just started so this could change at any point.
After breaking below the $2,100 level, ETH seems to have entered consolidation. Bulls would have to recapture this level to stand a chance to stop the asset from falling off a cliff.
It seems that bears have the upper hand at the moment as both the weekly and daily charts favor a negative outlook for ETH.
ETH Enters Consolidation – Next Leg Down in the Making?
The hourly chart shows that ETH has been in consolidation since last Tuesday, moving up and down within a well-defined range between $1,960 and $1,820 during that period. However, the price action has been making multiple higher lows since it hit that lower bound.
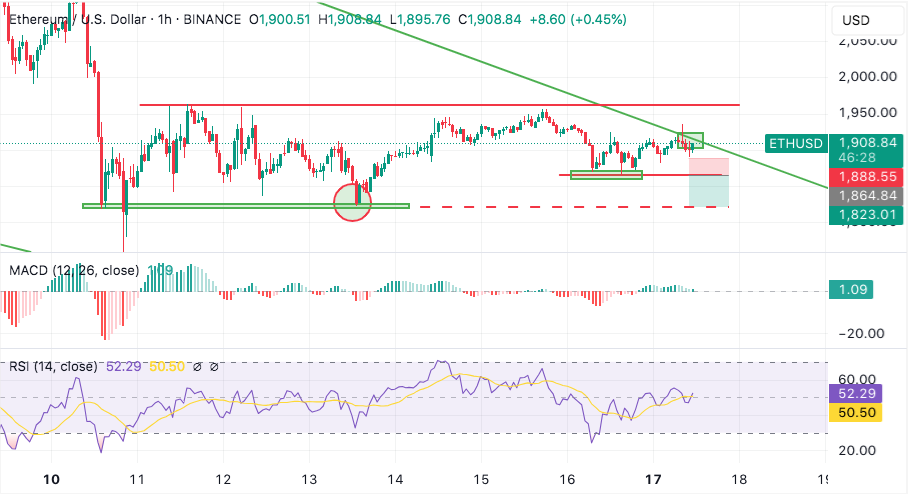
Both the Relative Strength Index (RSI) and the MACD show that positive momentum is picking up its pace as the American session begins. ETH would have to break above $1,925 to rise above the upper bound of its daily downtrend and then rise above the $1,960 level to stand a chance of retesting the $2,100 resistance.
As both the weekly and daily charts favor a bearish short-term outlook, scalpers stand a better chance to profit from short positions rather than going against the market’s trend.
A break below the $1,870 level would confirm a bearish outlook during the American session. This trade offers a 1.7 risk-reward ratio if the stop price is set right above this marker and the take-profit level at around $1,820 as ETH retests its Thursday 13 lows.
About the Author
Bob MasonChief Crypto Boss
TEST 30 He has written extensively for a broader audience and his current focus is on developments relating to the financial markets including, but not limited to currencies, commodities, alternative asset classes, and global equities.
Did you find this article useful?
Latest news and analysis


Advertisement