
Advertisement
Advertisement
Natural Gas Price Forecast: Faces Bearish Pressure After Failing Key Resistance
By:
Despite briefly trading above resistance, natural gas remains bearish. A break below $3.95 may lead to further downside, targeting $3.84 and confirming a trend reversal.
Natural gas further consolidated around recent lows on Monday and established a higher daily high and higher low on an upside breakout from Friday’s range. A three-day high of $4.22 was reached, which is a sign of strength. However, sellers subsequently took control and turned the price of natural gas back down. Trading continues near the lows of the day of $3.99, at the time of this writing. If the day ends with natural gas in a similar bearish position, the stage will be set for a bearish continuation of today’s decline on a drop below the day’s low.
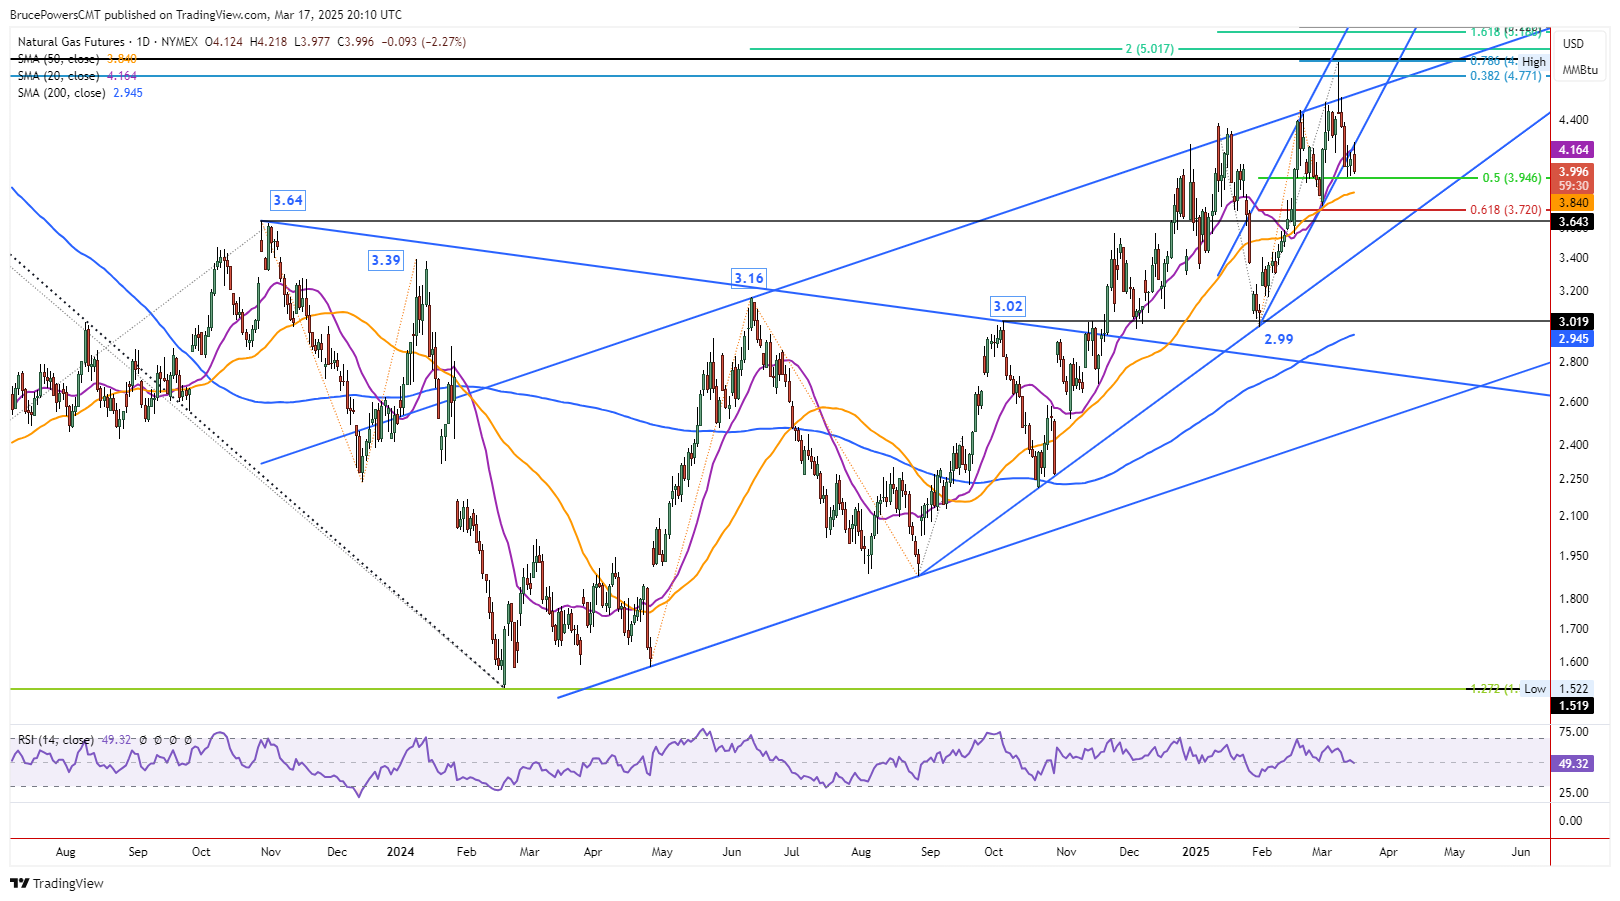
Prior Support Shows Resistance
Notice that the price zone around the 20-Day MA and internal uptrend line trend indicators were successfully tested today as resistance following a breakdown below those lines last week. This is typical behavior of price in a developing downtrend. Prior support is tested as resistance before a continuation of the bearish decline. There has been one downswing since the new trend high of $4.90 was reached last week. A swing low was established at last Thursday’s low of $3.96 and today’s high generated a possible lower swing high. If there is a decline below last Thursday’s low of $3.95, a second leg down will be indicated.
Targets 50-Day MA at $3.84
Since the 20-Day MA failed to hold as support, the 50-Day MA, currently at $3.84, becomes a potential target. Moreover, the uptrend that began from the recent $2.99 swing low shows a bearish reversal if the higher swing low of $3.74 from March 3 is exceeded to the downside. Similarly, since the internal uptrend line was broken and it marks support for a trend with a relatively steep angle, the next lower trendline becomes a potential target. Keep in mind that both the dynamic 50-Day line and next lower trendline are rising. Despite the potential for further downside in prices, the market for natural gas will provide clues based on how it behaves around particular price levels of support and resistance.
If the 20-Day MA and trendline continue to show an area of resistance, the current bearish pullback can be expected to continue, or a consolidation phase exhibiting downward pressure may form. Although there were signs of brief strength over the past few days as natural gas traded above the 20-Day line and trendline, on each of the prior three days the closing price for the day was below the lines.
For a look at all of today’s economic events, check out our economic calendar.
About the Author
Bruce Powerscontributor
Bruce has been involved in the financial markets for over 20 years, as an analyst, trader, educator, and writer.
Did you find this article useful?
Latest news and analysis


Advertisement