
Advertisement
Advertisement
Solana (SOL) Eyes Reversal After Hitting Key Support as Coinbase Launches SOL Futures
By:
Key Points:
- Price at three-month low of $160
- Bearish sentiment may indicate reversal
- Coinbase Launched CFTC-Regulated SOL Futures

Solana (SOL) has been under pressure in recent weeks, but a potential reversal may be on the horizon as the asset finds support near $160. This development comes as Coinbase launches CFTC-regulated SOL futures, expanding institutional access to Solana’s derivatives market.
The introduction of these futures could increase liquidity and price stability, influencing SOL’s next major move. From a technical standpoint, SOL is testing key Fibonacci levels and showing early signs of a bullish wave structure, suggesting a possible recovery if momentum sustains.
Coinbase Gets CFTC-Regulated SOL Contracts
Coinbase has announced the launch of Solana (SOL) futures contracts, marking a significant step in expanding its derivatives market within the U.S. The newly introduced contracts are regulated by the Commodity Futures Trading Commission (CFTC), reinforcing compliance and legitimacy in the sector.
This move comes amid growing demand for regulated crypto futures, allowing traders to access SOL futures with greater security and transparency. The addition of SOL futures follows Coinbase’s recent push to broaden its futures offerings beyond Bitcoin and Ethereum, catering to altcoin investors looking for hedging and leverage opportunities.
As the regulatory environment evolves, Coinbase’s initiative could drive further institutional adoption and market liquidity for Solana, strengthening its position as one of the leading blockchain ecosystems.
SOL Price Analysis
As of February 20, 2025, Solana (SOL) is trading at approximately $174, reflecting a modest increase of 0.29% over the past 24 hours. However, over the past week, SOL has experienced a decline of about 9.56%, and it remains 40.98% below its all-time high of $294.85, achieved on January 19, 2025. The recent price action has brought SOL to a critical support level around $160, a threshold not observed since November 2024.
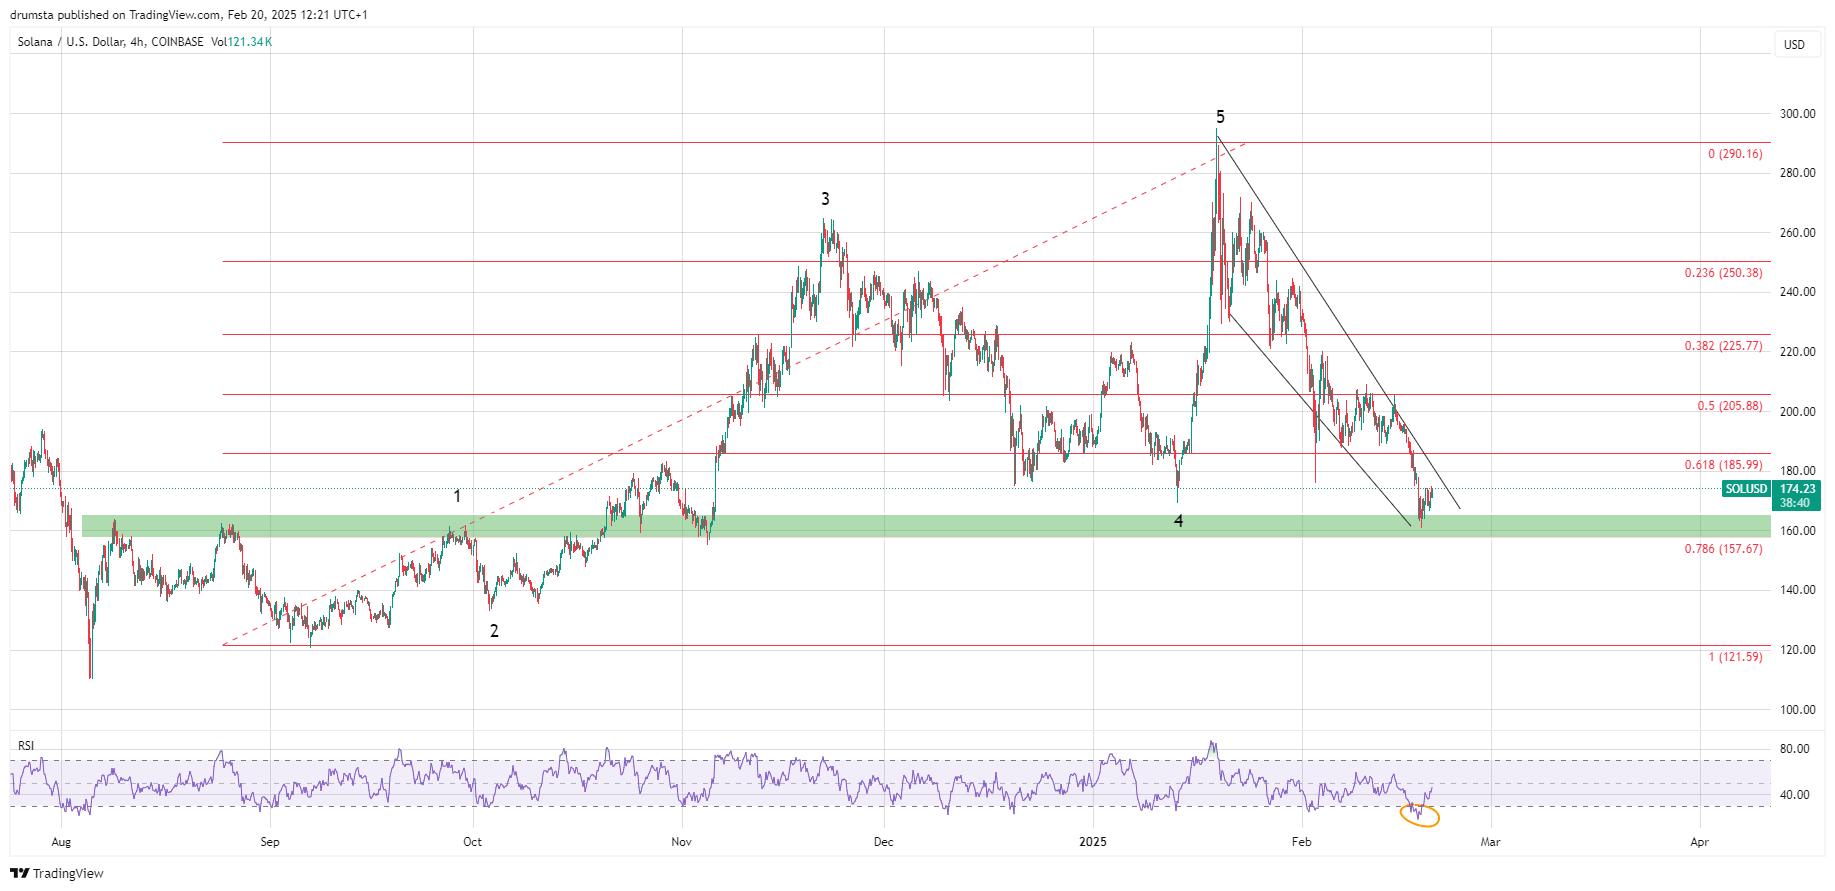
The daily Relative Strength Index (RSI) currently hovers near the 30 mark, indicating oversold conditions. Historically, such RSI levels have preceded bullish reversals, suggesting potential for a price rebound. This development could signify a shift in momentum from bearish to bullish in the near term.
From an Elliott Wave perspective, SOL appears to be completing a corrective Wave C within a larger ABC correction pattern. Wave A initiated the decline from the all-time high, followed by a brief Wave B retracement, and the current Wave C has brought prices back to the $160 support level. The completion of Wave C at this support could mark the end of the correction, paving the way for a new impulsive wave upward.
SOL Price Prediction
Analyzing the 4-hour chart, Solana’s price action suggests the early stages of a potential impulsive wave formation following the recent low at $168.94. The preliminary wave count indicates a developing five-wave structure, with Wave (i) initiating the upward movement and Wave (ii) currently in progress as a corrective phase. Assuming Wave (ii) holds above the $168.94 support level, SOL is poised to resume its upward trajectory, with Wave (iii) targeting the $180 zone.
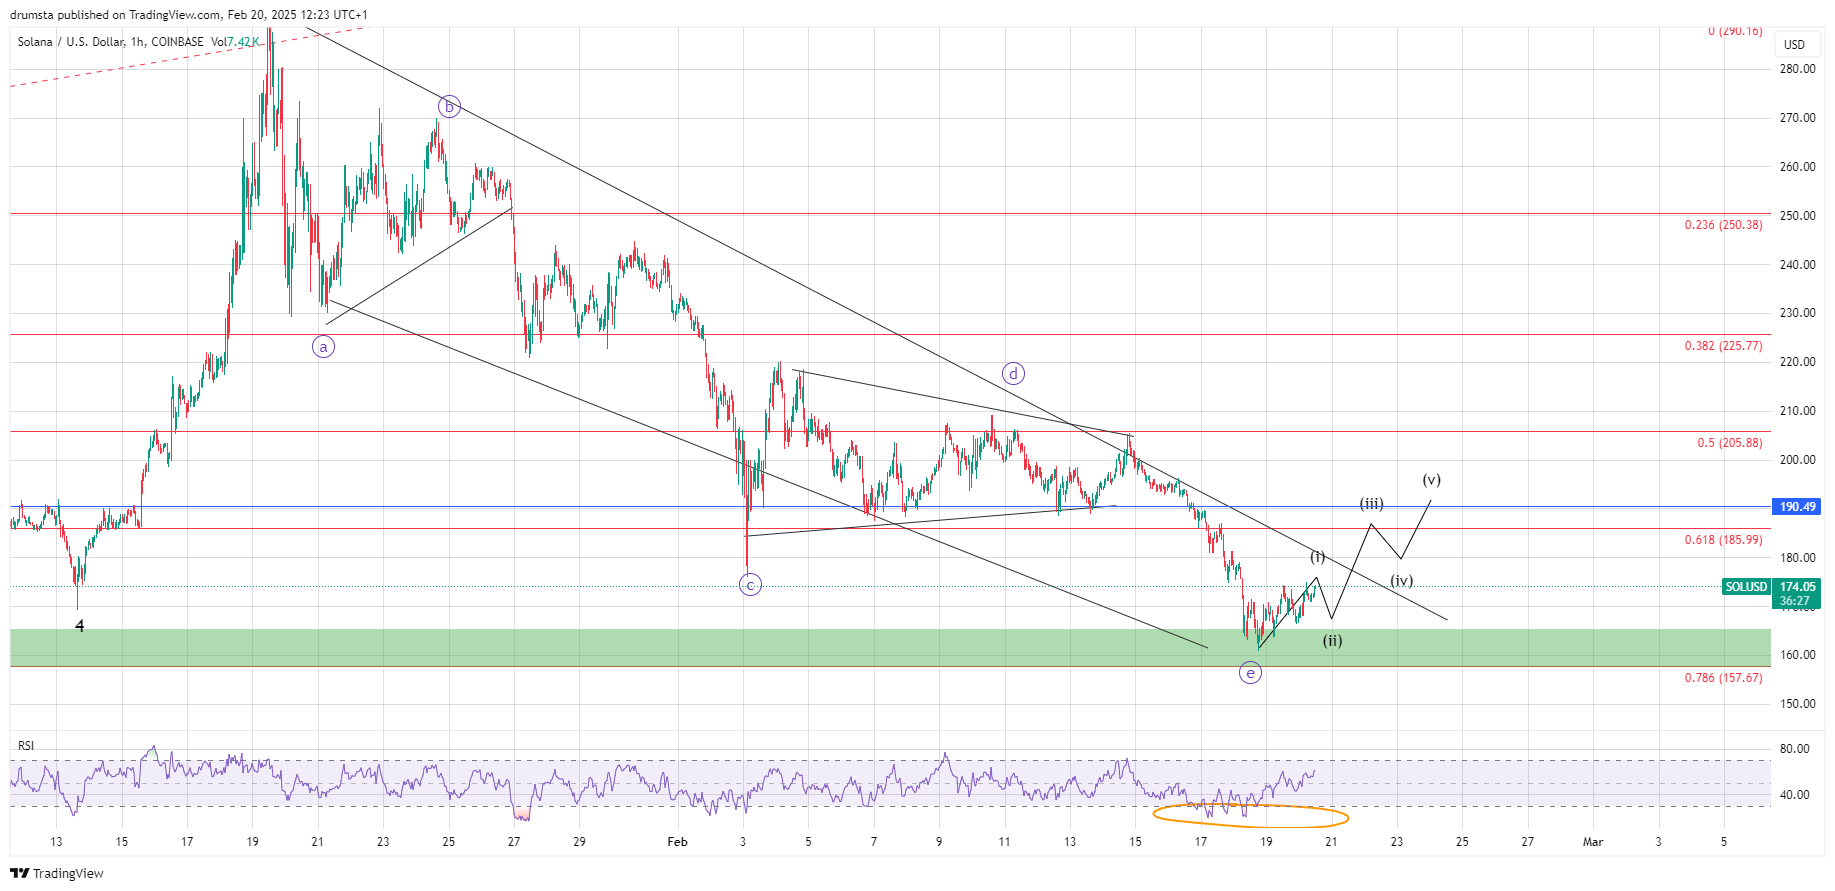
Fibonacci retracement levels provide additional insights into potential price targets. The 0.618 Fibonacci retracement of the recent decline aligns closely with the $180 target, reinforcing its significance as a resistance level. A successful breach of this level could propel SOL toward the 0.786 Fibonacci retracement at approximately $195.81, corresponding with the projected Wave (v) completion.
It’s crucial to monitor the RSI on the 4-hour timeframe, as overbought conditions could emerge if the price accelerates too rapidly, potentially leading to a short-term pullback within Wave (iv) before the final Wave (v) ascends. Conversely, a failure to maintain support above $168.94 would invalidate the bullish wave count, suggesting a deeper correction toward the $160 region or lower.
Key Levels to Watch
- Immediate Resistance: $173.42 (minor horizontal resistance)
- Key Resistance: $195.81 (0.786 Fibonacci retracement)
- Major Resistance: $216.90 (0.618 Fibonacci retracement)
- Immediate Support: $168.94 (recent low and 1.0 Fibonacci extension)
- Critical Support: $160.00 (potential retest zone)
- Short-Term Target for Wave (v): Above $216 if momentum sustains
- Invalidation Zone: Below $168.94, signaling further downside potential
About the Author
Bob MasonChief Crypto Boss
TEST 30 He has written extensively for a broader audience and his current focus is on developments relating to the financial markets including, but not limited to currencies, commodities, alternative asset classes, and global equities.
Latest news and analysis


Advertisement