
Advertisement
Advertisement
TRUMP, AAVE, WCT Price Analysis: Will These Altcoins Rise Further?
By:
Key Points:
- AAVE gains over 8% in 24 hours but approaches major resistance between $260–$292.
- TRUMP forms a descending triangle, risking a breakdown toward $9.08 if support fails.
- WCT hits record high at $0.67 but shows bearish divergence, hinting at a possible pullback.

Aave (AAVE), Official Trump (TRUMP), and WalletConnect (WCT) are among the best-performing crypto assets today.
AAVE has gained over 8% in the past 24 hours, rebounding from long-term trend support to test a major resistance zone near $270. TRUMP held steady around $13.37 after rising 3.50%, and WCT rose 16.50% to reach its record high at around $0.67.
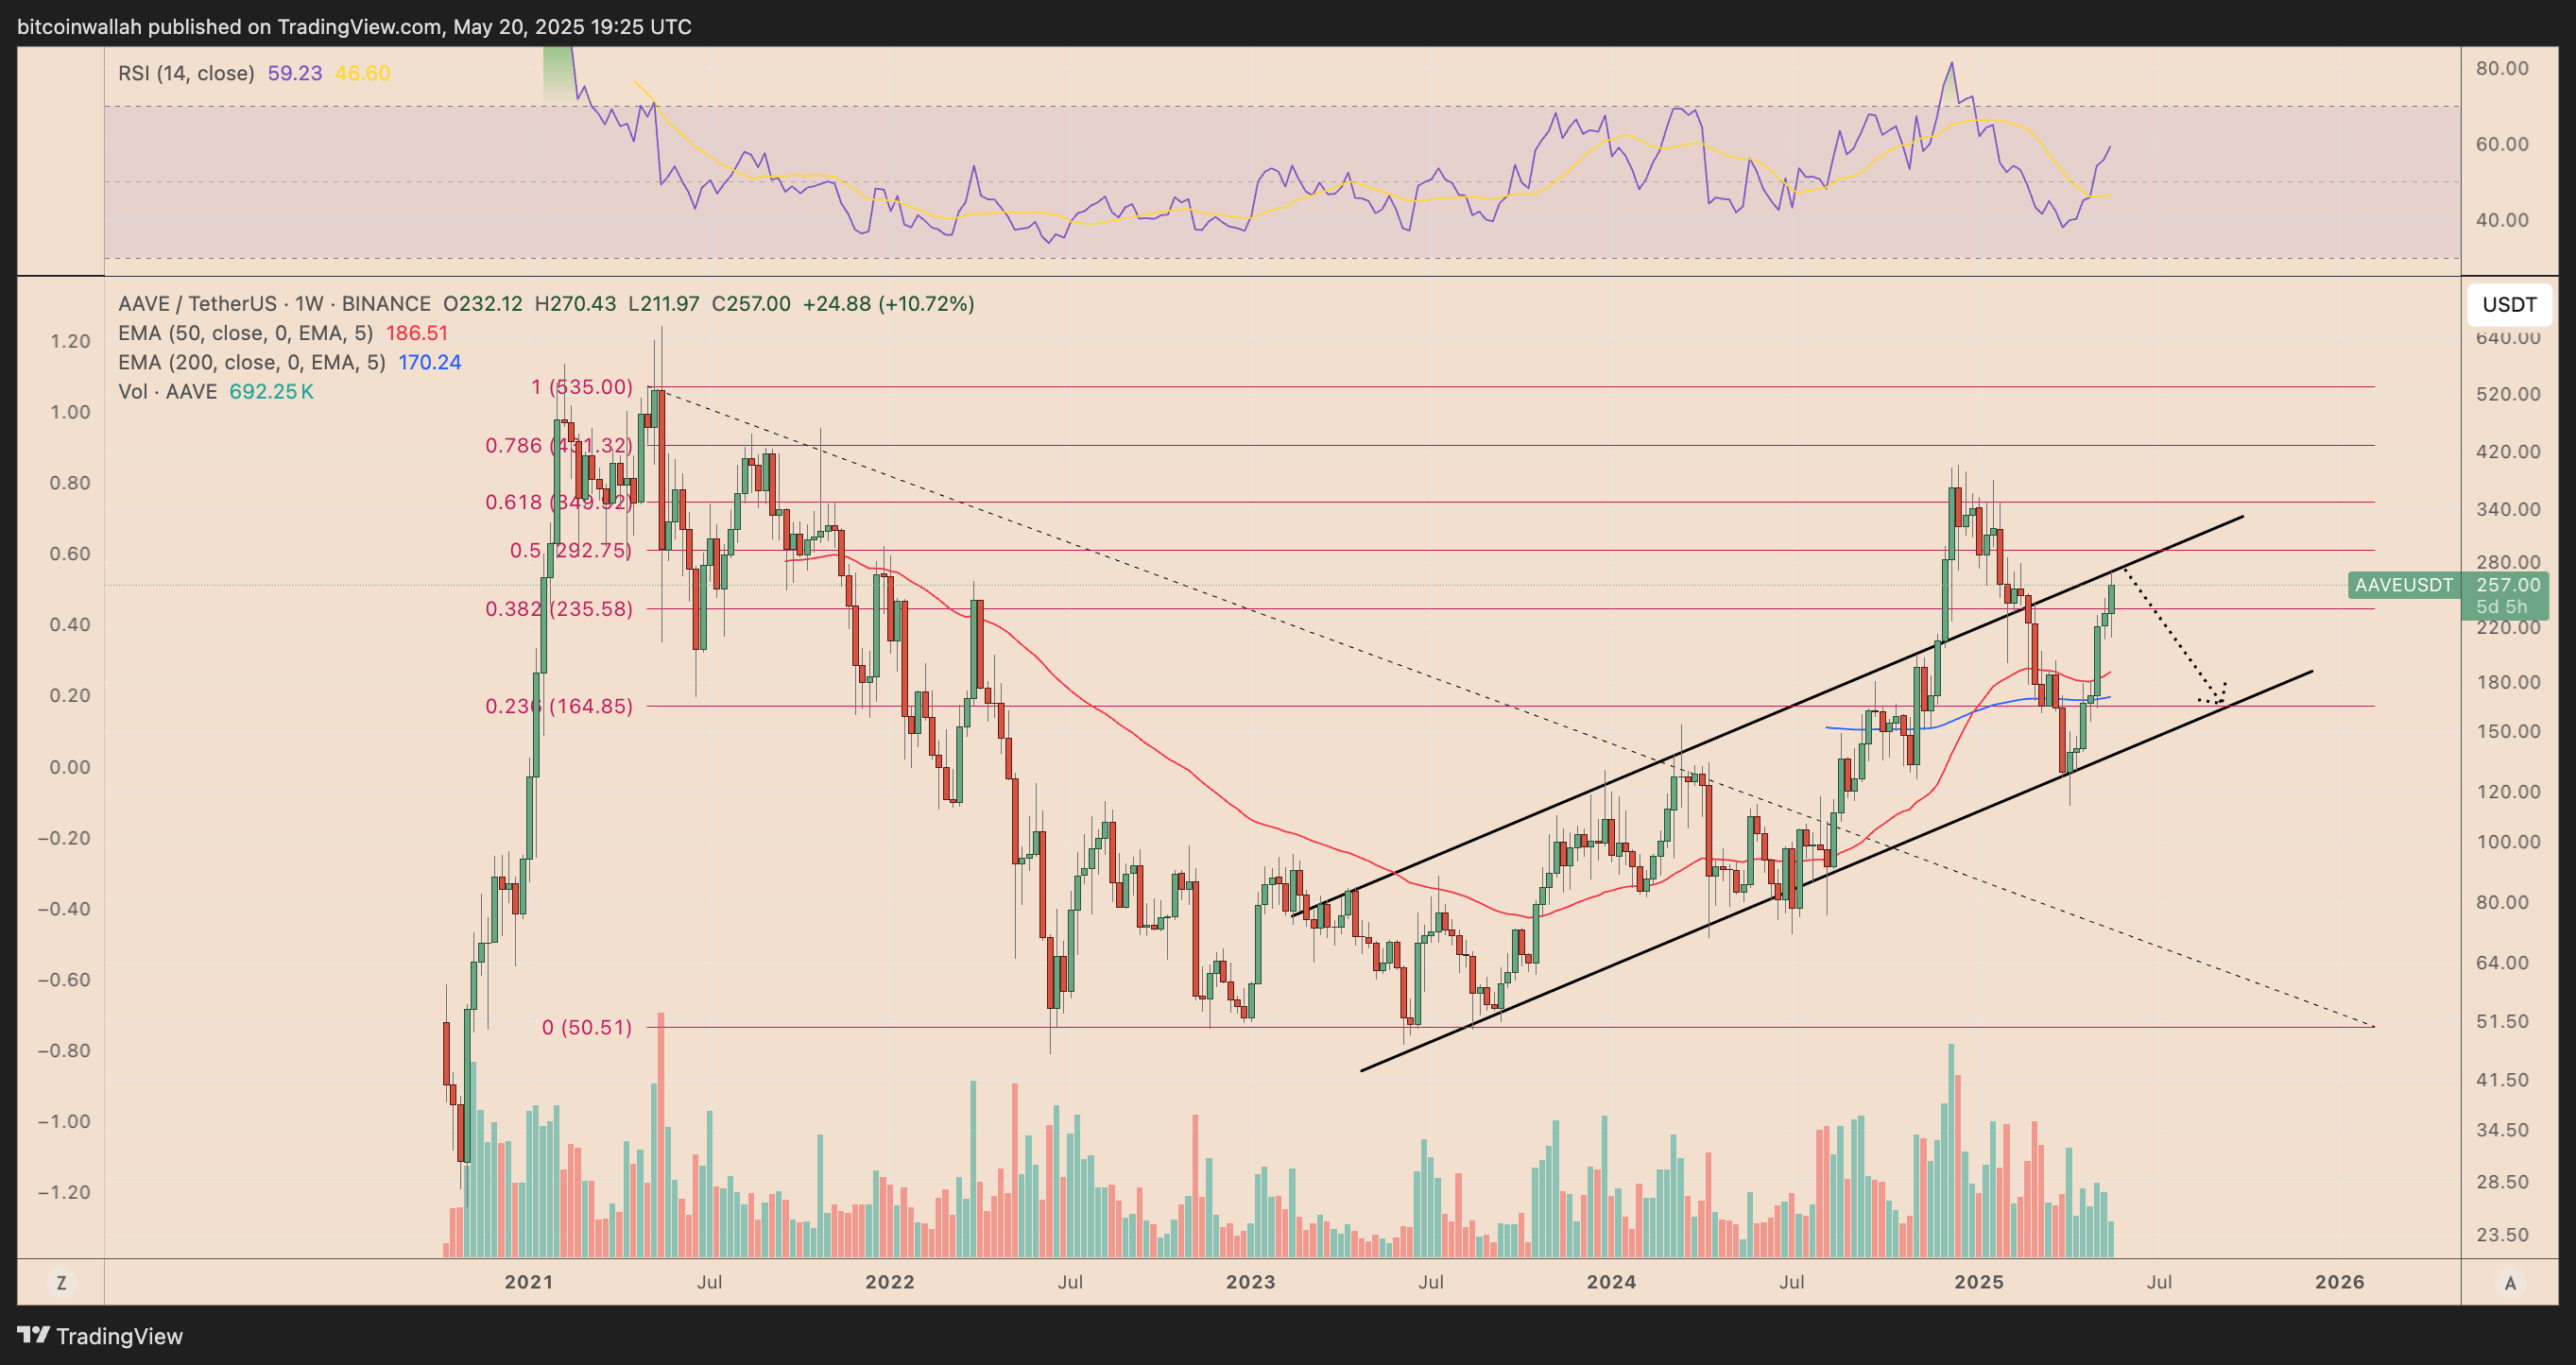
However, AAVE now tests a key resistance zone between $260–$292, near the 0.5–0.618 Fibonacci levels from its $635 peak. This area, aligned with channel resistance, could prompt profit-taking.
The RSI sits at 59.23, suggesting room for upside but also caution for a potential pullback. If rejected, AAVE could retest support near $180, around the 200-week EMA.
TRUMP Forms Bearish Descending Triangle With Breakdown Risk
The TRUMP/USDT trading pair is flashing a classic bearish continuation setup as it coils within a descending triangle pattern on the daily timeframe. The pattern features a series of lower highs against a horizontal support near the $12.35 level, where price has repeatedly bounced in recent weeks.
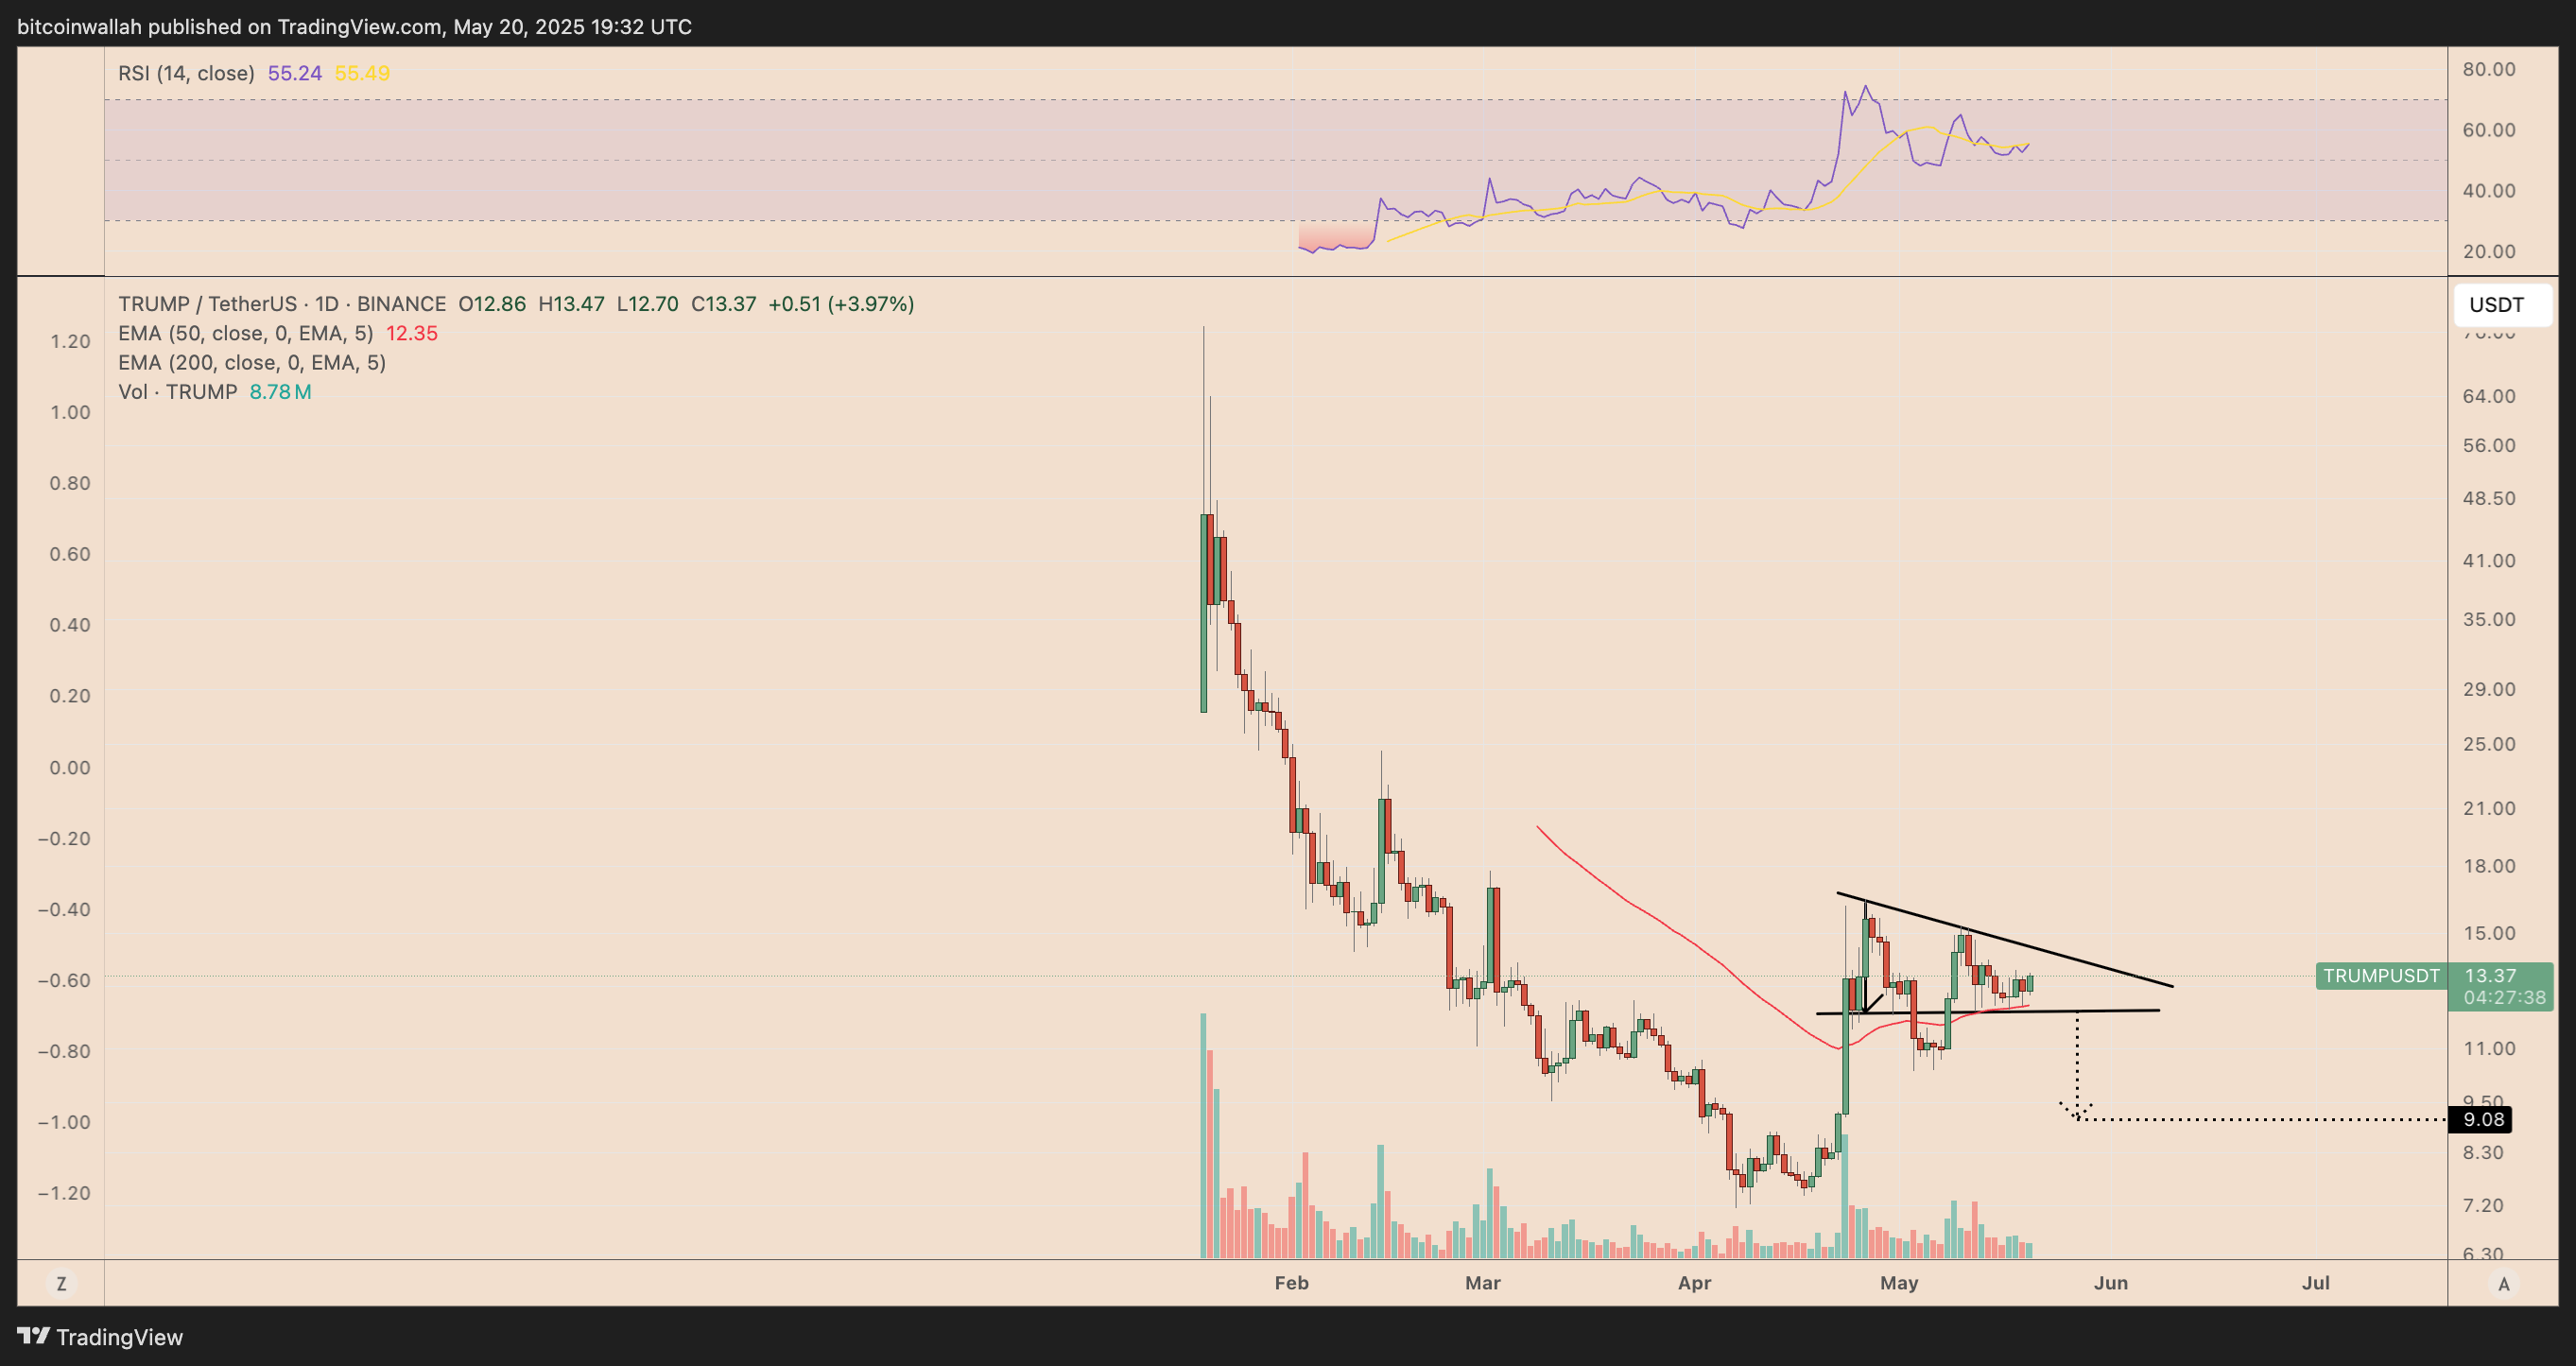
As of May 20, TRUMP is trading around $13.37, slightly above its 50-day EMA ($12.35) but well below the 200-day EMA, which continues to act as overhead resistance. The lack of upward momentum, combined with weakening volume, raises the risk of a bearish breakdown from the triangle formation.
A confirmed close below the $12.35 support could trigger a drop toward the pattern’s projected downside target near $9.08, calculated by subtracting the triangle’s height from the breakdown point. This would mark a roughly 30% decline from current levels.
The RSI sits near 55, suggesting there’s room for both upside and downside, but the overall chart structure leans bearish unless bulls can reclaim the descending trendline above $14.50 and invalidate the pattern.
WCT Rally Shows Bearish Divergence, Eyes 50-EMA Retest
WCT (WCT/USDT) has surged over 4% in the latest 4-hour session to trade near $0.66, but momentum may be fading as a classic bearish divergence forms between price and the relative strength index (RSI). While the token printed a higher high, the RSI posted a lower high, a potential warning sign of weakening buying pressure.
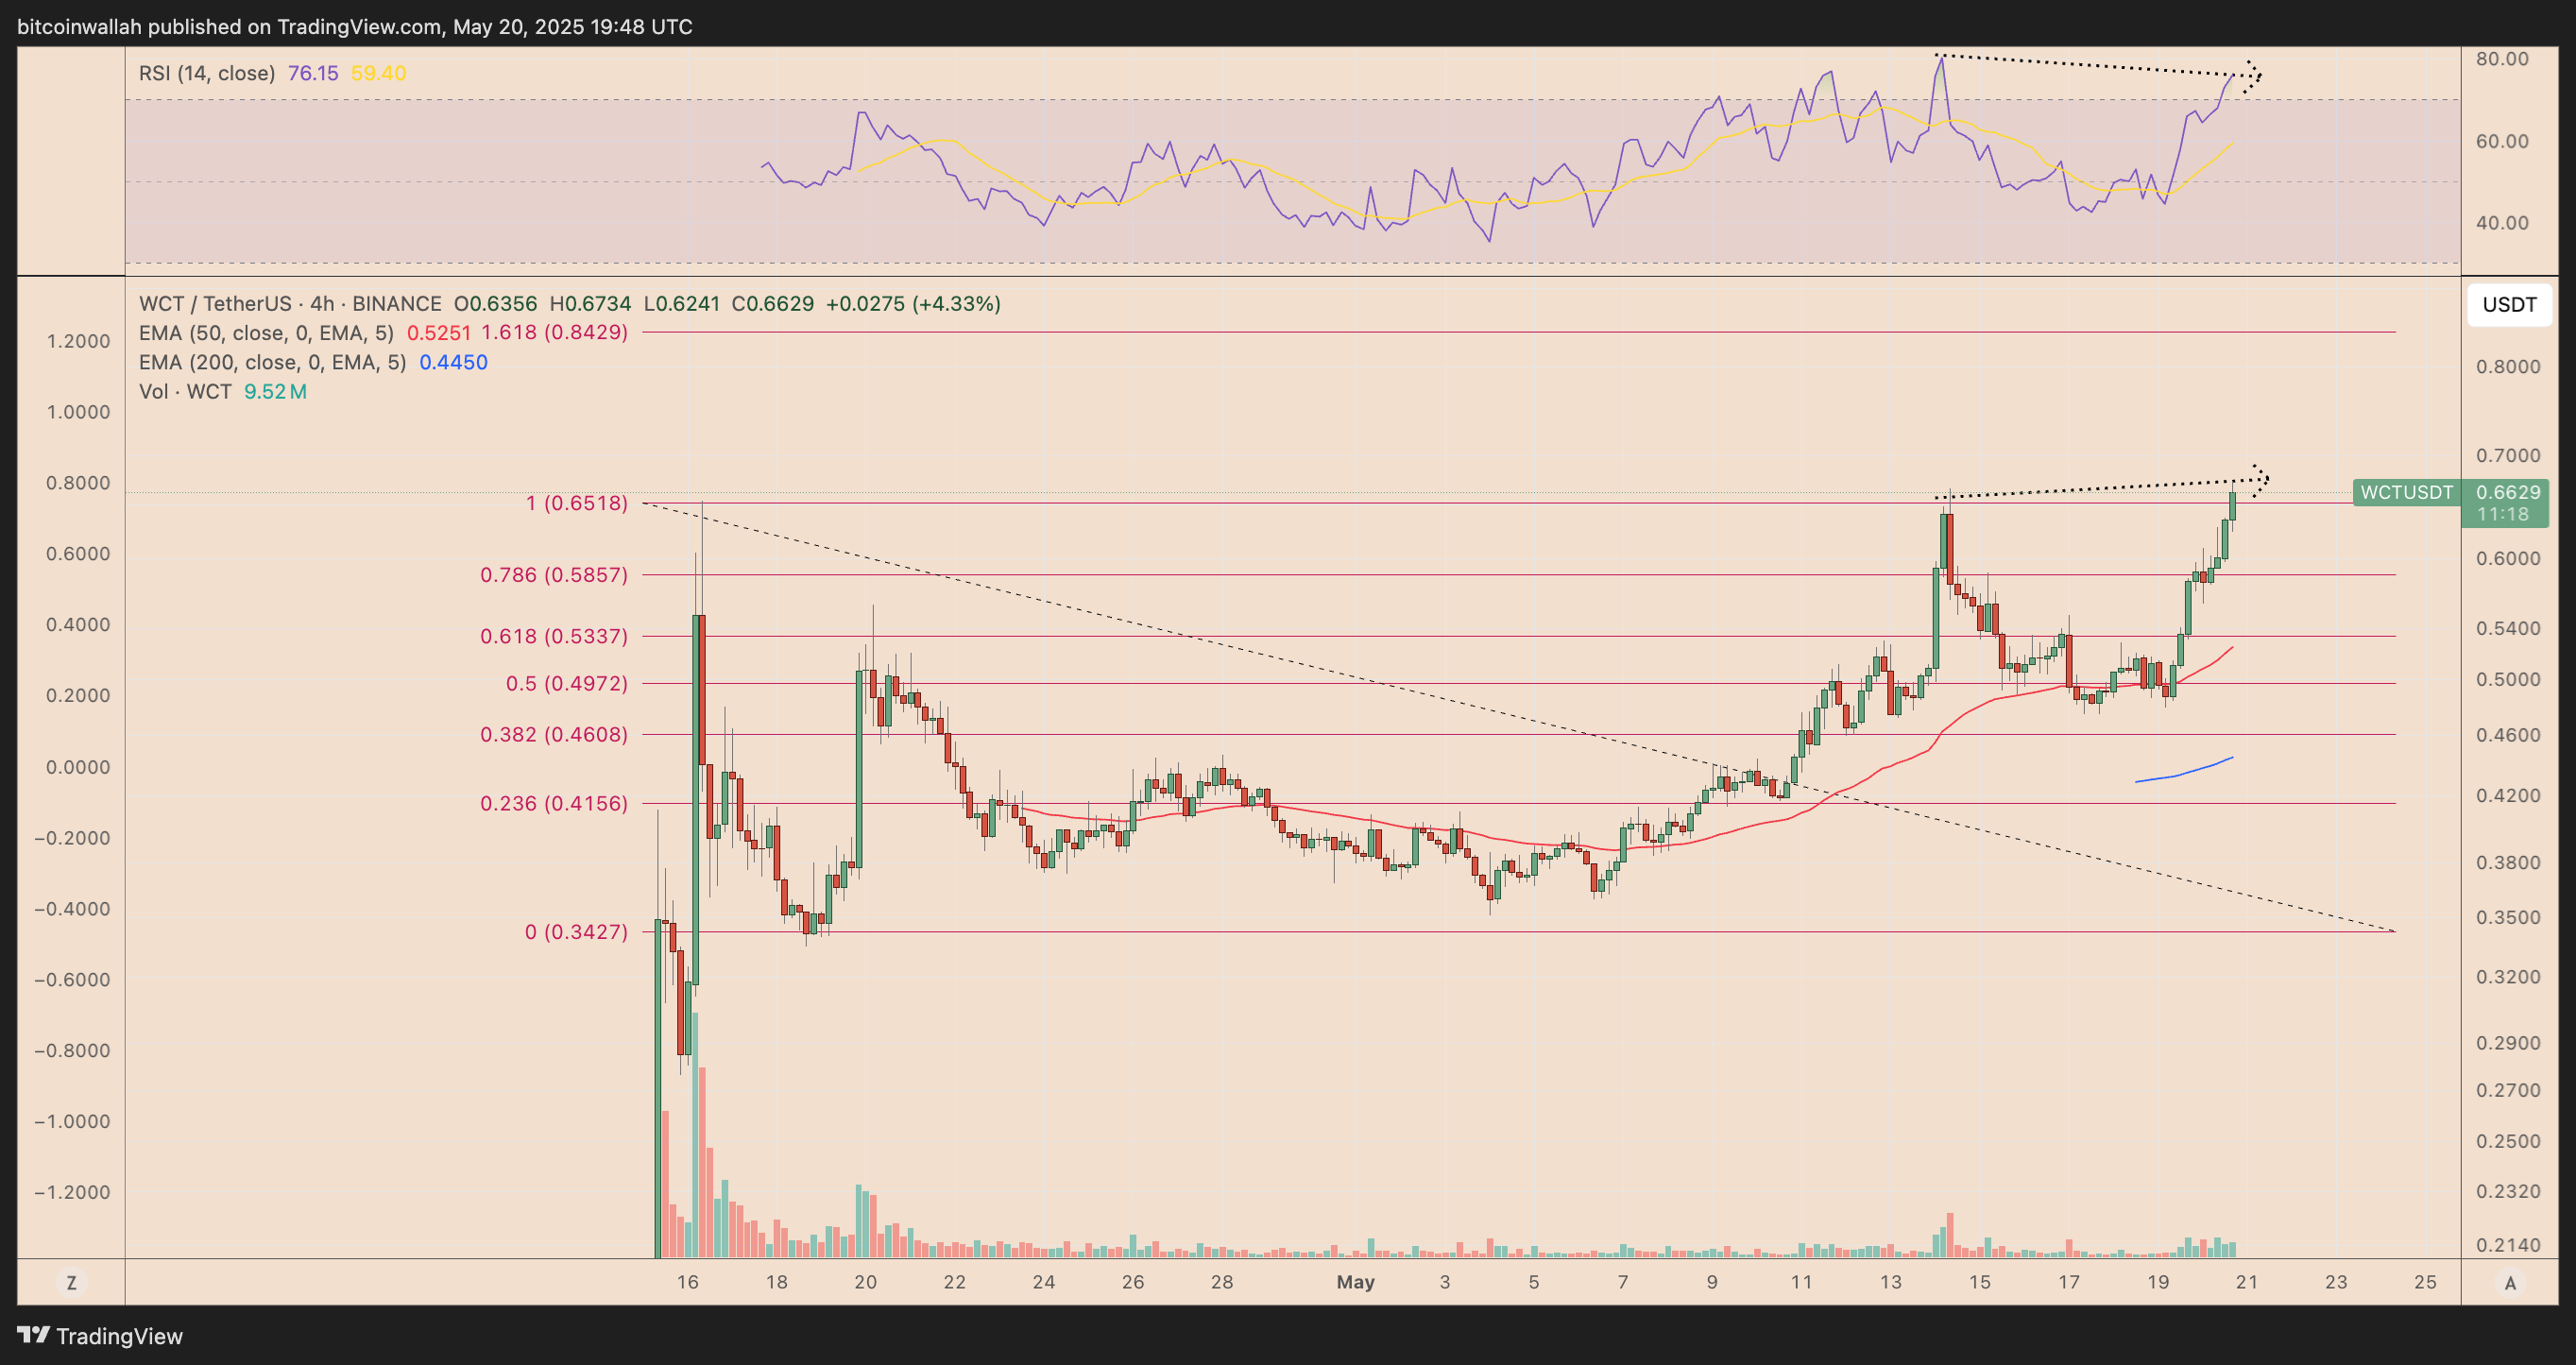
This divergence, especially while the RSI remains firmly in overbought territory (currently at 76.15), increases the likelihood of a short-term correction. Price may soon retest the 50-period exponential moving average (EMA) near $0.5251, a level that has acted as dynamic support during the ongoing uptrend.
The recent price surge also closely aligns with a retest of the previous swing high at $0.6518, suggesting potential for a double top. Volume has not surged meaningfully with the price breakout, further validating the risk of an exhaustion move.
About the Author
Bob MasonChief Crypto Boss
123456789 30 He has written extensively for a broader audience and his current focus is on developments relating to the financial markets including, but not limited to currencies, commodities, alternative asset classes, and global equities.


Advertisement