
Advertisement
Advertisement
U.S. Dollar Rebounds From Session Lows As ISM Services PMI Beats Estimates: Analysis For EUR/USD, GBP/USD, USD/CAD, USD/JPY
By:
Key Points:
- EUR/USD pulled back from session highs as traders focused on U.S. economic data.
- USD/CAD remained stuck near the 1.3800 level.
- USD/JPY made an attempt to settle below the 143.50 level.

U.S. Dollar Index Is Heading Towards The 100.00 Level
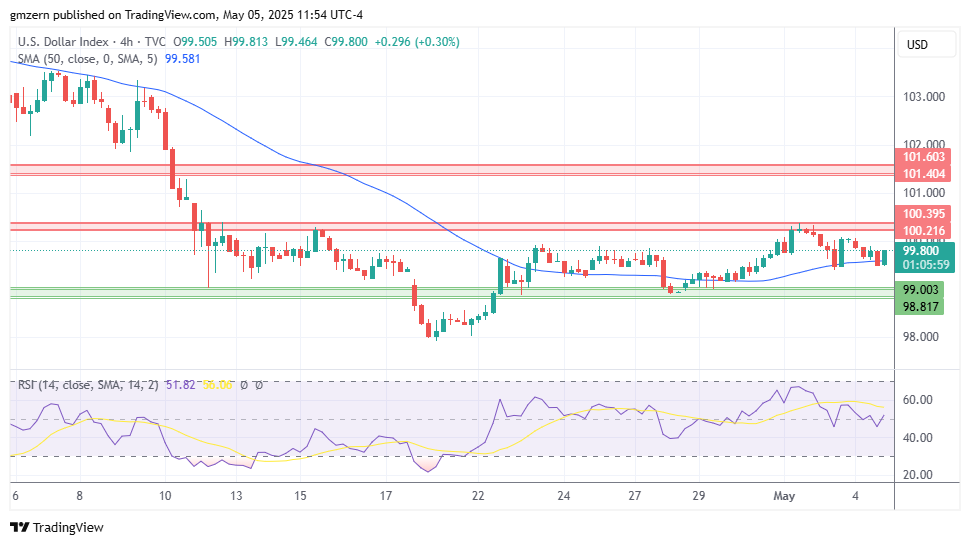
U.S. Dollar Index rebounded from session lows as traders reacted to the better-than-expected ISM Services PMI report. The report indicated that ISM Services PMI increased from 50.8 in March to 51.6 in April, compared to analyst forecast of 50.6.
The nearest resistance level for U.S. Dollar Index is located in the 100.20 – 100.40 range. In case U.S. Dollar Index manages to settle above the 100.40 level, it will move towards the next resistance at 101.40 – 101.60.
EUR/USD Moved Away From Session Highs
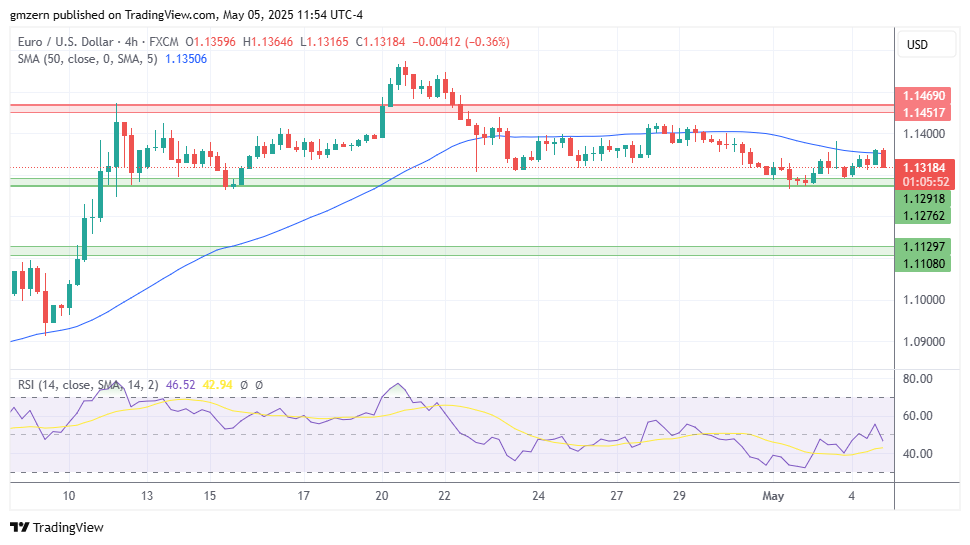
EUR/USD pulled back from session highs as traders focused on U.S. economic reports. S&P Global Services PMI declined from 54.4 in March to 50.8 in April, compared to analyst consensus of 51.4.
A successful test of the support at 1.1275 – 1.1290 will open the way to the test of the next support level at 1.1110 – 1.1130.
GBP/USD Is Mostly Flat As Traders Wait For Catalysts
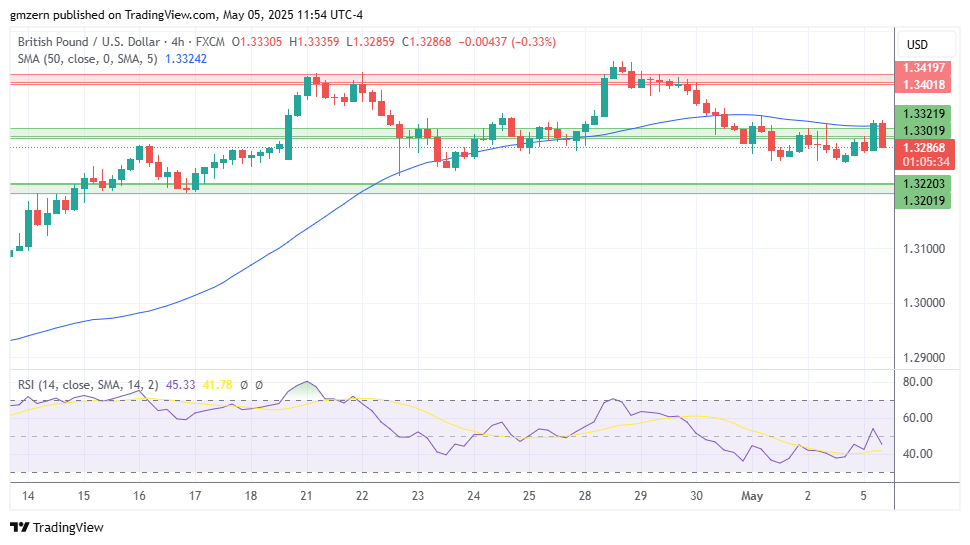
GBP/USD is swinging between gains and losses amid lack of strong catalysts. From a big picture point of view, traders have already started to prepare for Fed decision, which will be released on Wednesday.
If GBP/USD declines below the 1.3250 level, it will get to the test of the nearest support at 1.3200 – 1.3220.
USD/CAD Is Stuck Near 1.3800
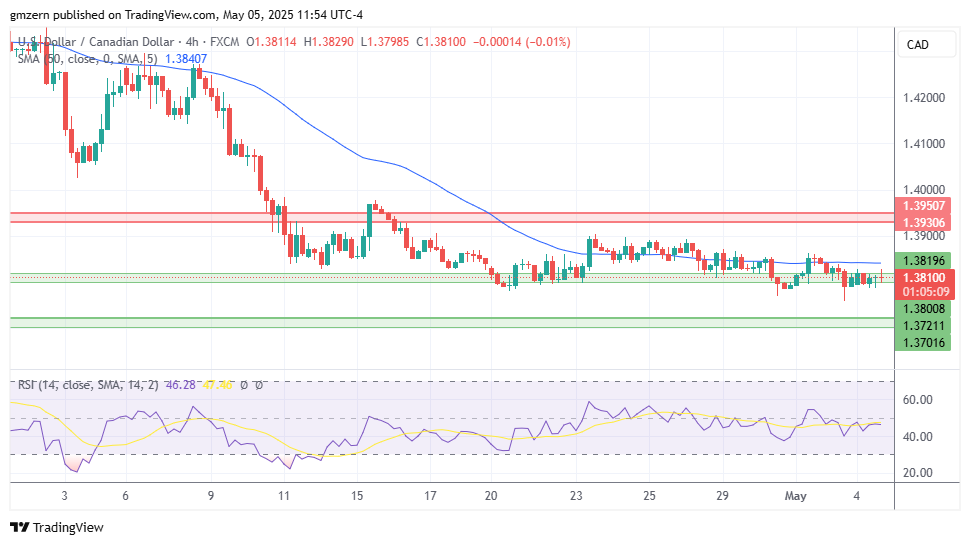
USD/CAD is stuck near the support level at 1.3800 – 1.3820 despite the strong pullback in the oil markets.
In case USD/CAD climbs above the 50 MA at 1.3840, it will head towards the resistance level at 1.3930 – 1.3950.
USD/JPY Is Losing Ground Despite Rising Treasury Yields
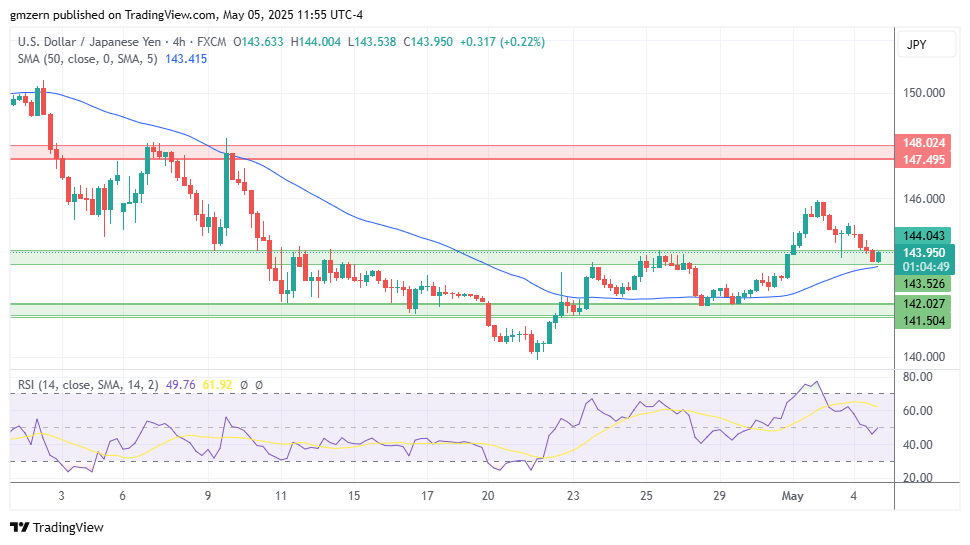
USD/JPY tests support at 143.50 – 144.00 despite rising Treasury yields. The yield of 2-year Treasuries climbed towards the 3.85% level, while the yield of 10-year Treasuries tested the 4.35% level.
If USD/JPY settles below 143.50, it will head towards the next support at 141.50 – 142.00.
For a look at all of today’s economic events, check out our economic calendar.
About the Author
Vladimir Zernovauthor
In more than 15 years of trading in the financial markets, Vladimir dealt with a wide range of brokers and financial instruments. His career as a day-trader at a proprietary trading firm goes back to 2007. Later, Vladimir turned to longer time frames and became an independent trader and analyst managing his own portfolio. Using his experience, he helps traders find the best broker in his reviews.


Advertisement