
Advertisement
Advertisement
US Dollar Price Forecast: Sinks on Powell Exit Rumors, DXY Below Key Support – GBP/USD and EUR/USD
By:
Key Points:
- US Dollar Index sinks to $97.60 amid Fed leadership uncertainty and growing speculation over Powell’s replacement.
- Traders price in a 25% chance of a July Fed rate cut, doubling from last week, increasing pressure on the dollar.
- DXY breaks below $97.675 support; technicals suggest momentum favors further losses toward $96.94 and $96.64.

Market Overview
The US Dollar Index (DXY) extended its decline in early European trade Thursday, sliding to a fresh three-and-a-half-year low near $97.60. The pressure follows renewed speculation around Federal Reserve leadership and rising doubts about the central bank’s policy independence.
Trump’s Fed Remarks Raise Market Tensions
According to a report in The Wall Street Journal, former President Donald Trump is considering replacing Fed Chair Jerome Powell as early as September. Shortlisted names include Kevin Warsh, Kevin Hassett, and Scott Bessent. The news has raised concerns about the Fed’s autonomy in the market.
Kieran Williams of InTouch Capital Markets noted that “even the perception of political interference could erode long-term trust in the Fed and shift global dollar positioning.”
Cautious Fed Tone and Dovish Bets Add Pressure
Fed Chair Jerome Powell maintained a cautious stance on Wednesday, citing the uncertain inflationary impact of proposed tariffs. While calling for vigilance, Powell stopped short of signaling immediate easing.
Still, traders are betting on cuts. The CME FedWatch Tool now shows a 25% probability of a July rate cut, up from 12% last week, intensifying downward pressure on the dollar.
Upcoming US Data in Focus
Traders await key releases, including Q1 GDP, Durable Goods Orders, Chicago PMI, and Jobless Claims. Strong prints could stabilize the dollar, but soft data may accelerate its slide.
US Dollar Index (DXY) – Technical Analysis
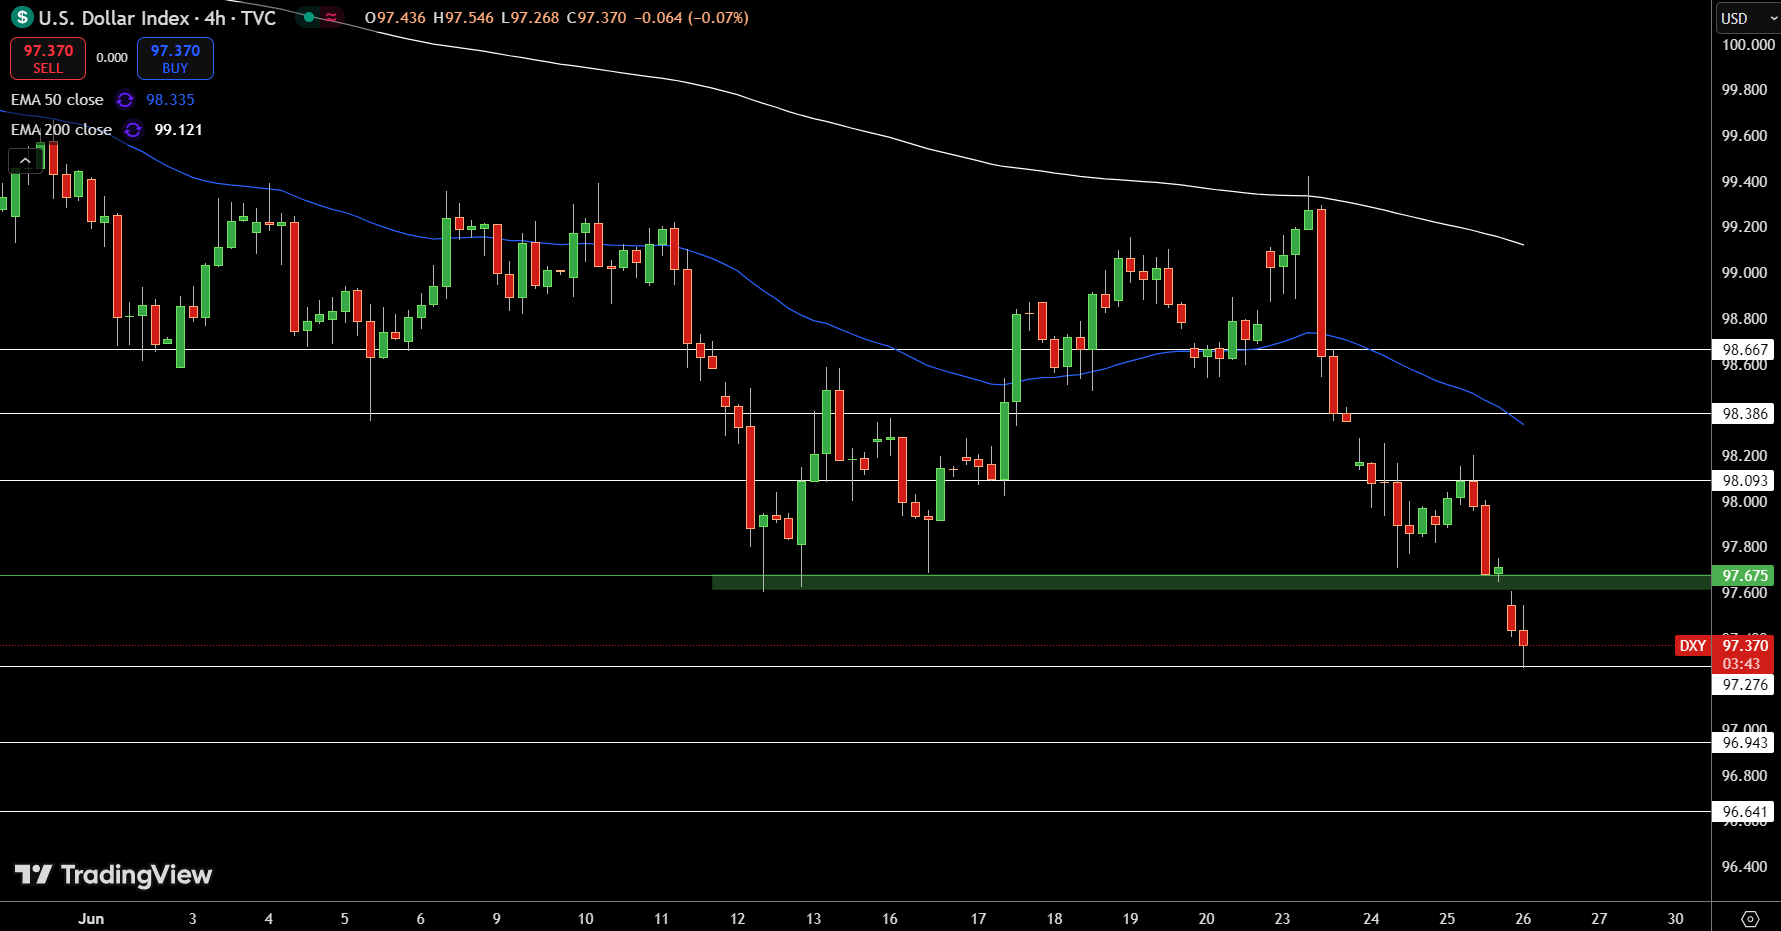
The U.S. Dollar Index (DXY) has broken decisively below the $97.675 support level on the 4-hour chart, reinforcing its bearish momentum. Price action is firmly trading under both the 50-EMA ($98.33) and 200-EMA ($99.12), with both moving averages pointing lower—signaling sustained downside pressure. The breach of this horizontal support, previously a multi-week floor, suggests that sentiment has turned decisively against the dollar.
This breakdown opens the door toward the next key levels at $96.94 and $96.64. A failed retest of $97.675 from below would likely confirm it as new resistance. With no immediate bullish reversal patterns forming, and macro expectations tilted toward Fed easing, the technical bias remains bearish.
GBP/USD Technical Analysis
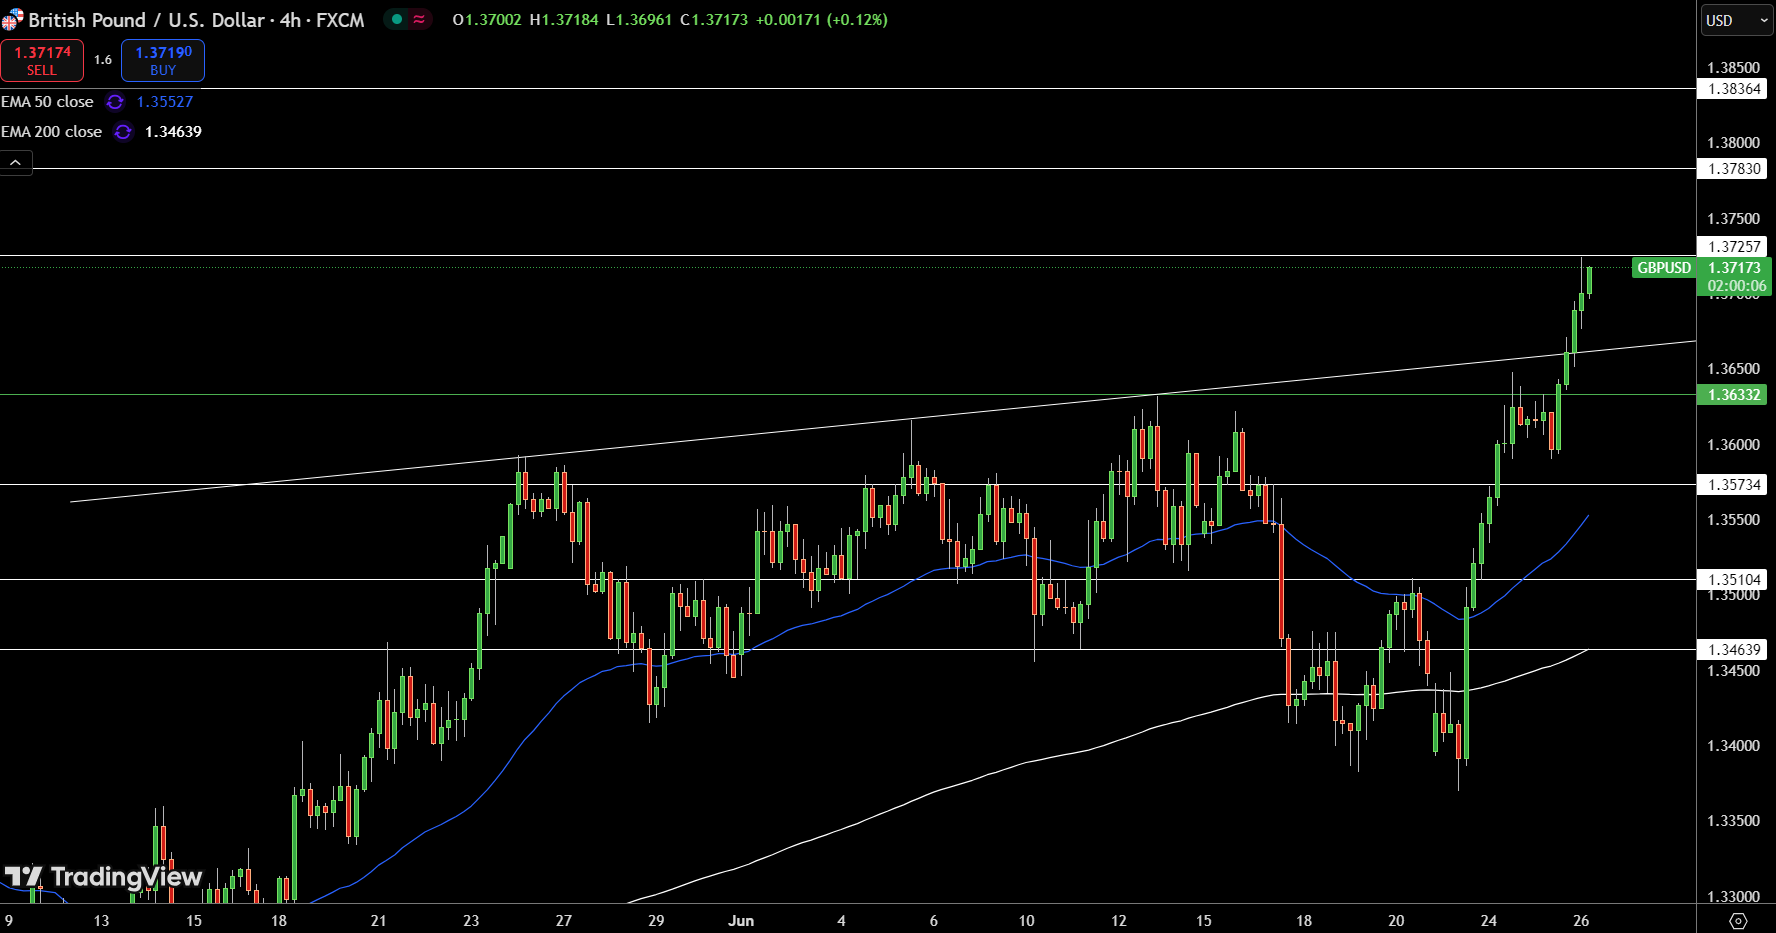
GBP/USD is trading near a fresh multi-week high around $1.37173, having broken through key resistance at $1.36332 with strong bullish momentum. The pair is now approaching the next resistance zone at $1.37257, a level last tested in early May.
Both the 50-EMA ($1.35527) and 200-EMA ($1.34639) remain well below the current price, reinforcing the bullish trend structure. If the pair holds above $1.37257, the path opens toward $1.37830 and $1.38364. However, if rejected, support lies at $1.36332 and $1.35734.
For now, short-term momentum favors bulls, with price comfortably above prior range highs and all major moving averages trending upward.
EUR/USD Technical Forecast
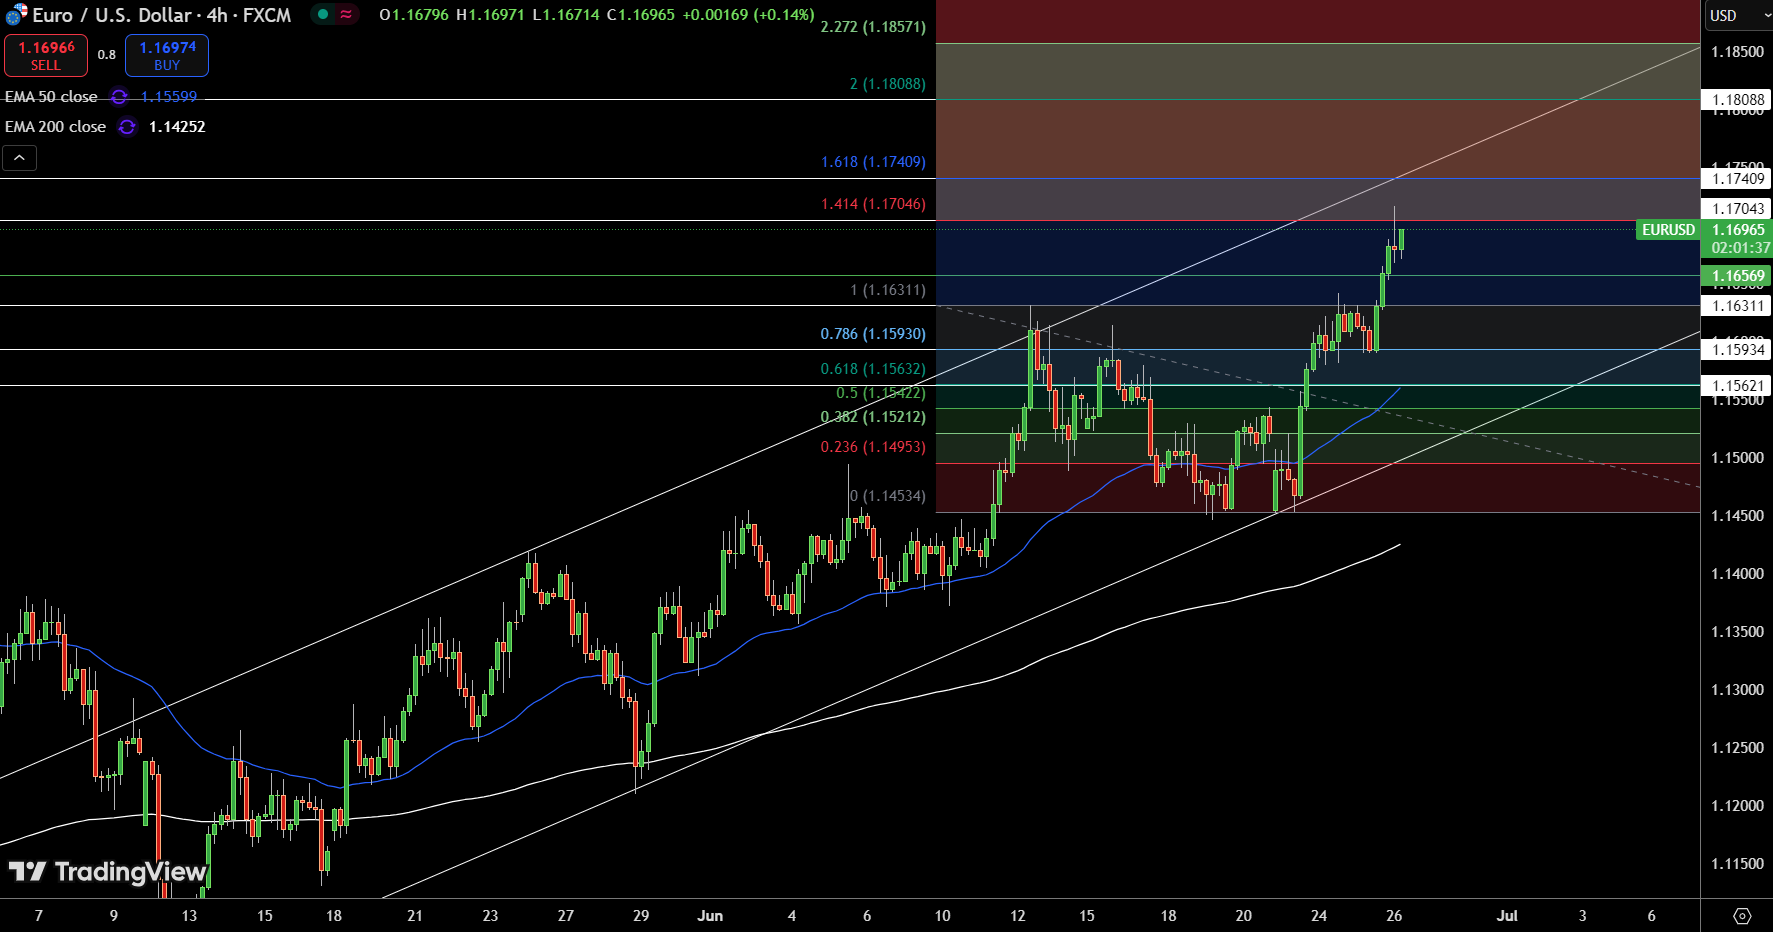
EUR/USD surged to a high of $1.17046, marking a breakout above the $1.16311 level and clearing the 1.618 Fibonacci extension near $1.17409. The pair remains firmly supported by the 50-EMA ($1.1559) and is trending within a rising channel structure. The breakout signals strong bullish momentum, supported by higher lows and sustained buying interest since mid-June.
If buyers maintain control above $1.16569, the next targets lie at $1.18088 (2.0 Fib) and $1.18571 (2.272 extension). A close below $1.16311 could invalidate the breakout, with support near $1.15632 (Fib 0.618) and $1.14534 (channel base) in focus. For now, technical bias favors further gains as long as the pair holds above $1.163.
About the Author
Bob MasonChief Crypto Boss
123456789 30 He has written extensively for a broader audience and his current focus is on developments relating to the financial markets including, but not limited to currencies, commodities, alternative asset classes, and global equities.


Advertisement