
Advertisement
Advertisement
US Dollar Price Forecast: UK Inflation Misses Forecast, Impacting Gold, GBP/USD, and EUR/USD Outlook
By:
Key Points:
- The US Dollar gained as the Empire State Manufacturing Index fell to -11.9, raising economic concerns ahead of key US data releases.
- GBP dropped as UK CPI hit 1.7%, below the expected 1.9%, while core CPI also missed estimates, reinforcing bearish pressure on GBP/USD.
- The Dollar Index (DXY) trades at $103.353, with immediate resistance at $103.36 and support at $103.12. A bullish breakout is likely if levels hold.

In this article:
US Dollar Gains as Key Data Looms; Gold Remains Steady
The US Dollar strengthened following the Empire State Manufacturing Index’s steep drop to -11.9 on Tuesday, sparking concerns about economic growth. Meanwhile, Gold remains steady at $2,666 as traders anticipate upcoming US data, including retail sales and unemployment claims set for Thursday.
Gold is traditionally a safe-haven asset, and any signs of economic weakness in the US could fuel further demand.
With import prices expected to decline, the USD’s strength may face pressure, making Gold an appealing alternative for risk-averse investors.
US Dollar Index (DXY) – Technical Analysis
The Dollar Index (DXY) is trading at $103.353, up 0.14% during the session. The index has held above its pivot point of $103.27, signaling near-term strength.
Immediate resistance is seen at $103.36, with higher levels at $103.47 and $103.58 if the bullish momentum continues.
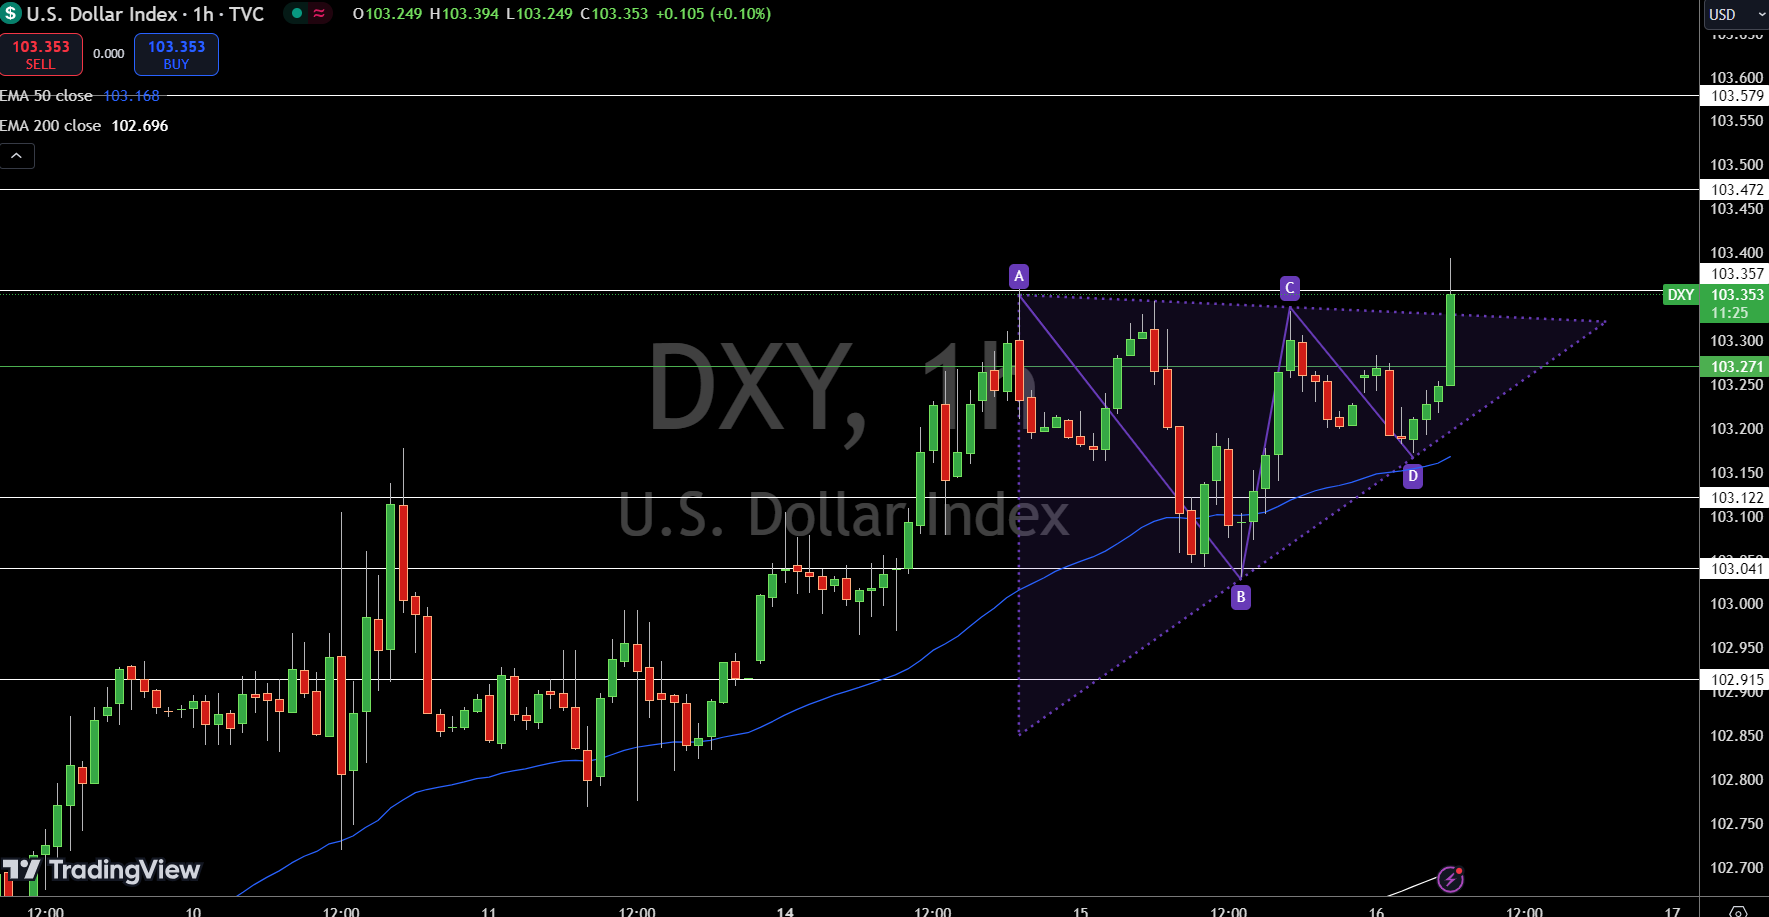
On the downside, support lies at $103.12, followed by $103.04 and $102.92. A symmetrical triangle breakout on the 4-hour chart suggests the potential for further gains, with the 50-day EMA at $103.17 and the 200-day EMA at $102.70 supporting the upward move.
As long as the index remains above $103.27, the bullish bias holds, but a break below could trigger a sharper sell-off.
Gold – Technical Analysis
Gold (XAU/USD) is trading at $2,666, up 0.18%, with resistance at $2,676.15 and support at $2,646.10. The 50-day EMA at $2,649.20 signals bullish momentum.
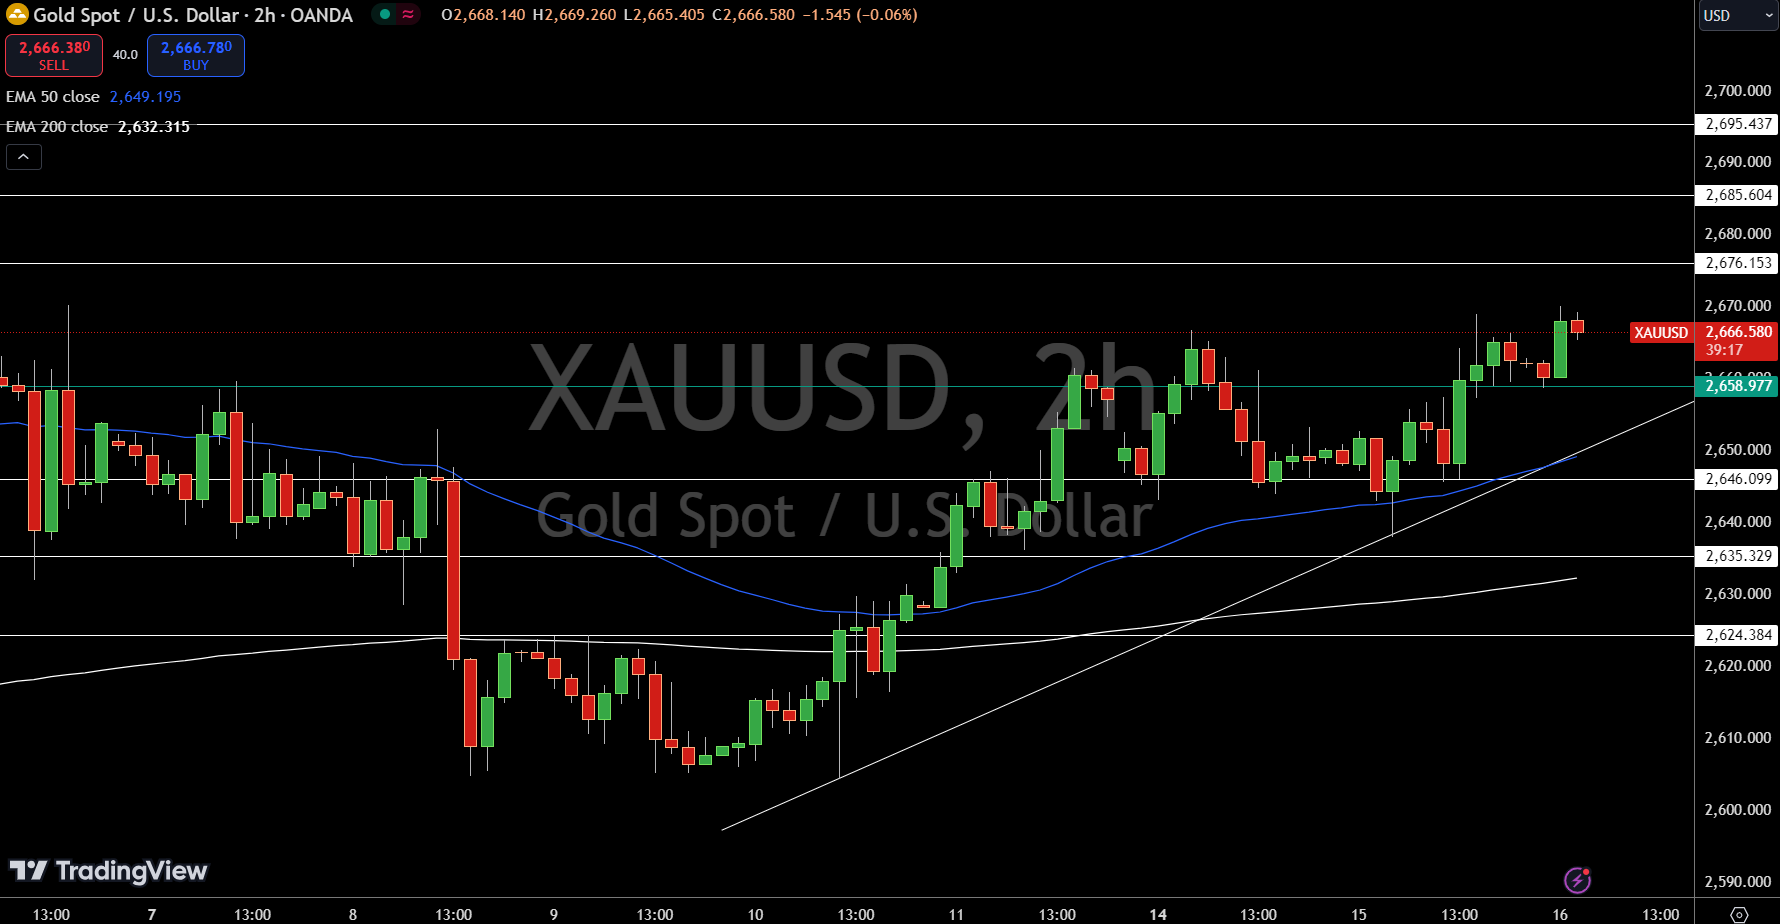
A break below $2,660 could trigger further downside, with support targets at $2,635.33 and $2,624.38, while resistance levels stand at $2,685.60 and $2,695.44.
Sterling Dips as UK Inflation Data Misses Forecasts
Sterling (GBP) slipped after disappointing inflation data on Wednesday. The UK CPI came in at 1.7%, below the expected 1.9%, while Core CPI hit 3.2%, missing forecasts of 3.4%.
Additionally, PPI Input and Output both declined, adding to the bearish sentiment. However, the HPI rose to 2.8%, providing a slight boost for the Pound.
GBP/USD Technical Analysis
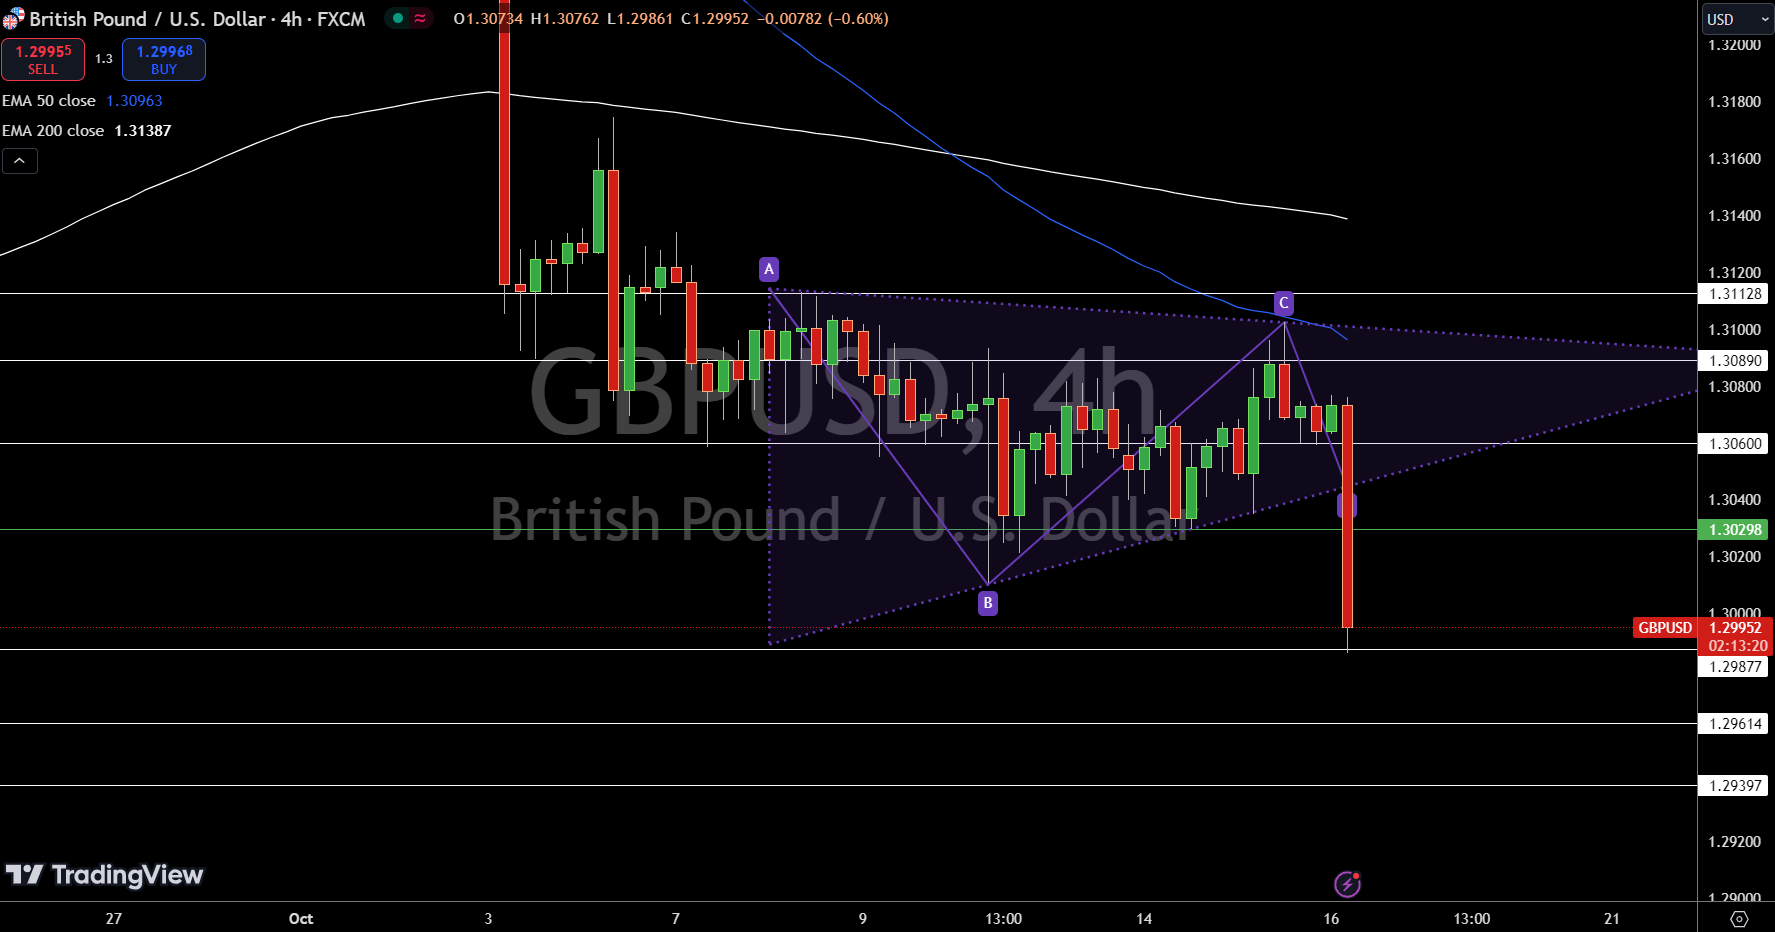
The GBP/USD pair trades at $1.29952, down 0.63% for the day. The pair is under pressure, sitting just below its pivot point at $1.30298. Immediate resistance is seen at $1.30600, with further levels at $1.30890 and $1.31128.
On the downside, immediate support lies at $1.29877, followed by $1.29614 and $1.29397. The 50-day EMA at $1.30963 and the 200-day EMA at $1.31387 signal a bearish outlook as long as the pair remains below these levels.
A symmetrical triangle pattern suggests indecision, but a break above $1.30298 could spark bullish momentum.
Euro Gains Amid Positive German Economic Sentiment
The Euro (EUR) strengthened after Germany’s ZEW Economic Sentiment index surged to 13.1, surpassing expectations of 10.2. Additionally, the broader Eurozone sentiment rose to 20.1, reflecting optimism across the region.
Despite a minor decline in German WPI at -0.3%, positive industrial production figures at 1.8% helped support the currency. Investors now look ahead to ECB President Lagarde’s speech later today for further market cues.
EUR/USD Technical Forecast
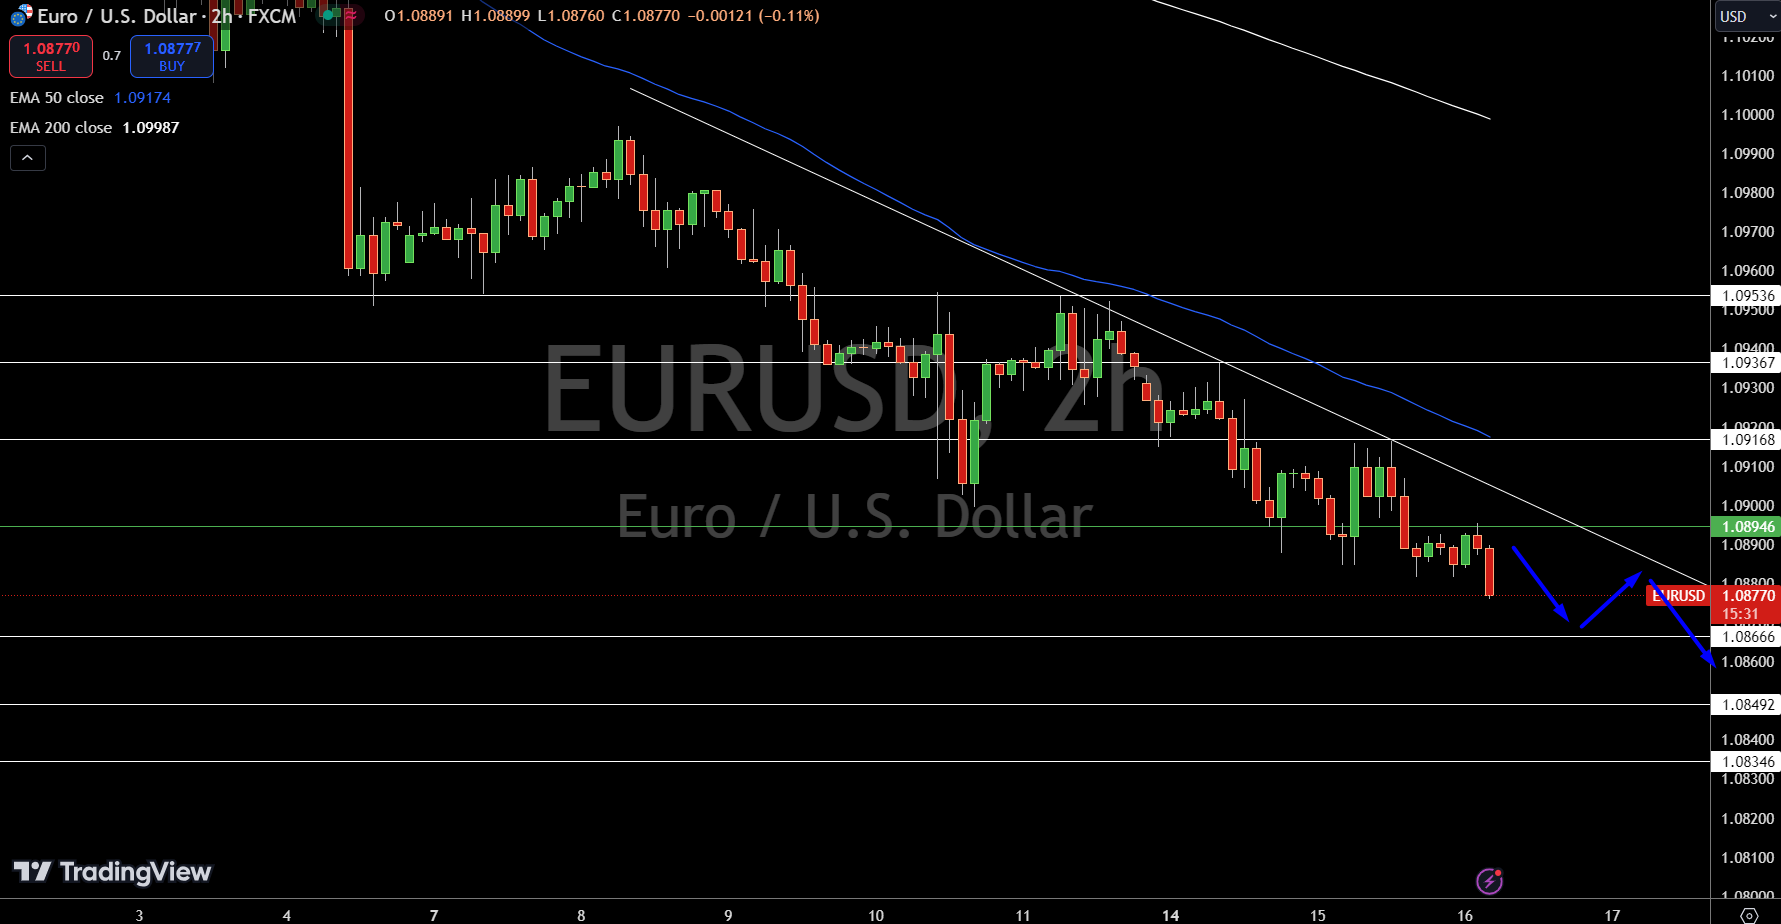
The EUR/USD pair is trading slightly lower at $1.08770, down by 0.10% on the day. The 4-hour chart shows the pair facing resistance around $1.08946, the key pivot point. Immediate resistance is $1.09168, followed by $1.09367 and $1.09536.
On the downside, support rests at $1.08666, with further levels at $1.08492 and $1.08346. The 50-day EMA is $1.09174, indicating bearish momentum below this level.
A downward trendline continues to apply resistance, and any sustained break above $1.08946 could signal a shift toward bullish territory. For now, the bearish bias remains intact below the pivot point.
About the Author
Bob MasonChief Crypto Boss
TEST 30 He has written extensively for a broader audience and his current focus is on developments relating to the financial markets including, but not limited to currencies, commodities, alternative asset classes, and global equities.
Latest news and analysis


Advertisement