
Advertisement
Advertisement
USD/JPY: Overbought or Just Taking a Breather?
By:
USD/JPY chart analysis suggests bulls could seek higher levels this week.

In this article:
Following the Bank of Japan (BoJ) maintaining its overnight rate between 0.0% and 0.1% and announcing that a bond-taper plan will be delivered at next month’s policy-setting meeting, the Japanese yen (JPY) and yields traded southbound.
Technical View Supports Buyers
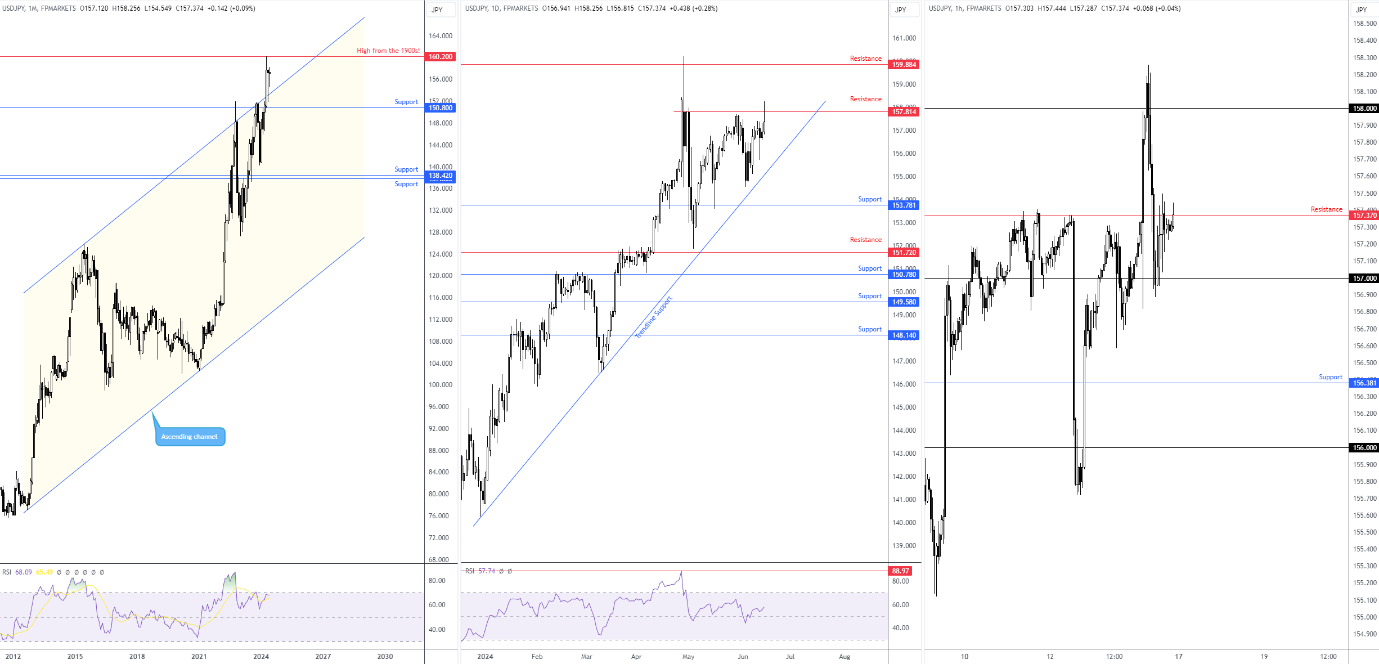
Technically, the USD/JPY is an interesting market. In the long term, the trend is unquestionably to the upside, visible on both monthly and daily charts. Having said that, upside momentum has slowed, as shown through the negative divergence on the monthly chart’s Relative Strength Index (RSI) and daily action testing the upper edge of the 50.00 centreline.
Structurally, monthly support is seen from ¥150.80, and the channel resistance extended from the high of ¥125.85 was retested as support in recent months. ¥160.20 resistance (high from the 1990s) remains a logical barrier to note overhead, though, through the daily timeframe, active resistance entered the fray on Friday at ¥157.81: the last technical line of defence before opening the door to daily resistance at ¥159.88.
Where Does This Leave Price Action in the Short Term (H1 Chart)?
Following a run on stops north of the big figure ¥158 and a subsequent retest of ¥157 (which held into the week’s close), resistance is now a concern at ¥157.37. Should offers be cleared at the aforementioned level, ¥158 could call for attention once more. In fact, given the lacklustre response at current resistance on Friday, this resistance echoes vulnerability and a breakout higher in early trading this week should not raise too many eyebrows.
H1 and Daily Resistances Eyed for Bullish Cues
Based on the above analysis, a breakout above H1 resistance at ¥157.37 could trigger short-term buying towards daily resistance from ¥157.81. Assuming a daily close above the noted daily resistance, this would place ¥158 in a vulnerable position and unshackle things for further breakout buying.
DISCLAIMER:
The information contained in this material is intended for general advice only. It does not take into account your investment objectives, financial situation or particular needs. FP Markets has made every effort to ensure the accuracy of the information as at the date of publication. FP Markets does not give any warranty or representation as to the material. Examples included in this material are for illustrative purposes only. To the extent permitted by law, FP Markets and its employees shall not be liable for any loss or damage arising in any way (including by way of negligence) from or in connection with any information provided in or omitted from this material. Features of the FP Markets products including applicable fees and charges are outlined in the Product Disclosure Statements available from FP Markets website, www.fpmarkets.com and should be considered before deciding to deal in those products. Derivatives can be risky; losses can exceed your initial payment. FP Markets recommends that you seek independent advice. First Prudential Markets Pty Ltd trading as FP Markets ABN 16 112 600 281, Australian Financial Services License Number 286354.
About the Author
Aaron Hillcontributor
Aaron graduated from the Open University and pursued a career in teaching, though soon discovered a passion for trading, personal finance and writing.
Did you find this article useful?
Latest news and analysis


Advertisement