
Advertisement
Advertisement
XRP, SOL, DOGE: Which Altcoin Offers the Strongest Buy Signal Right Now?
By:
Key Points:
- XRP is consolidating within an ascending triangle and needs a breakout above $2.85 to target $4.18.
- Solana's head and shoulders pattern signals bearish risk, with a potential drop toward $110 if $180 support breaks.
- DOGE is forming a bullish reversal setup, with an ascending triangle breakout above $0.31 potentially leading to $0.40-$0.42.

XRP (XRP), Solana (SOL), and Dogecoin (DOGE) are at critical technical levels after volatile price action.
XRP has declined by around 25% after topping out locally at around $3.39. Similarly, Solana has dropped 40% over a month after establishing its record high and is now threatening further downside. DOGE seems better despite falling 45% from its local peak, primarily due to a convincing bullish reversal setup.
Here’s what these patterns signal for traders.
XRP Eyes a Breakout from an Ascending Triangle
XRP/USD has been consolidating within an ascending triangle pattern, which is typically a bullish continuation setup. The price has formed higher lows while maintaining resistance around the $2.80-$2.85 range.
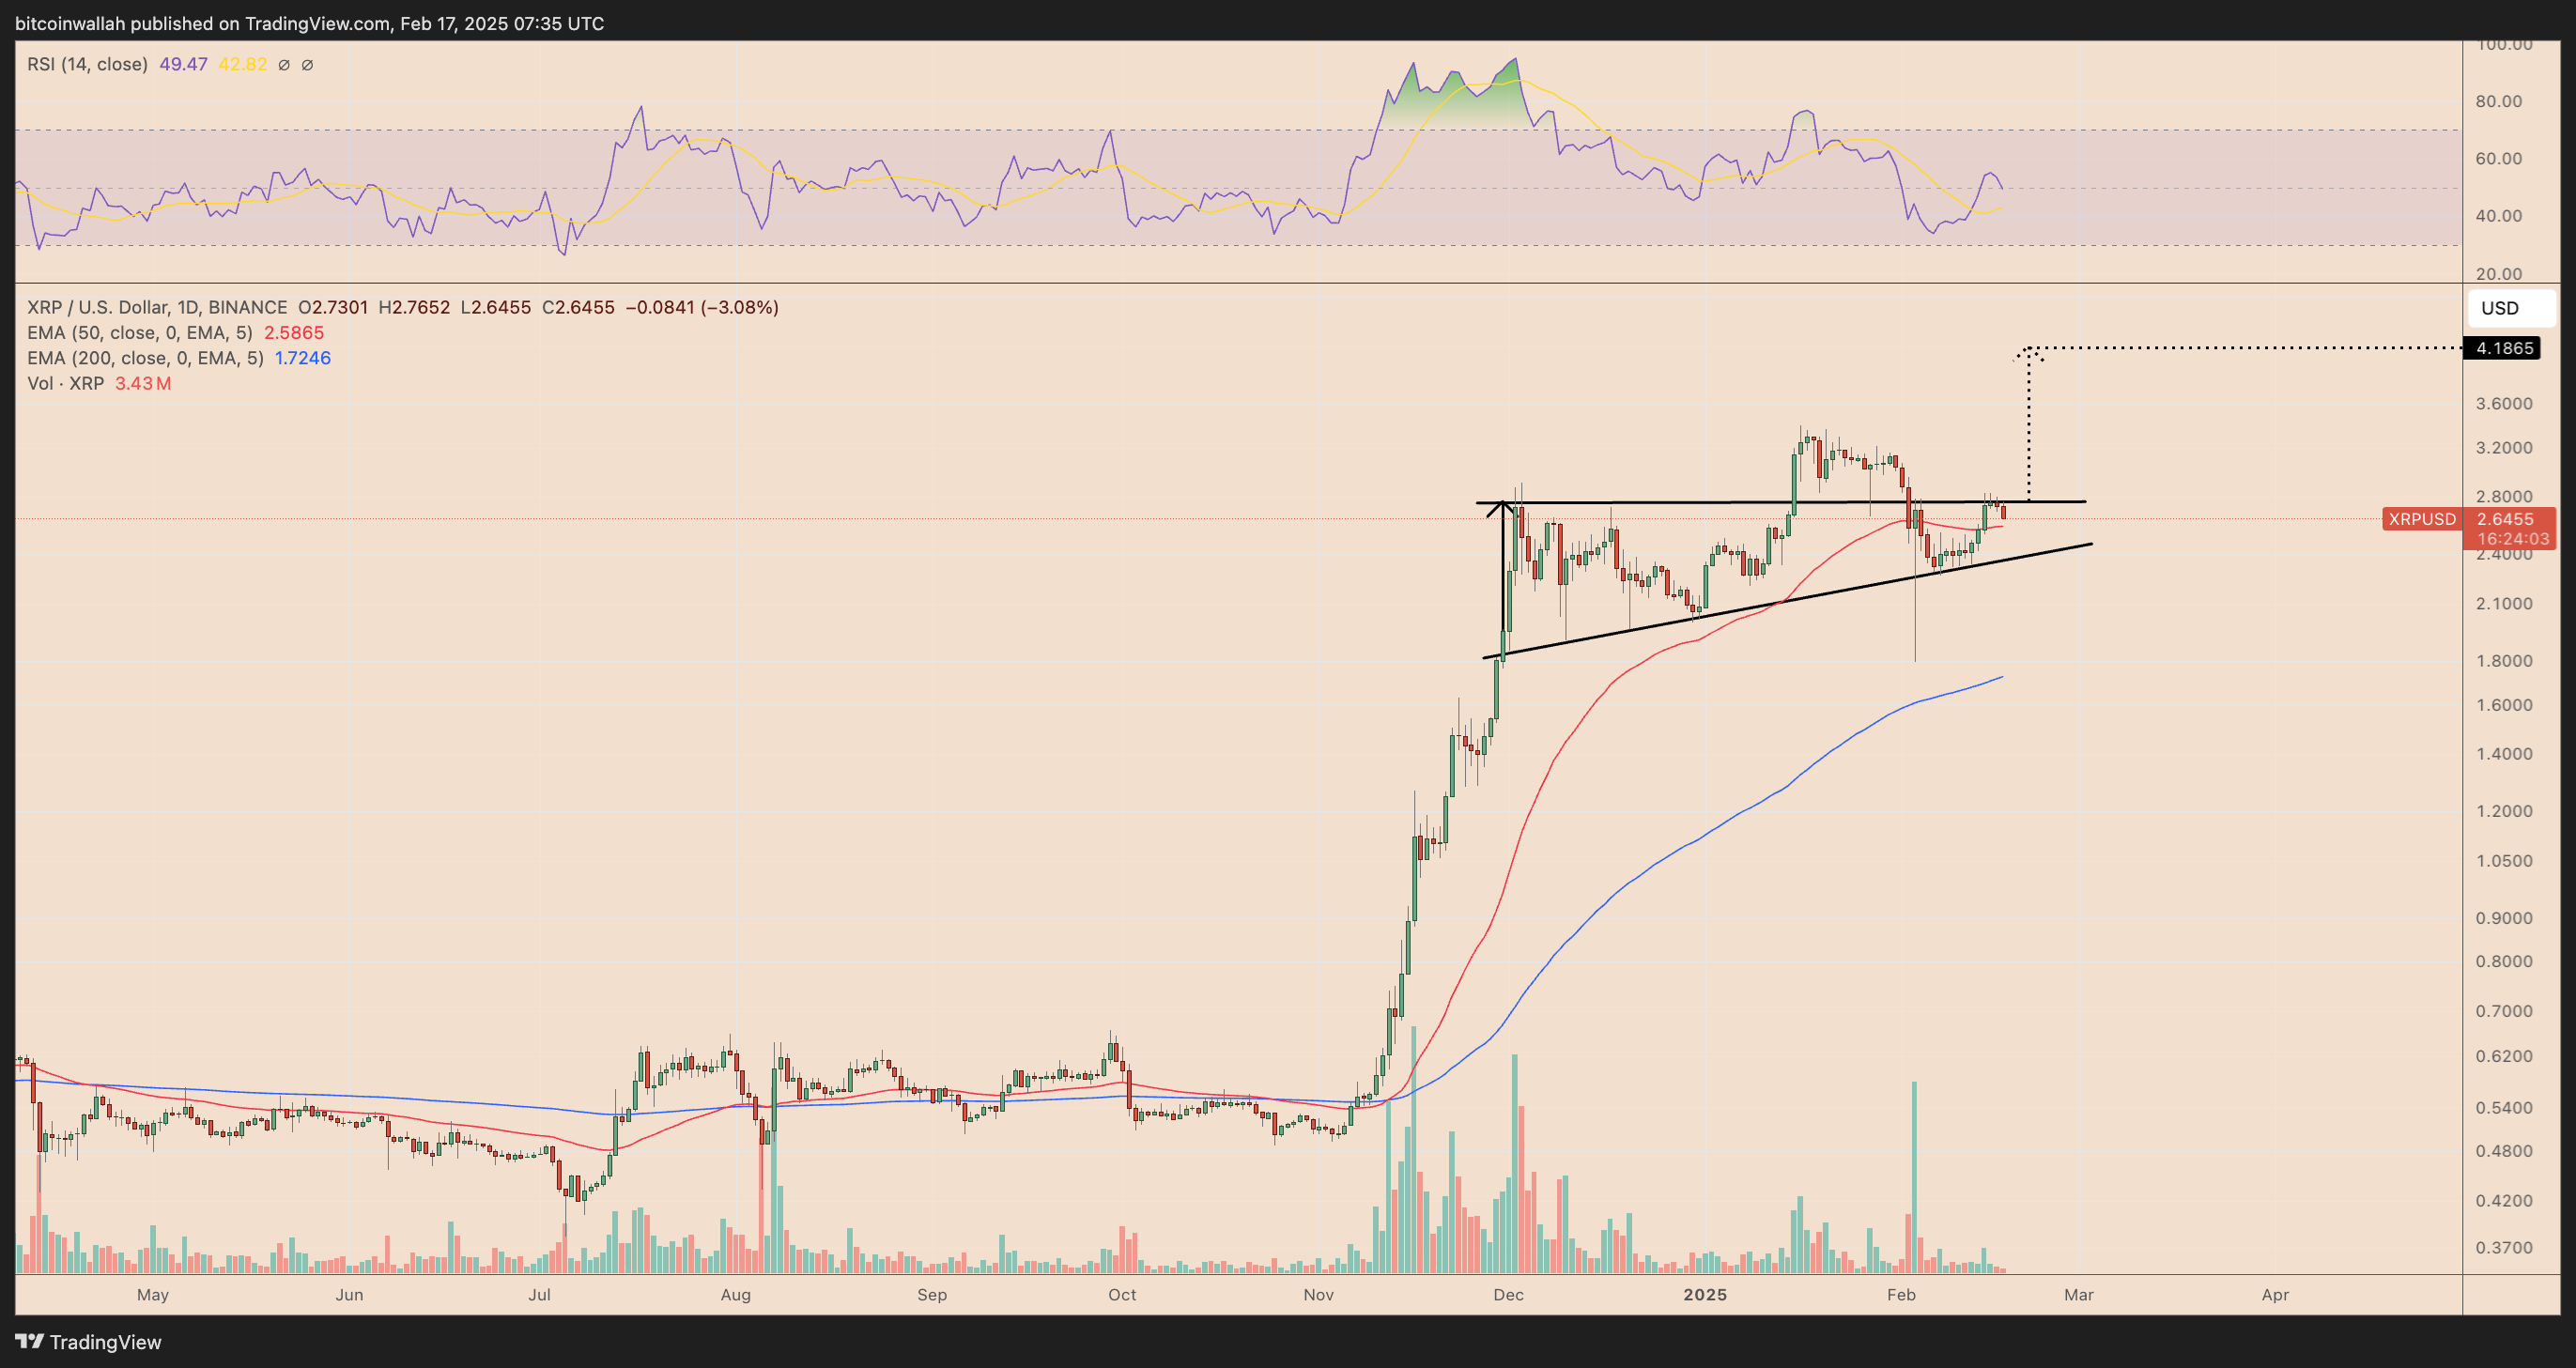
The first breakout attempt failed, leading to a pullback, but the pattern remains intact.
- Key Resistance: $2.85
- Support Trendline: Rising from around $2.10
- Moving Averages:
- The 50-day EMA (red) at $2.58 is acting as immediate support.
- The 200-day EMA (blue) at $1.72 remains a long-term floor.
A decisive daily close above $2.85 could confirm the breakout, pushing XRP toward a measured move target of $4.18, calculated from the triangle height added to the breakout level. On the downside, a break below $2.40 could invalidate the bullish outlook and open the door for a deeper correction.
Solana Risks Breakdown from a Head and Shoulders Pattern
Solana’s daily chart is flashing a textbook head and shoulders (H&S) pattern, a bearish reversal signal that suggests a deeper decline if confirmed. The neckline support around $180 is being tested, and a breakdown could trigger an extended selloff.
- Left Shoulder: Peaked around $215
- Head: Reached nearly $300
- Right Shoulder: Formed at $220
- Neckline Support: $180
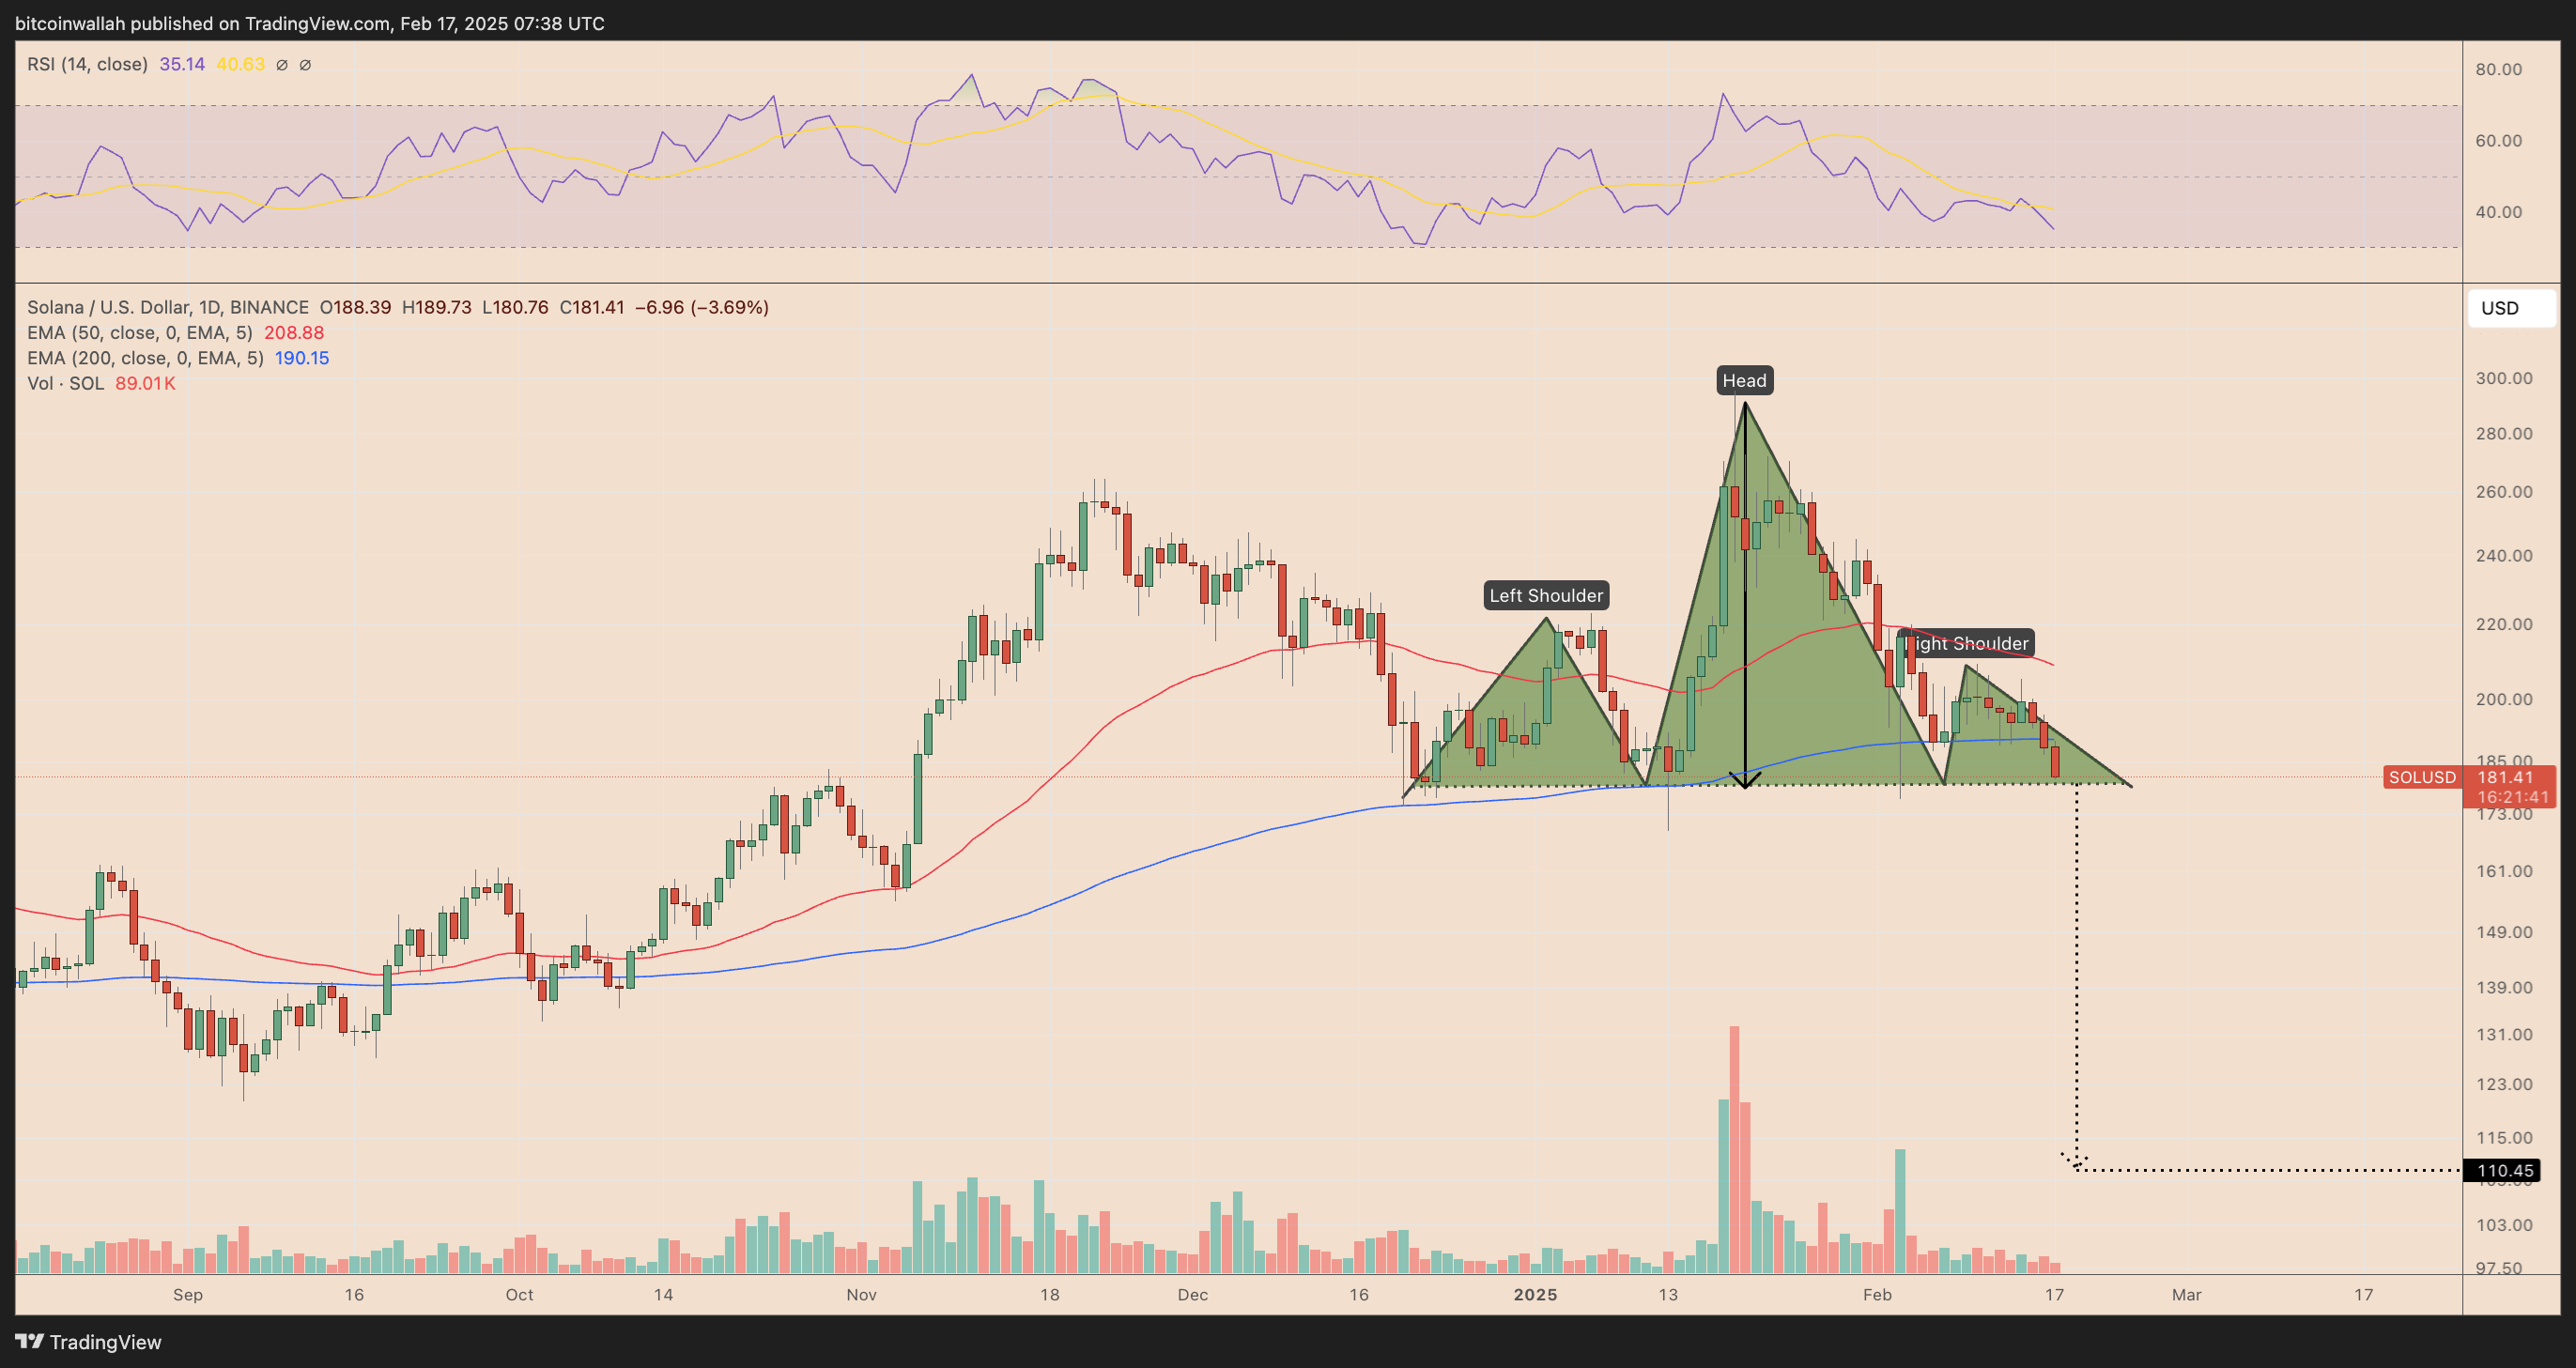
Adding to the bearish case, SOL is now trading below the 50-day EMA ($208.88) and approaching the 200-day EMA ($190.15).
If the neckline at $180 fails, the breakdown could see Solana fall toward $110-$115, based on the measured move (the pattern’s height subtracted from the neckline).
For bulls to regain control, SOL must reclaim the $200-$210 zone and invalidate the H&S formation.
Dogecoin Forms an Ascending Triangle at the End of a Downtrend
Unlike Solana, Dogecoin is attempting a bullish reversal with an ascending triangle pattern forming after a downtrend. This pattern is often seen at market bottoms, signaling a potential shift in momentum.
- Resistance Level: $0.29
- Rising Support Line: Forming near $0.24-$0.25
- Moving Averages:
- The 50-day EMA ($0.305) is acting as overhead resistance.
- The 200-day EMA ($0.261) is holding as immediate support.
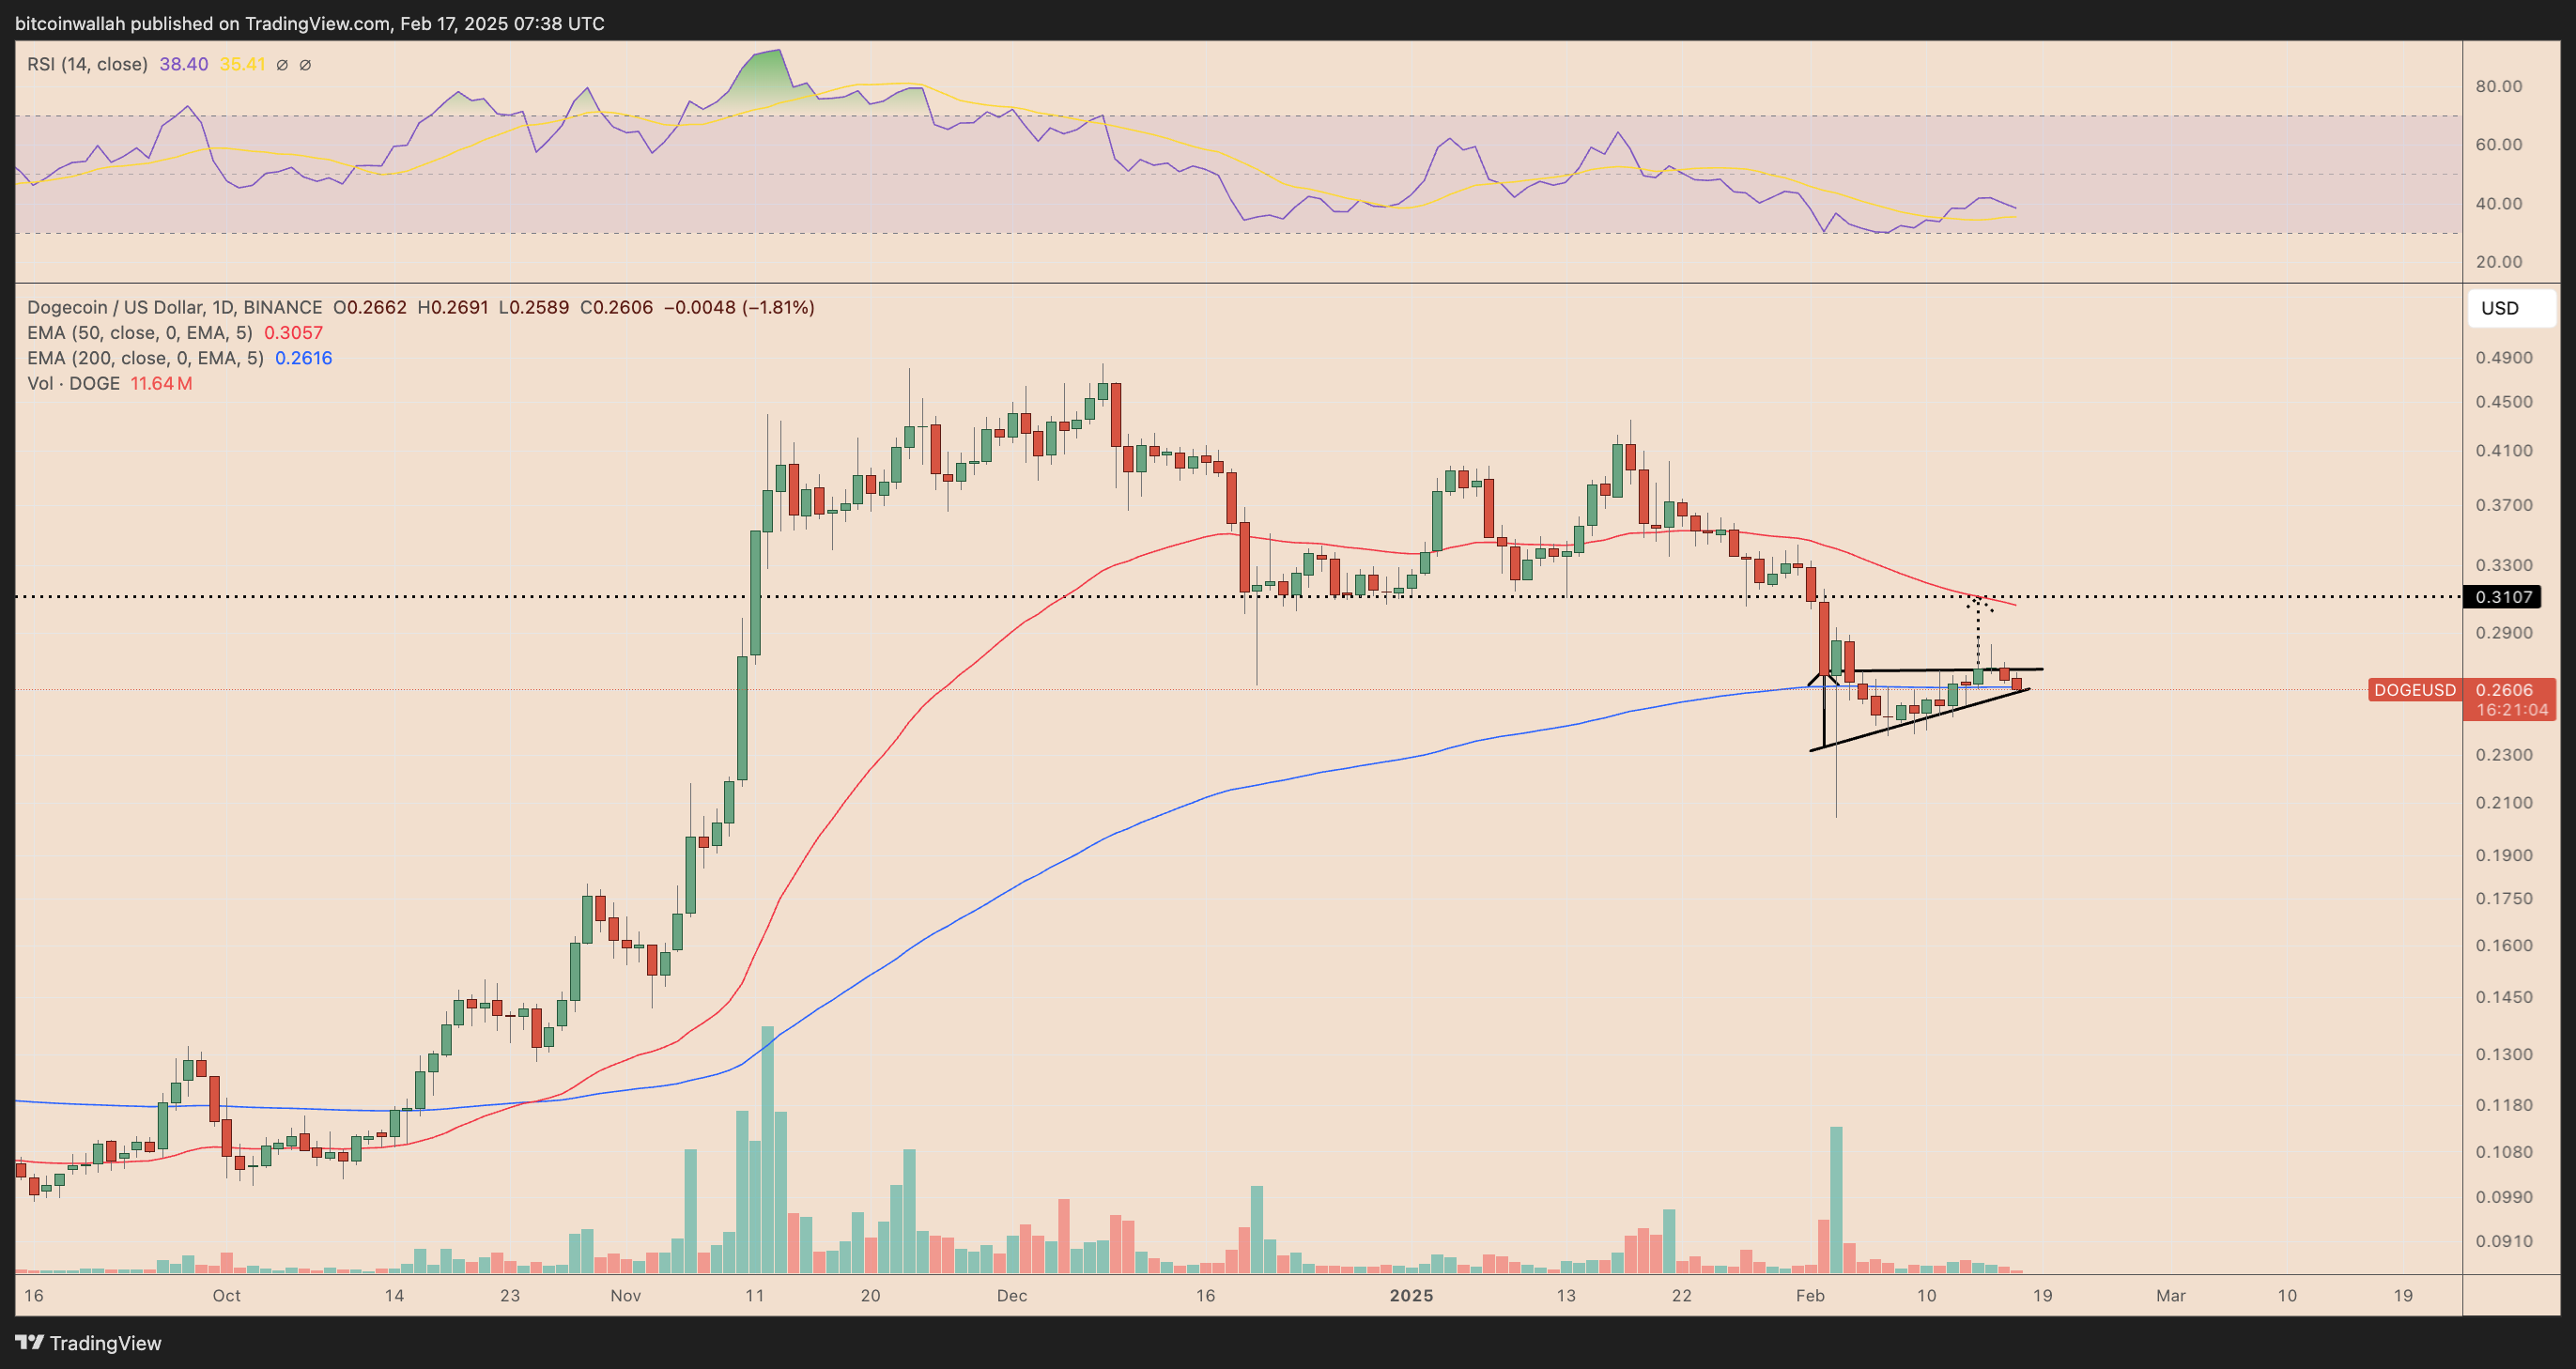
A breakout above $0.29-$0.31 could confirm the reversal, opening the door for a rally toward $0.40-$0.42 in the coming weeks. On the other hand, if DOGE loses support at $0.24, it could retest lower support levels around $0.20.
Overall, Solana’s greater downside risk portrays DOGE and XRP as more bullish tokens in the short term.
About the Author
Bob MasonChief Crypto Boss
TEST 30 He has written extensively for a broader audience and his current focus is on developments relating to the financial markets including, but not limited to currencies, commodities, alternative asset classes, and global equities.
Latest news and analysis


Advertisement