
Advertisement
Advertisement
BNB Price Crosses $600 First time in 100-Days: 3 Signals Traders Must Watch
By:
Key Points:
- BNB price crossed the $615 mark on Monday Sept 23, its highest in over 100 days dating back to June 2024.
- As of September 24, the cumulative LONG liquidation leverage stands at $40.39 million, against cumulative $37.47 million leverage on SHORT contracts.
- BNB's Relative Strength Index (RSI) indicator currently shows BNB in overbought territory, sitting at 69.01

In this article:
Binance Coin (BNB) Price Analysis:
BNB price crossed the $615 mark on Monday Sept 23, its highest in over 100 days dating back to June 2024. Derivatives markets data trends suggest the Binance Coin (BNB) rally is largely driven by speculative trading activity.
Here are 3 key BNB price indicators to watch in the days ahead
1. BNB Outperforming Altcoin Market Could attract Bears
There has been growing interest in global cryptocurrency market, since the US Fed announced a higher-than-expected 50bps rate cut on September 18. During periods of growing market liquidity, tokens issued by or linked to prominent cryptocurrency exchanges, and savvy investors seek to front-run upside from residual utility generated by the surge in trading activity.
Consequently, BNB price issued by Binance, the world’s largest exchange has witnessed disproportionately high demand over the past week, relative to the rest of the broader markets.
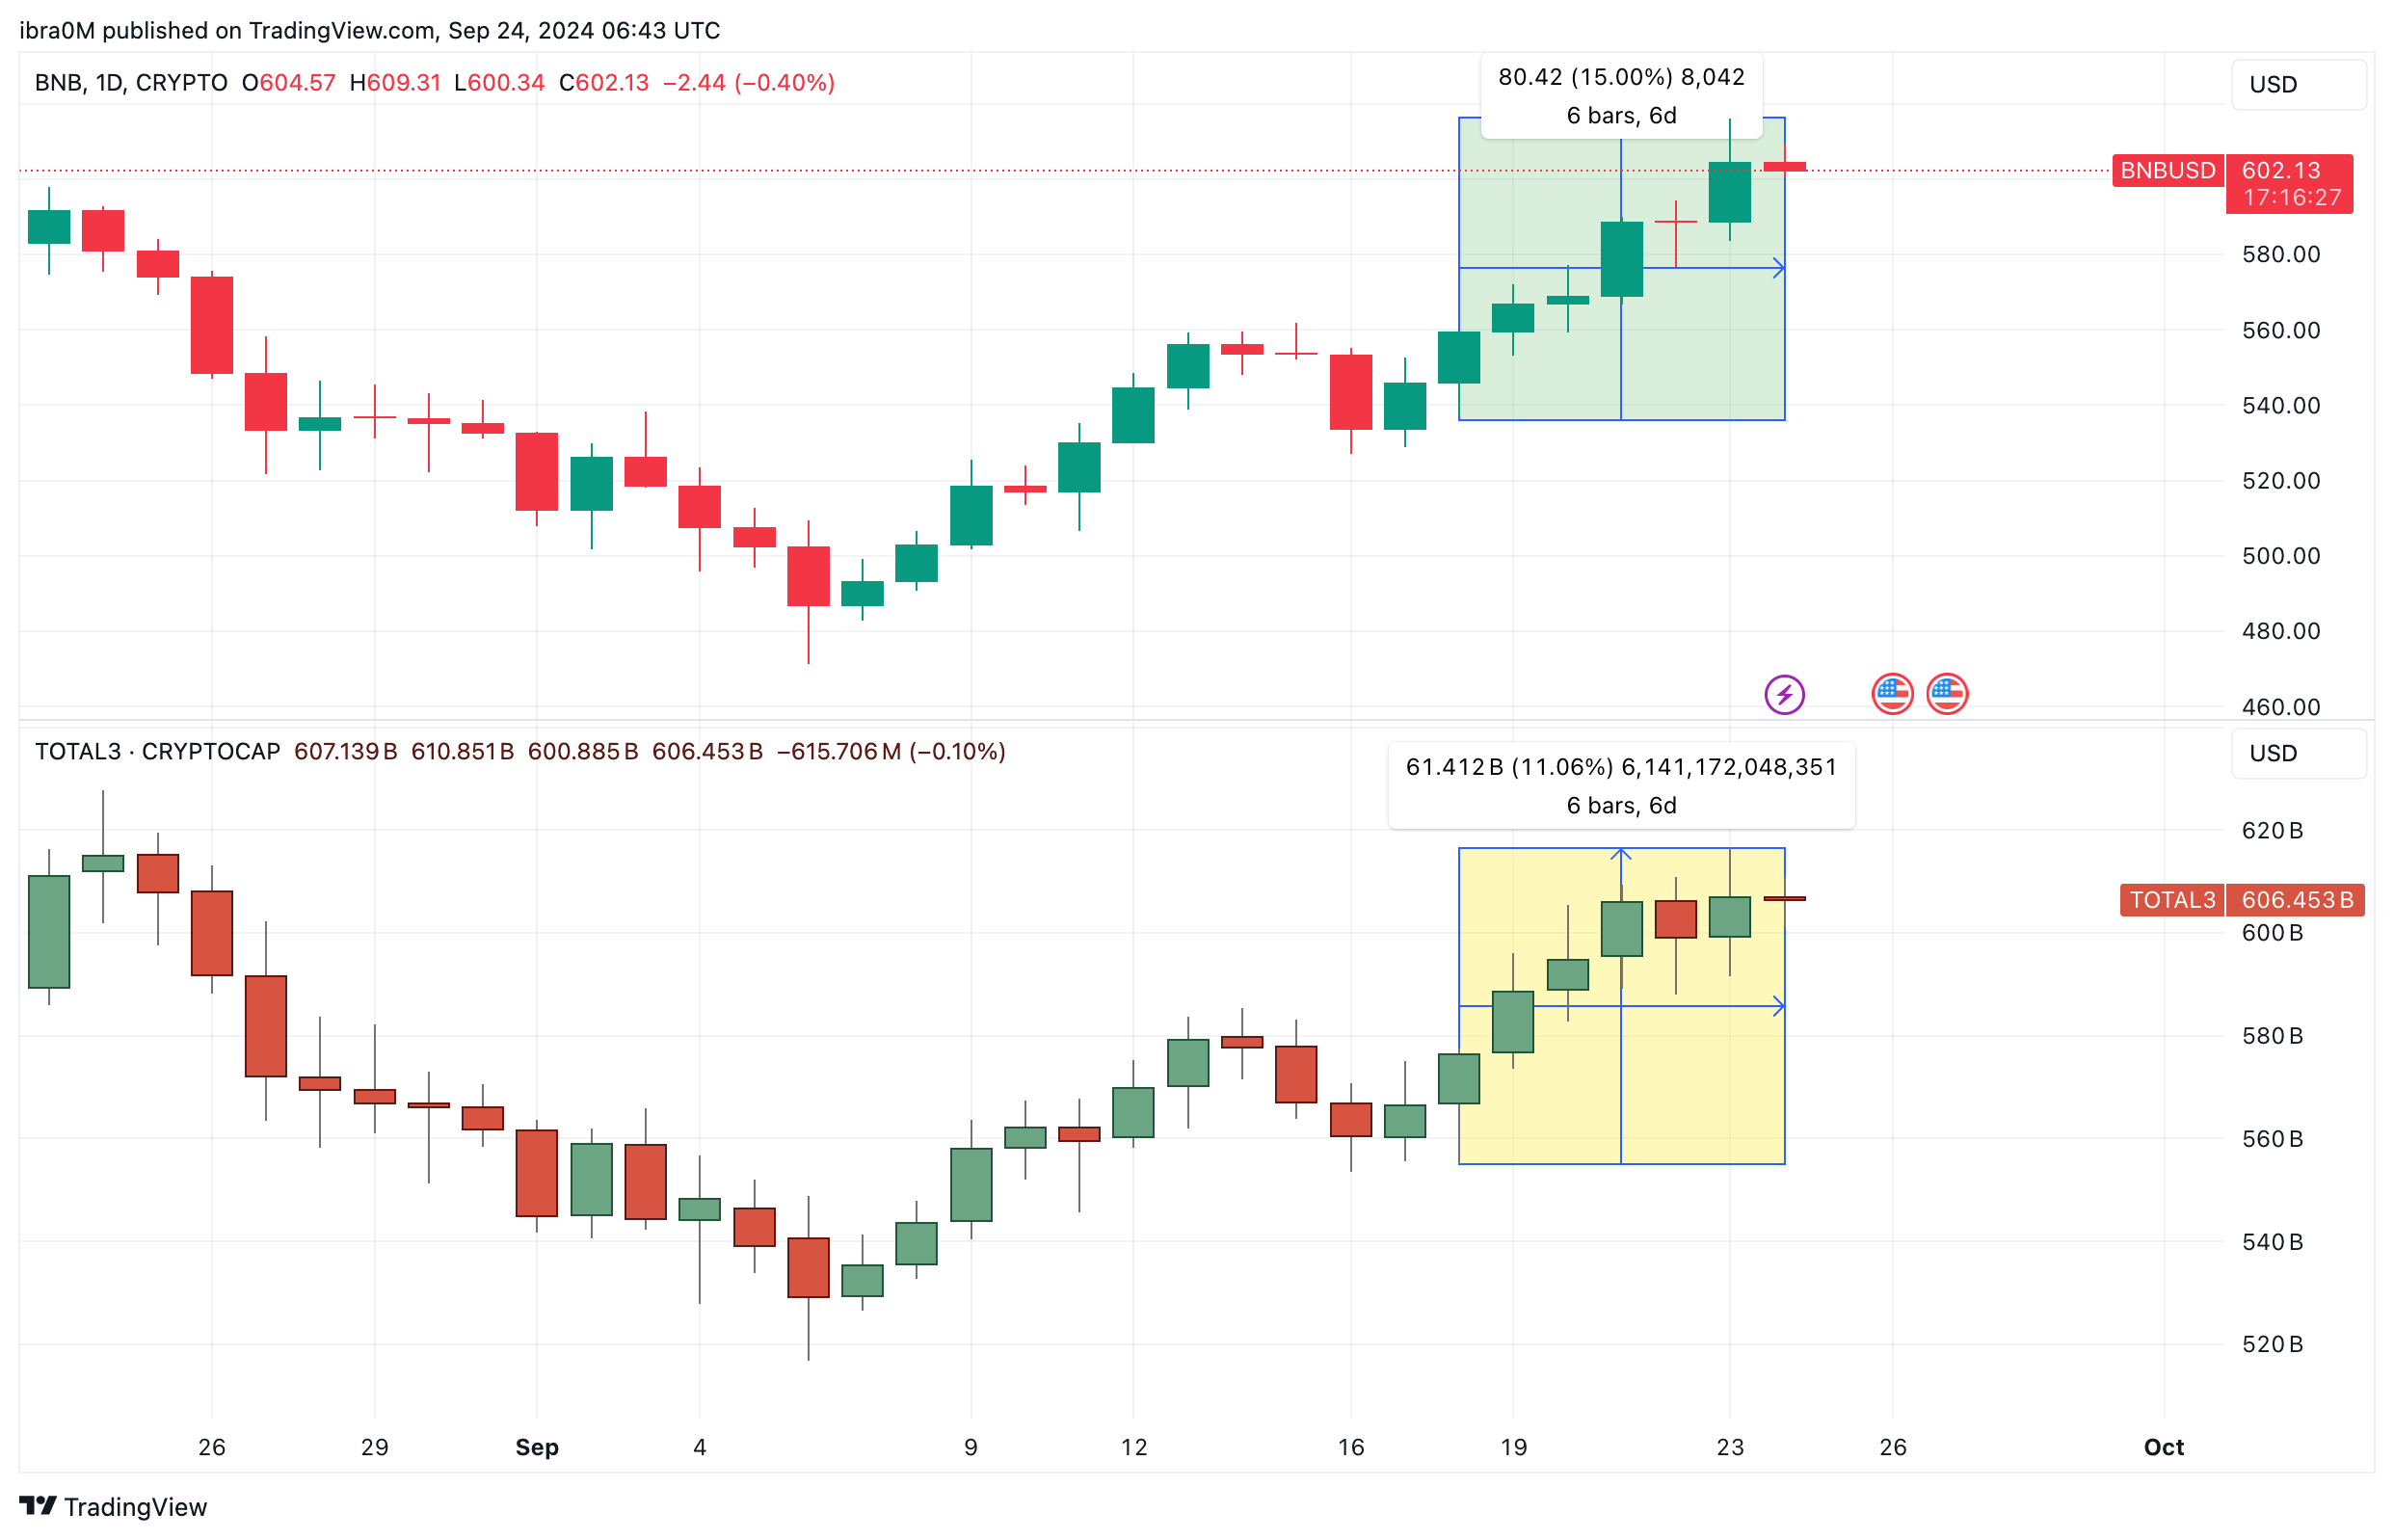
BNB price traded as low as $536 on Sept 18. But following the Fed rate cut announcement, it has rapidly climbed 15%, to hit the 100-day peak of $615 on Sept 23. The Binance coin continues to consolidate just above the $600 support level at the time of publication on Sept 24.
BNB’s 15% price growth has outperformed the broader market trends, when compared to the 11% surge on the TOTAL3 chart, which captures the valuation of all crypto altcoins excluding Ethereum (ETH) and Bitcoin (BTC).
Evidently, Binance Coin (BNB) has been outperforming broader market trends by 4% post-Fed rate cut. However, several caution signals have emerged. BNB’s outsized gains relative to other altcoins may attract increased attention from bear traders.
2. Bull Traders are Now Over-leveraged
Recent trends in the derivatives market show an uptick in leverage on long positions among bullish traders, especially since the Fed’s rate cut. While this reflects strong bullish conviction in BNB, it also introduces risk.
If market momentum dips, the over-leveraged positions could trigger a rapid sell-off, causing a significant downward price spiral. The increased use of leverage makes BNB more vulnerable to sharp corrections.
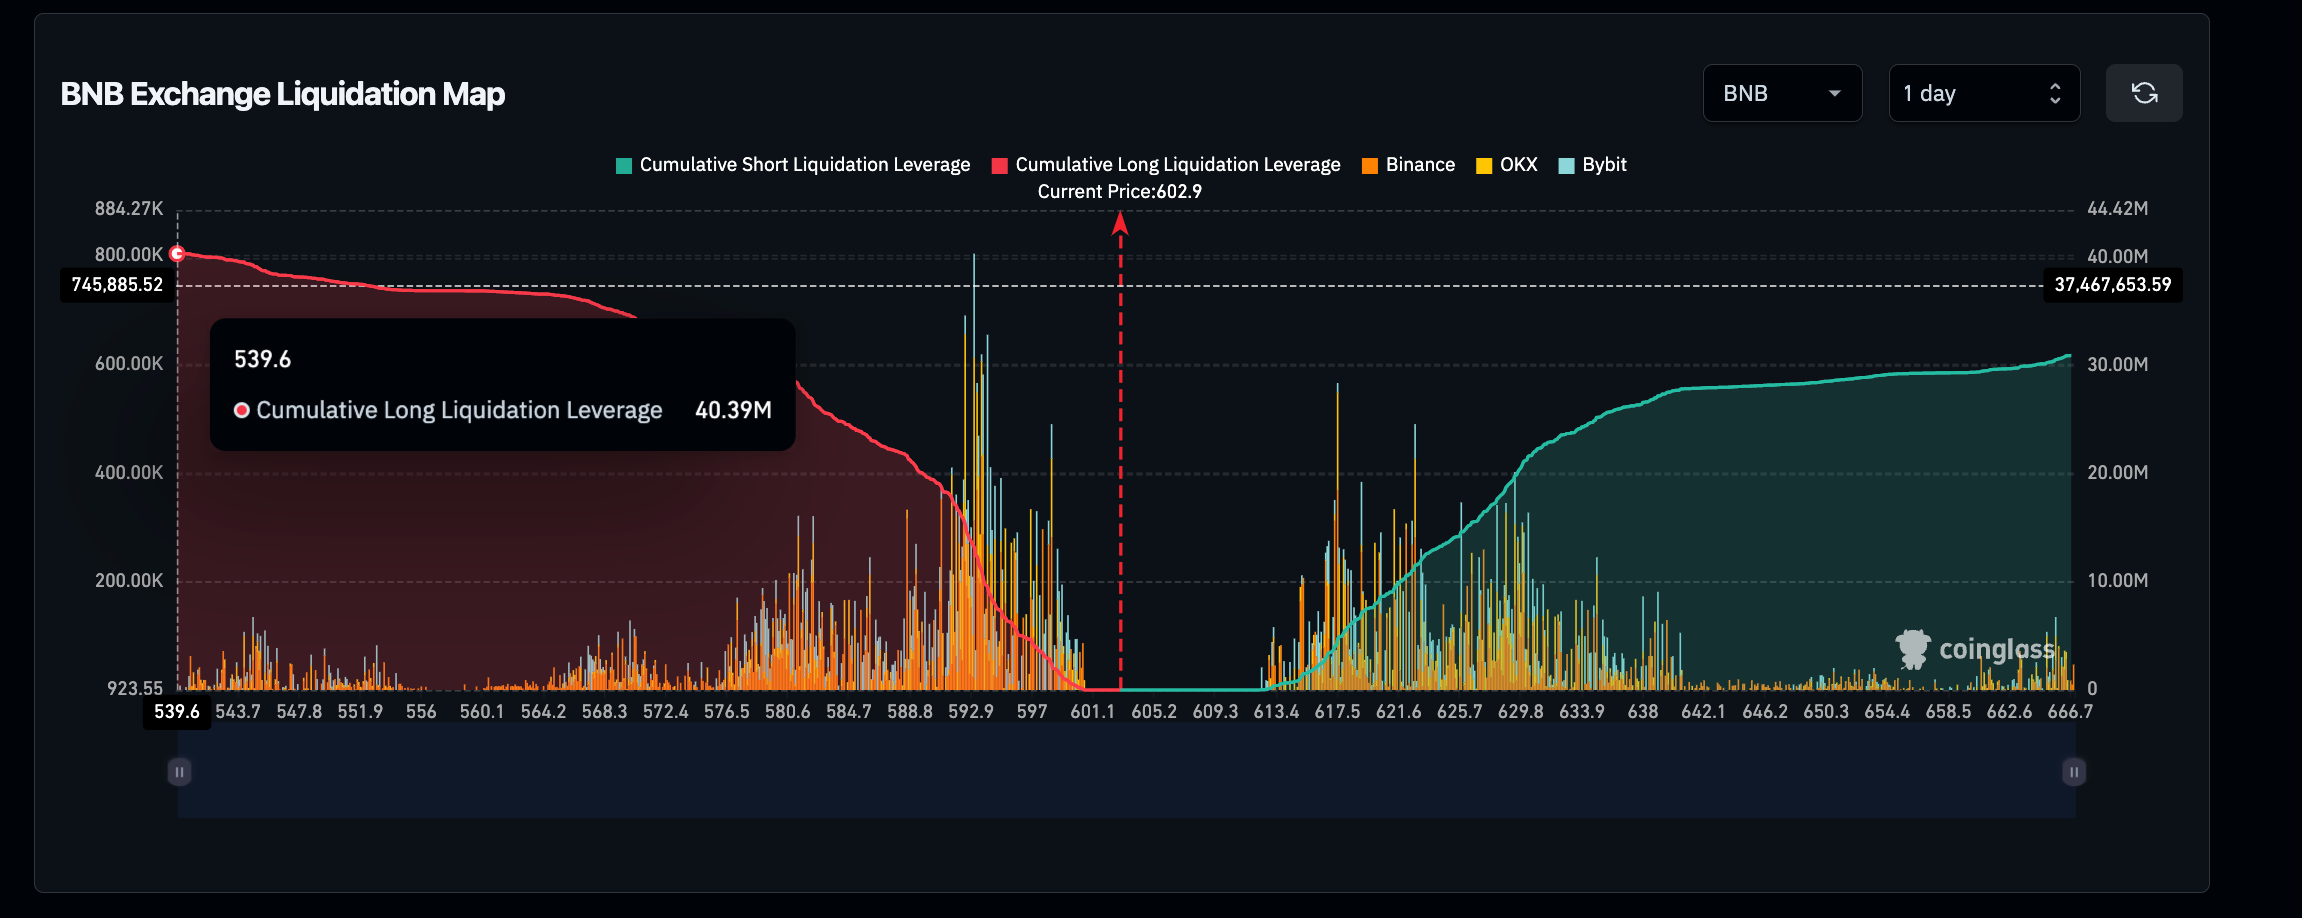
The BNB Liquidation Map highlights an imbalance between leverage applied on active long and short leverage positions. As of September 24, the cumulative LONG liquidation leverage stands at $40.39 million, against cumulative $37.47 million leverage on SHORT contracts.
This disparity indicates that bullish traders are holding a larger proportion of leveraged positions, compared to bearish traders, suggesting that bulls are taking on greater risk in anticipation of further price appreciation.
The high concentration of long liquidations around the $590 price point is especially critical—if BNB breaks below this level, it could trigger a cascade of long liquidations as traders are forced to sell their positions, amplifying downward pressure on the price.
Notably, Chagpeng Zhao, imminent release on Sept 29, has been a major bullish catalyst for BNB price action in recent days. Bear traders could potentially target such high-profile events to stage a classic sell-the-news frenzy.
3. Over-bought RSI Indicator Hints $600 Breakdown Ahead for BNB Price
Based on current technical indicators, BNB price looks set for a correction below $600 before another major breakout. The Relative Strength Index (RSI) indicator currently shows BNB in overbought territory, sitting at 69.01. RSI is a momentum oscillator that measures the speed and change of price movements, typically ranging between 0 to 100.
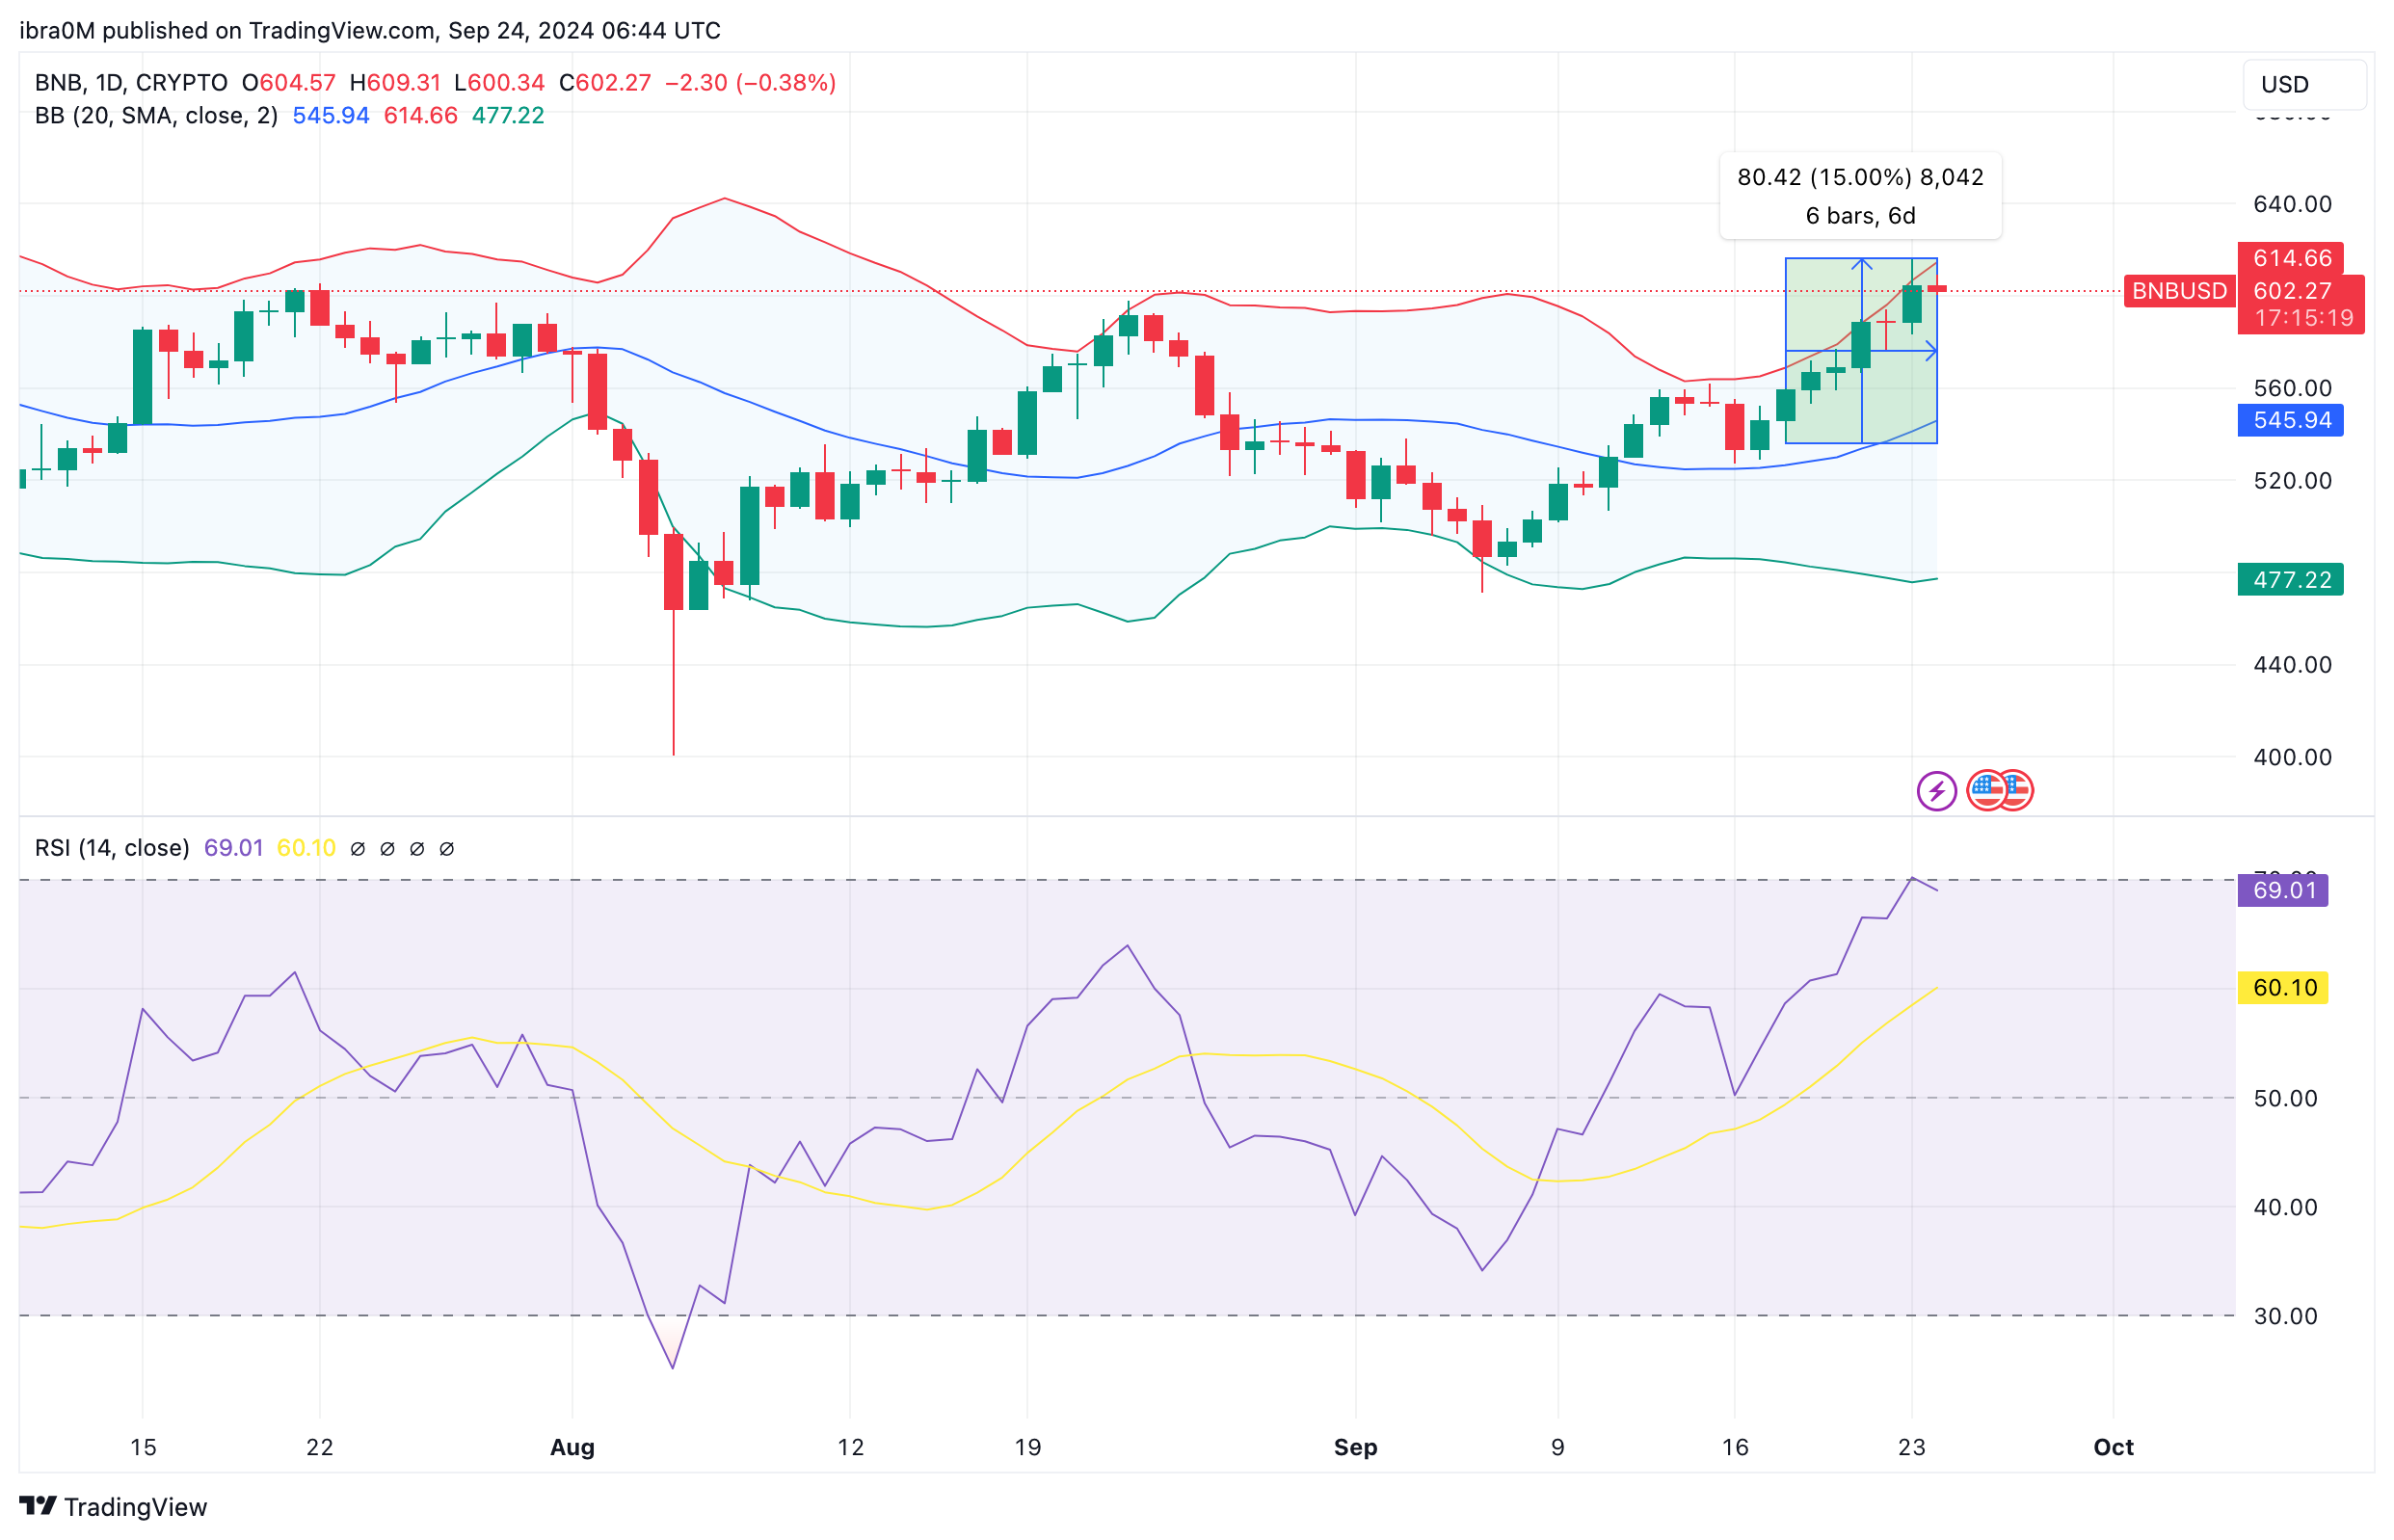
When the RSI is above 70, it signals that an asset might be overbought and due for a pullback, as buying pressure may have peaked. In BNB’s case, this suggests the coin could face a correction as traders begin to lock in gains from the recent 15% rally, pushing the price below the key $600 support level.
Additionally, the Bollinger Bands, another technical indicator used to identify volatility and overbought/oversold conditions, show that BNB has been testing the upper band at $614.66. Bollinger Bands widen during periods of high volatility, and prices tend to bounce within these bands. With BNB hovering near the upper threshold, it indicates that a short-term correction could be imminent. The midline of the Bollinger Bands, around $545, could serve as a critical support level if the price dips below $600.
In the near term, the key challenge for BNB will be maintaining support above $590. If it holds, there could be renewed bullish momentum with targets around the $650 resistance. However, if selling pressure intensifies and BNB dips below $590, a steeper correction toward $545 could be on the horizon before another potential breakout.
About the Author
Bob MasonChief Crypto Boss
TEST 30 He has written extensively for a broader audience and his current focus is on developments relating to the financial markets including, but not limited to currencies, commodities, alternative asset classes, and global equities.
Latest news and analysis


Advertisement