
Advertisement
Advertisement
Natural Gas and Oil Forecast: Is a Bullish Rebound Possible Despite OPEC+ Output Increase?
By:
Key Points:
- OPEC+ to increase output by 180,000 barrels/day in December, adding pressure to oil and natural gas prices.
- Despite geopolitical tensions, supply concerns dominate market sentiment as demand from China remains weak.
- Brent crude dropped 9% in September, its largest monthly decline since November 2022, signaling a bearish trend.

In this article:
Market Overview
Oil prices remained steady on Tuesday as increased supply prospects and sluggish global demand growth overshadowed concerns over escalating geopolitical tensions in the Middle East.
Brent crude ended September with a 9% decline, marking its largest monthly drop since November 2022, while WTI fell 7%. Analysts are cautious about oil prices given OPEC+ plans to boost output by 180,000 barrels per day in December, along with weak manufacturing data from China.
Despite geopolitical risks, markets remain focused on oversupply concerns and China’s potential growth, which could keep natural gas and oil prices under pressure.
Natural Gas Price Forecast
Natural Gas (NG) is trading at $2.90, showing no significant change from the previous session but maintaining a steady uptrend.
The price currently holds above its pivot point at $2.87, a key level supported by an upward trendline that has underpinned recent gains.
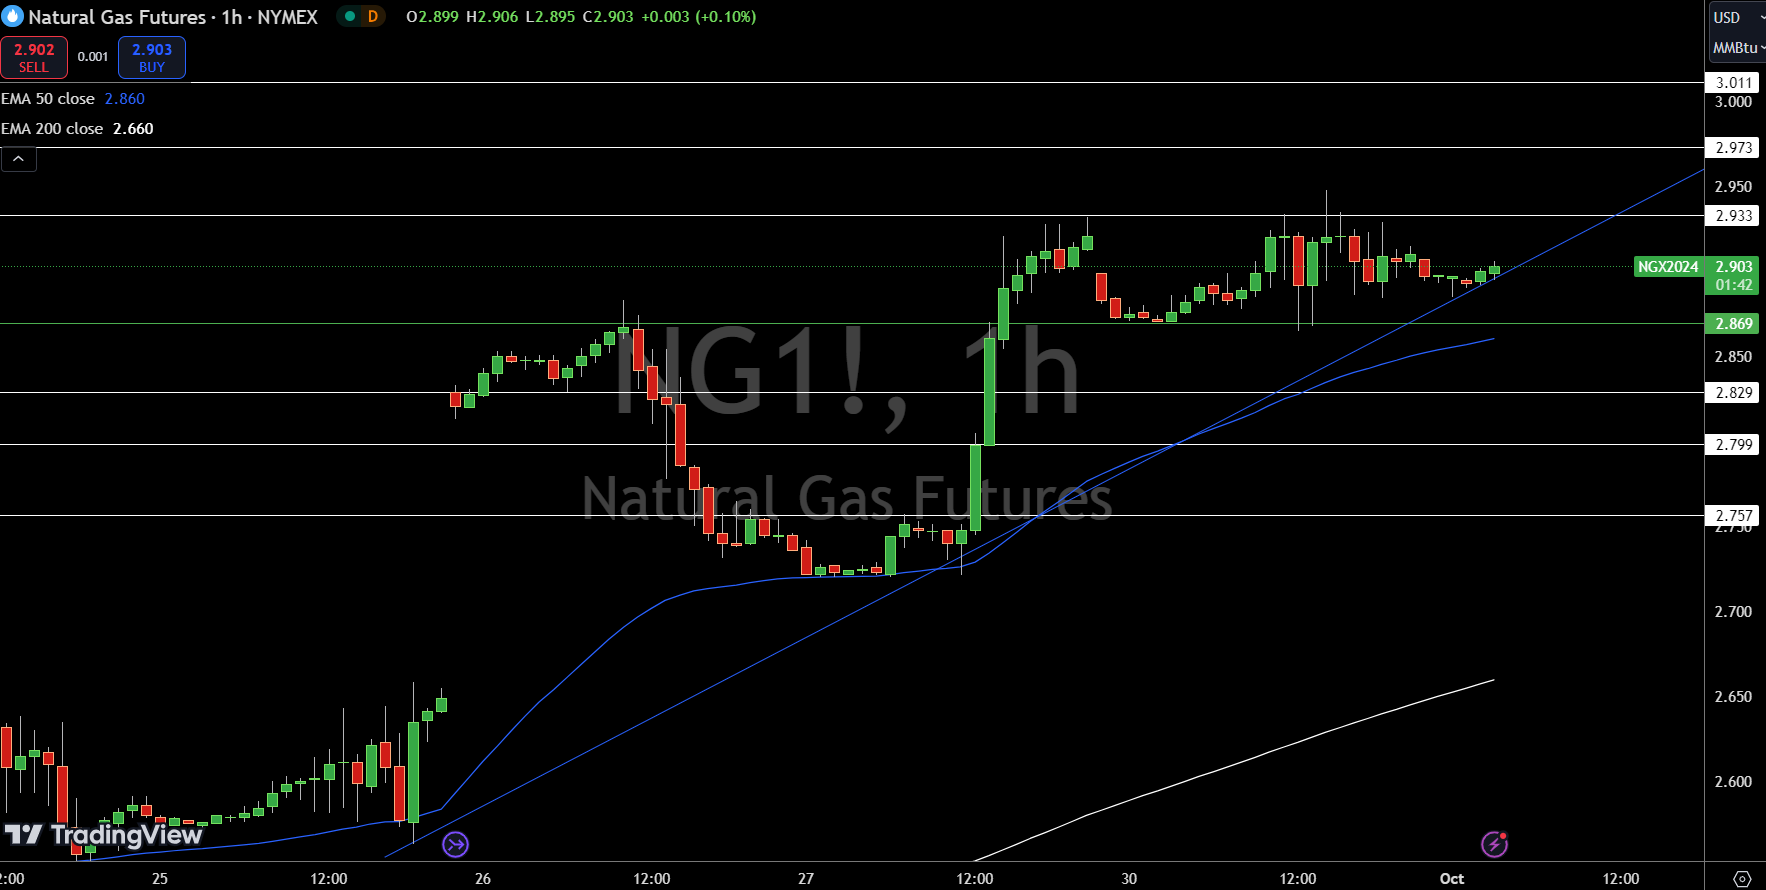
Immediate resistance is at $2.93, and a break above this could push the commodity toward the next resistance at $2.97 and then $3.01. On the downside, immediate support is at $2.83, followed by $2.80.
The 50-day Exponential Moving Average (EMA) at $2.86 serves as dynamic support, further reinforcing the bullish outlook. However, if prices drop below $2.87, selling pressure could accelerate, potentially targeting lower levels.
WTI Oil Price Forecast
WTI Crude Oil (USOIL) is trading at $68.28, slightly down by 0.05% in the early session. The market remains below its pivot point of $68.38, suggesting a cautious bearish outlook for now.
Immediate resistance is seen at $68.95, and a breakout above this level could trigger renewed buying interest.
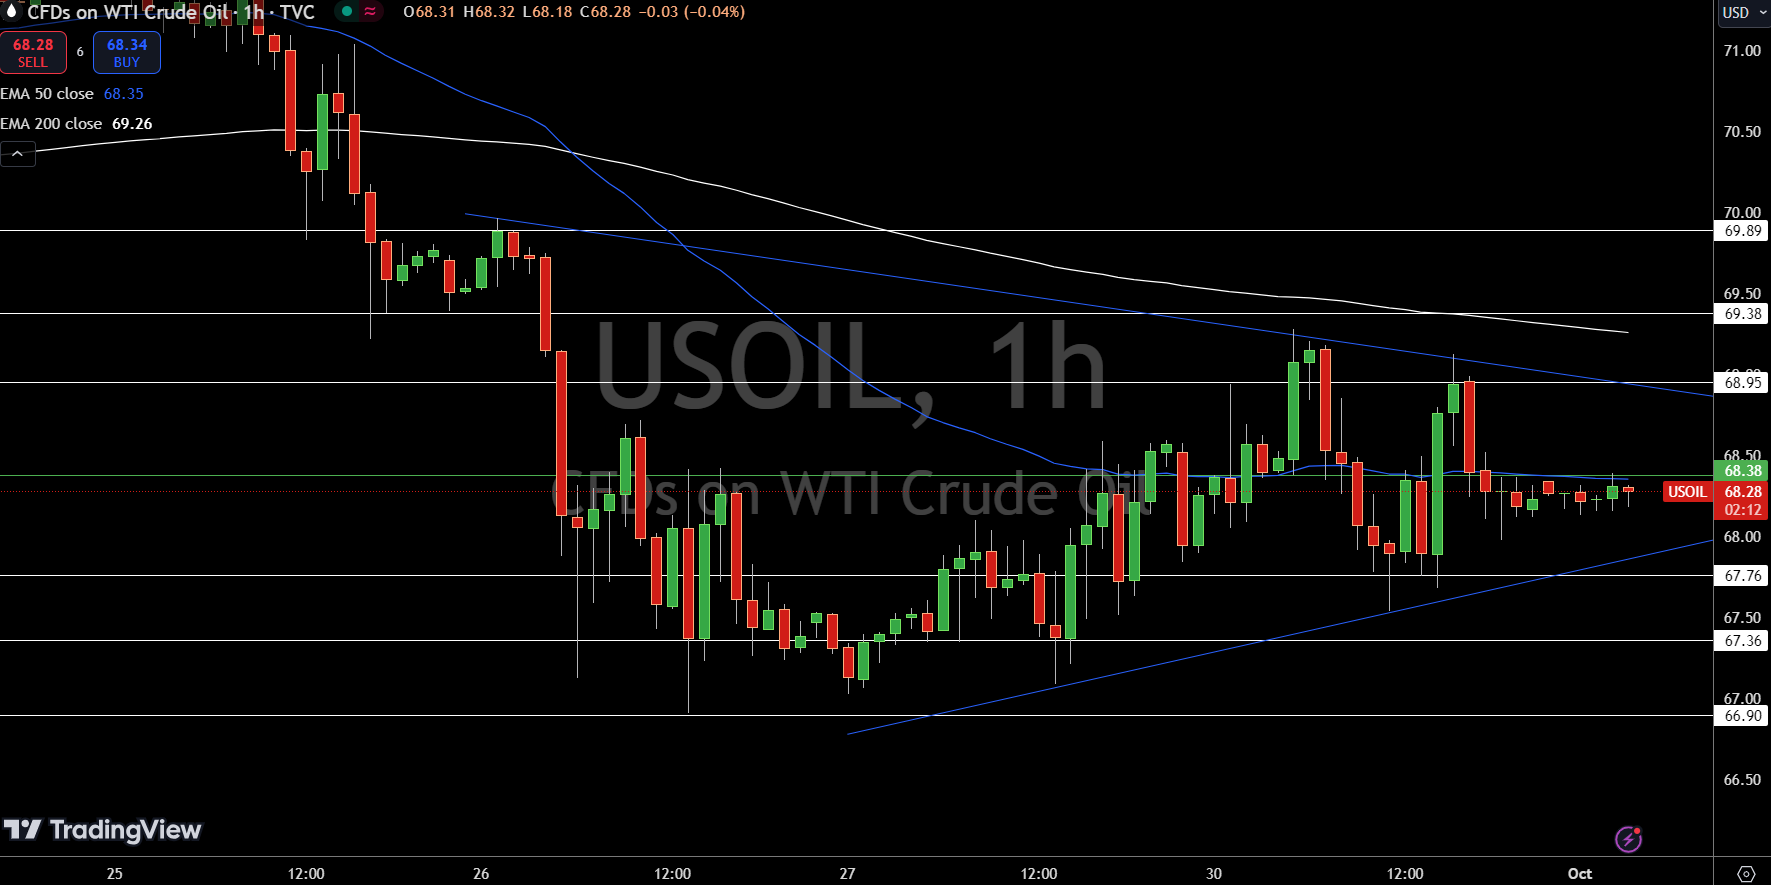
On the downside, the $67.76 support level is key; a breach here could lead to further declines toward $67.36.
The 50-day Exponential Moving Average (EMA) at $68.35 acts as a dynamic resistance, while the 200-day EMA at $69.26 looms overhead, indicating that bulls need more momentum to regain control.
For now, a break above $68.38 is crucial to shift sentiment back to the upside.
Brent Oil Price Forecast
Brent Crude Oil (UKOIL) is trading at $71.81, down 0.25% for the session, and currently below its pivot point at $71.99. This level is critical, as trading below it suggests a short-term bearish bias.
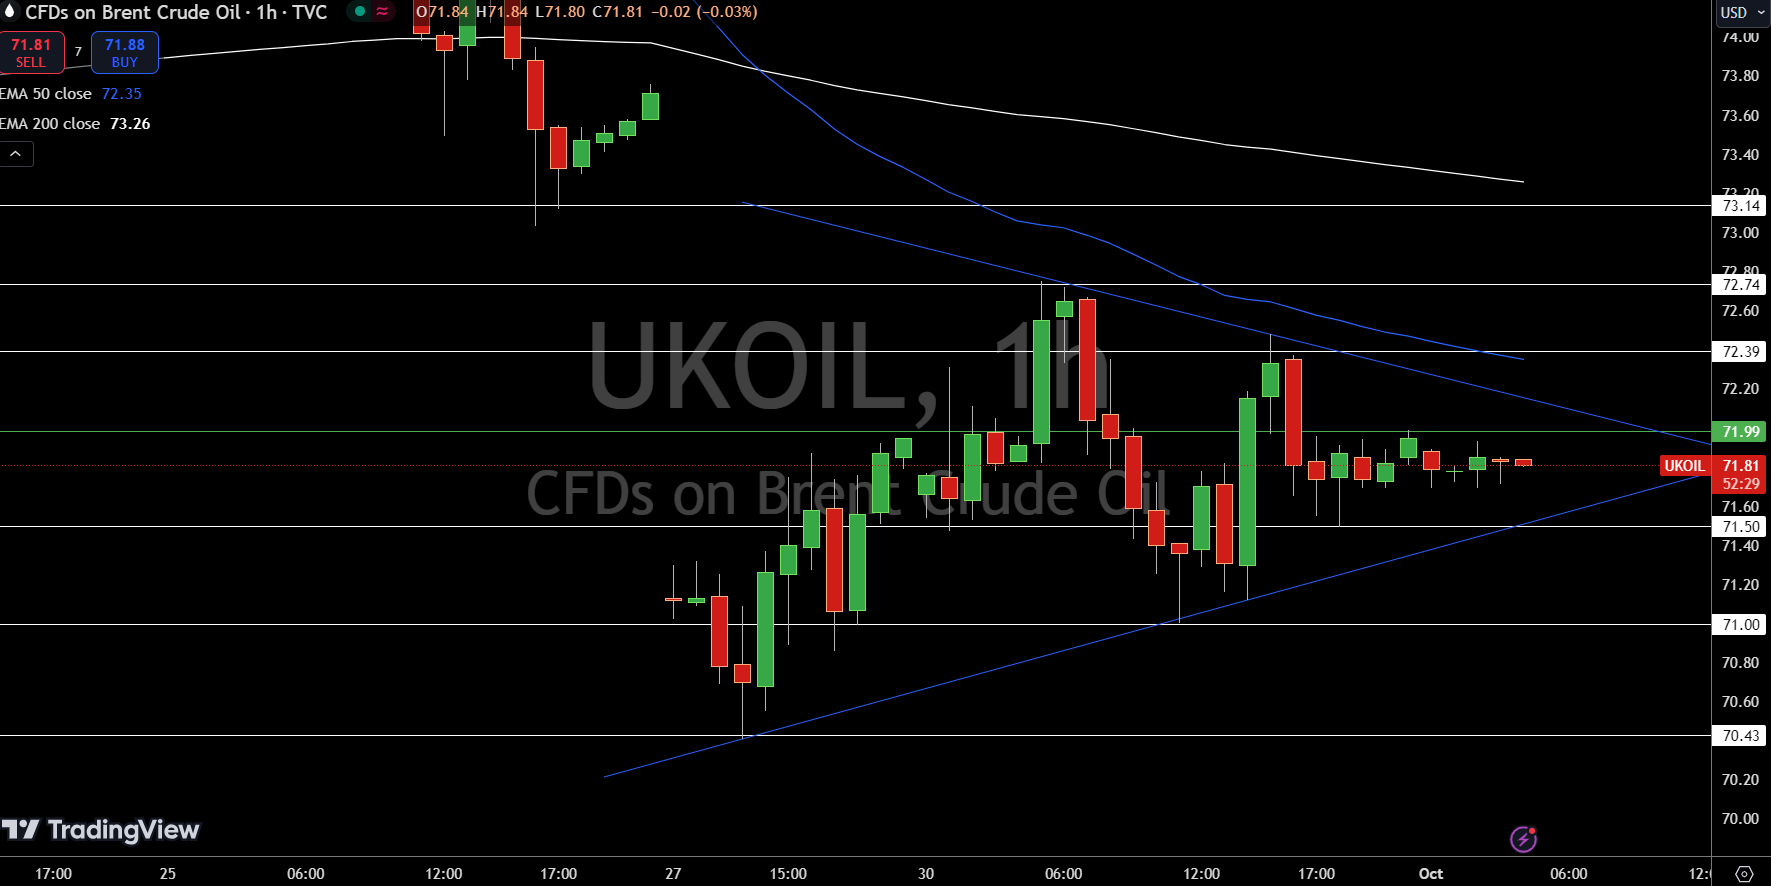
Immediate resistance stands at $72.39, aligning with the 50-day Exponential Moving Average (EMA) at $72.35. A push above these levels would signal renewed bullish momentum, targeting the next resistance at $72.74.
However, if prices slip below the immediate support at $71.50, it could open the door for a decline toward $71.00 and even $70.43.
The market is showing signs of indecision, forming a symmetrical triangle pattern, meaning traders are waiting for a clearer breakout direction before committing to a trend.
About the Author
Bob MasonChief Crypto Boss
TEST 30 He has written extensively for a broader audience and his current focus is on developments relating to the financial markets including, but not limited to currencies, commodities, alternative asset classes, and global equities.
Latest news and analysis


Advertisement