
Advertisement
Advertisement
BTC Price Forecast: Bitcoin Teeters at $60K Support Ahead of Key US Jobs Data
By:
Key Points:
- Bitcoin tests $60K support as ETF outflows rise, with $242.6 million in net outflows disrupting BTC demand.
- Middle East tensions and shifting Fed rate expectations continue to pressure BTC, threatening further downside below $60K.
- Stronger US labor market data dampens hopes for a 50-basis point Fed rate cut, possibly reducing risk appetite for BTC and ETFs.

In this article:
Bitcoin Tests $60,000 Support
On Wednesday, October 2, BTC slipped by 0.33%, following a 3.93% slide on Tuesday, closing at $60,671. Notably, BTC dropped to a session low of $60,030, testing crucial buyer demand at the crucial $60,000 level. The broader crypto market saw the total crypto market cap decline by 1.17% to $2.065 trillion.
US BTC-Spot ETF Market: Eight-Day Inflow Streak Ends – What’s Next?
On Tuesday, October 1, the US BTC-spot ETF market saw net outflows of $242.6 million, ending an eight-day inflow streak. BlackRock’s (BLK) iShares Bitcoin Trust (IBIT) was the only ETF to record inflows on that day.
On Wednesday, October 2, the US BTC-spot ETF market remains dependent on IBIT to offset outflows from other issuers to tilt the supply-demand balance in BTC’s favor. According to Farside Investors,
- On Wednesday, ARK 21Shares Bitcoin ETF (ARKB) recorded net outflows of $60.3 million.
- Fidelity Wise Origin Bitcoin Fund (FBTC) had net inflows of $21.1 million.
- Grayscale Bitcoin Trust (GBTC) reported zero net flows.
Excluding IBIT and Bitwise Bitcoin ETF (BITB) flows, the US BTC-spot ETF market saw net outflows of $39.2 million. Market sentiment toward the Fed rate path and the Middle East conflict continued to test demand for US BTC-spot ETFs.
US Labor Market Data Challenges Aggressive Fed Rate Cut Expectations
On Wednesday, the ADP reported a 143k increase in employment in September, up from 103k in August. The upward trend in employment boosted expectations of a soft US economic landing. However, the labor market data also tempered investor bets on a 50-basis point November Fed rate cut, affecting the appetite for riskier assets.
According to the CME FedWatch Tool, the probability of a 50-basis point November Fed rate cut fell from 36.8% (October 1) to 34.6% (October 2).
While the ADP report influenced sentiment toward the Fed rate path, Friday’s official US Jobs Report could be crucial. Upbeat labor market data could cement bets on a smaller 25-basis point November Fed rate cut. A higher-for-longer Fed rate path would leave yields elevated, possibly impacting buyer demand for riskier assets.
Middle East Conflict in Focus
Meanwhile, concerns about a possible escalation in the Middle East conflict remained a BTC headwind. A further escalation could send BTC below $60,000.
The US equity markets saw modest gains on Wednesday, with the Middle East and the US labor market in focus. On Wednesday, the Nasdaq Composite Index advanced by 0.04%.
US Economic Calendar and BTC Price Impact
US initial jobless claims and the ISM Services PMI on October 3 may impact buyer demand for US BTC-spot ETFs. A larger-than-expected increase in jobless claims and softer service sector activity could refuel speculation about a 50-basis point Fed rate cut. Expectations of a more dovish rate path may drive BTC toward $65,000.
However, a spike in US jobless claims and an ISM Services PMI drop below 50.0 could reignite fears of a hard US landing, potentially sending BTC toward $55,000.
Investors should remain alert to crucial US economic indicators and updates from the Middle East. Traders may also want to monitor ETF inflows closely in the coming days as they could impact short-term demand for BTC and the broader market. Stay updated with our latest news and analysis to manage your BTC and crypto exposures.
Technical Analysis
Bitcoin Analysis
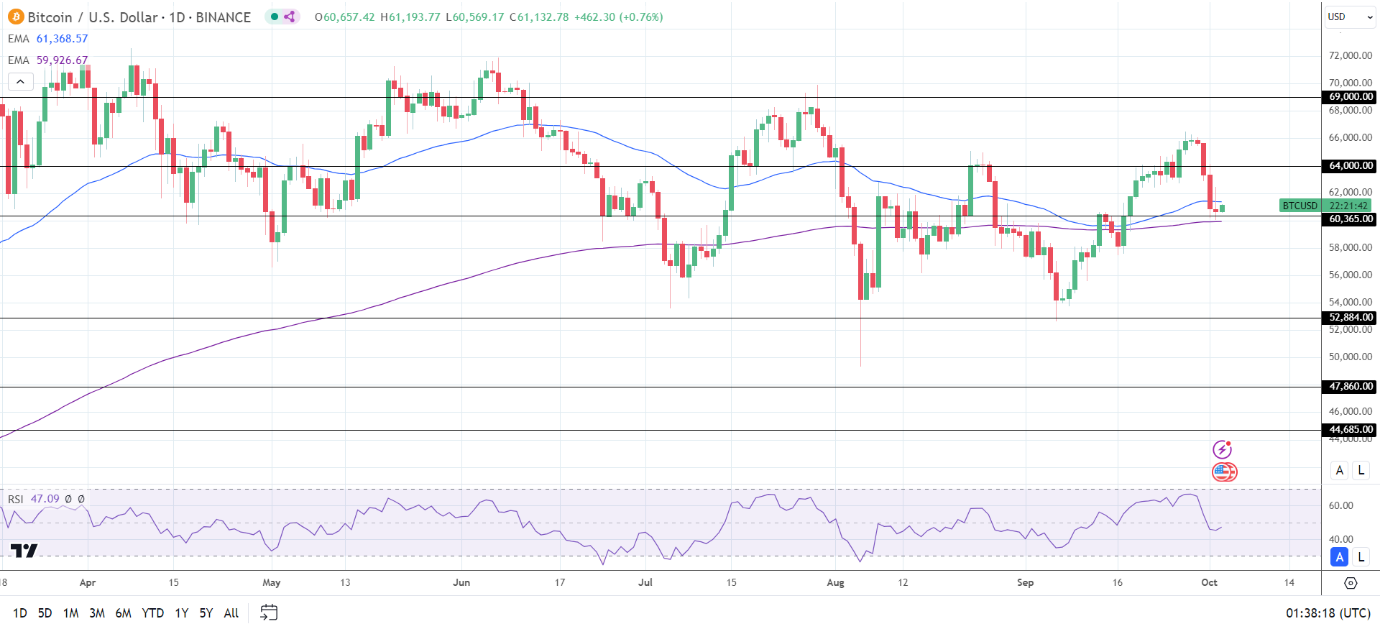
BTC remains below the 50-day EMA while hovering above the 200-day EMA, affirming bearish near-term but bullish longer-term price signals.
Will Bitcoin avoid sub-$60,000? Here’s what to watch.
A breakout from the 50-day EMA could signal a move toward the $64,000 resistance level and $65,000 level. Furthermore, a return to $65,000 may bring the September 27 high of $66,520 into play.
Investors should consider the US economic calendar, news from the Middle East, and US BTC-spot ETF market flows.
Conversely, a break below the $60,365 support level and the 200-day EMA could signal a drop toward $57,500. A fall through $57,500 could give the bears a run at $55,000.
With a 47.09 14-day RSI reading, BTC may fall to $55,000 before entering oversold territory.
Ethereum Analysis
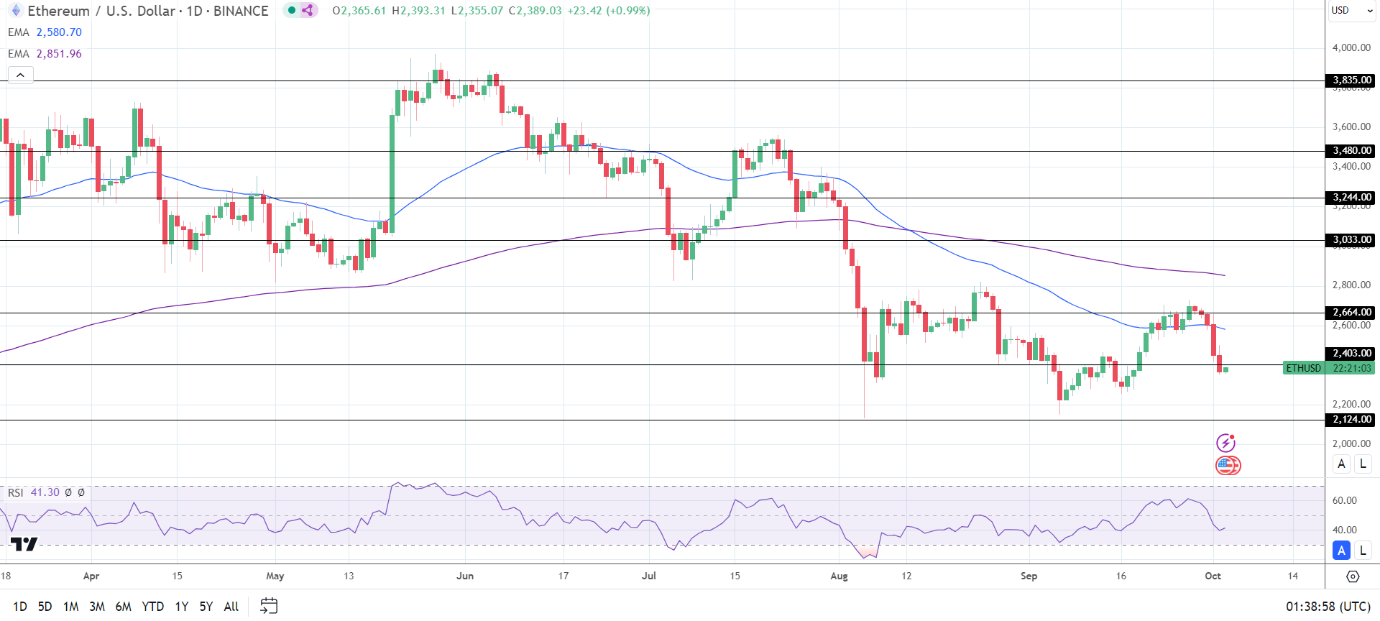
ETH remains well below the 50-day and 200-day EMAs, affirming bearish price signals.
An ETH break above the $2,403 resistance level would support a move toward the 50-day EMA. Furthermore, a breakout from the 50-day EMA could bring the $2,664 resistance level into play.
US ETH-spot ETF market-related updates also require consideration.
Conversely, an ETH break below $2,250 could give the bears a run at the $2,124 support level.
The 14-period Daily RSI reading, 41.30, suggests an ETH fall to the $2,124 support level before entering oversold territory.
About the Author
Bob MasonChief Crypto Boss
TEST 30 He has written extensively for a broader audience and his current focus is on developments relating to the financial markets including, but not limited to currencies, commodities, alternative asset classes, and global equities.
Latest news and analysis


Advertisement