
Advertisement
Advertisement
Crude Oil Price Forecast: Bearish Reversal, Downside Risk Intensifies
By:
Crude oil’s bearish reversal suggests deeper downside risks, with potential targets near $63.67 and $60.43, following the breakdown of a large symmetrical triangle pattern.
In this article:
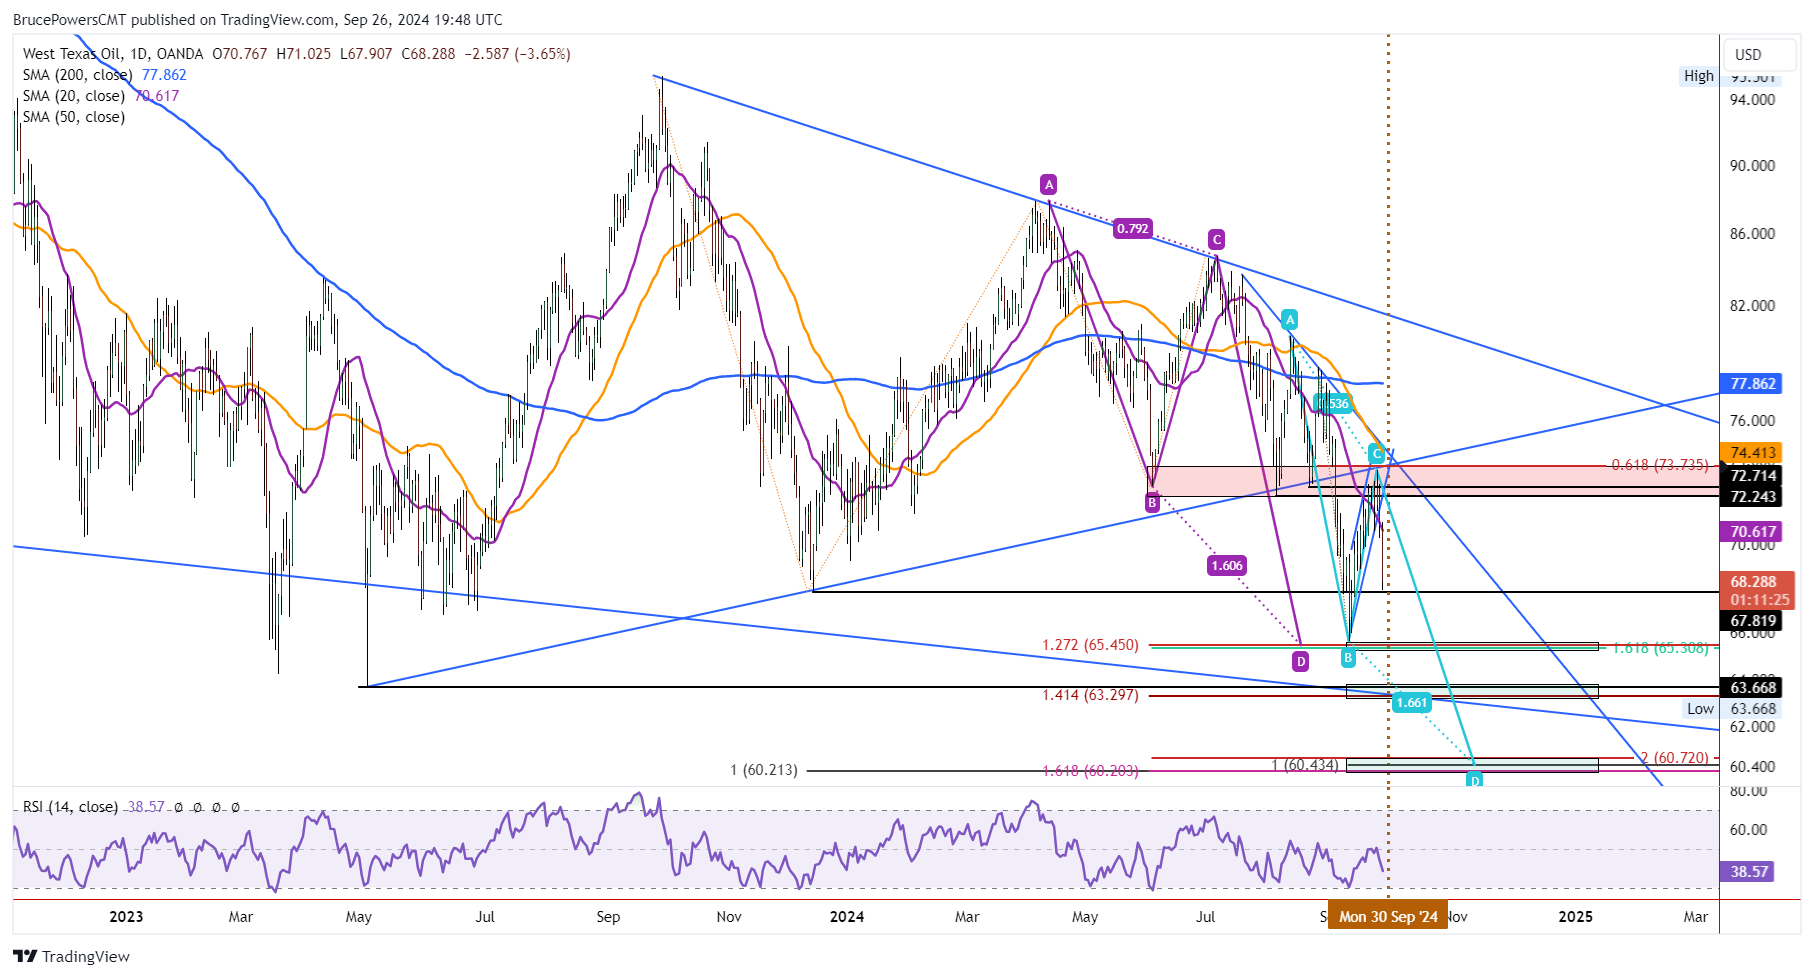
Crude oil looks to have completed a counter-trend rally for the decline on Tuesday with a high of 73.52. The advance was just shy of hitting a 61.8% retracement at 73.74, which marks the top of a previously identified potential resistance zone. Subsequently a bearish reversal triggered yesterday, with downside follow-through seen today. The counter-trend advance produced a bearish flag pattern that triggered to the downside on a break of a small trendline.
Weakness was further confirmed on a decline below the 20-Day MA. It had been marking potential support for several days previously. Today’s decline is decisive and will likely leave a wide range red candle with a close near the lows of the day. At the time of this writing, crude oil continues to trade in the lower third of the day’s trading range.
Rejection from Resistance Turns Crude Back Down
So far crude oil is acting as anticipated following the breakdown of a large symmetrical triangle pattern that triggered three weeks ago. It is typical for a breakdown to eventually be followed by rally back to test prior support zones. Recent behavior of crude oil is a textbook example of this dynamic.
The most recent swing low and 16-month low in crude at 65.65 was likely just the first stop in a larger decline as the initial target derived from measuring the triangle points to 43.66. Whether it is reached or not, it highlights increased downside risk.
Lower Support Levels to Watch
Following this week’s lower swing high, a new descending ABCD pattern has been added to the chart. The initial downside target from the pattern points to 60.43. That further strengthens the significance of a confluence zone from around 60.72 to 60.20. If reached, it would be the lowest traded price for crude oil since April 2021.
Nonetheless, there is a higher price level to watch for support first around the next lower potential support zone from current levels at 63.67. Notice that 63.67 begins the lower boundary line of the symmetrical triangle and is the lower point of the pattern. A drop below it would further confirm the bearish implications of the triangle breakdown.
For a look at all of today’s economic events, check out our economic calendar.
About the Author
Bruce Powerscontributor
Bruce has been involved in the financial markets for over 20 years, as an analyst, trader, educator, and writer.
Latest news and analysis


Advertisement