
Advertisement
Advertisement
Dogecoin (DOGE) Eyes Bullish Reversal as ETF Optimism Fuels Momentum
By:
Key Points:
- DOGE forms a rounded bottom, signaling potential bullish reversal
- Elliott Wave count suggests wave B recovery after corrective phase
- Key resistance at $0.2877 (0.5 Fibonacci) for confirmation

Dogecoin (DOGE) is experiencing renewed bullish momentum following the SEC’s acceptance of Grayscale’s application for a DOGE ETF. This news has generated optimism around institutional adoption, propelling DOGE towards key technical resistance levels.
The price action suggests that DOGE may be forming a bullish reversal structure, potentially signaling the start of a new upward trend. Using Elliott Wave Theory and Fibonacci retracements, we analyze DOGE’s current position and outline potential price trajectories.
SEC Accepts Grayscale’s DOGE ETF Application
Dogecoin (DOGE) has gained fresh bullish momentum following the U.S. Securities and Exchange Commission’s (SEC) acceptance of Grayscale’s application to launch a DOGE exchange-traded fund (ETF).
This marks a major step toward institutional adoption of the meme-based cryptocurrency, which has historically been driven by retail speculation. While the acceptance does not guarantee final approval, it indicates a growing willingness from regulators to consider a broader range of crypto assets for structured investment vehicles.
If the ETF is approved, it could lead to increased liquidity, mainstream adoption, and a potential rerating of DOGE’s market position. Traders and investors are now closely monitoring price action, as DOGE attempts to break key resistance levels amid heightened speculation.
DOGE Price Analysis
The 4-hour chart highlights DOGE’s recovery from an extended corrective phase. After completing a five-wave impulsive structure, DOGE entered an ABC corrective phase, with wave C bottoming around $0.20, aligning with the 0.786 Fibonacci retracement. This level provided strong support, initiating the current bounce.

The price is currently trading around $0.27, testing the 0.5 Fibonacci retracement level at $0.287. A decisive close above this resistance would confirm continued bullish momentum, potentially pushing DOGE towards $0.33 (0.382 Fibonacci retracement) and $0.39 (0.236 Fibonacci retracement).
The Relative Strength Index (RSI) on the 4-hour timeframe is showing bullish divergence, suggesting that momentum is shifting in favor of buyers. However, DOGE must maintain strength above $0.24 (0.618 Fibonacci retracement) to avoid invalidating the bullish structure. A failure to hold above this level could result in a retest of $0.17 before any further upside materializes.
Overall, the price action suggests that DOGE has room for further recovery, but a breakout above $0.287 is crucial for confirming sustained bullish momentum.
DOGE Price Prediction
The 1-hour chart provides a more detailed look at DOGE’s short-term trajectory. The chart reveals a cup and handle formation, a classic reversal signal that suggests DOGE is gearing up for an upward move. The neckline of this formation is around $0.30, closely aligning with the 0.5 Fibonacci retracement level. A confirmed breakout above this level could propel DOGE towards $0.33 (0.382 Fibonacci retracement) and $0.39 (0.236 Fibonacci retracement).
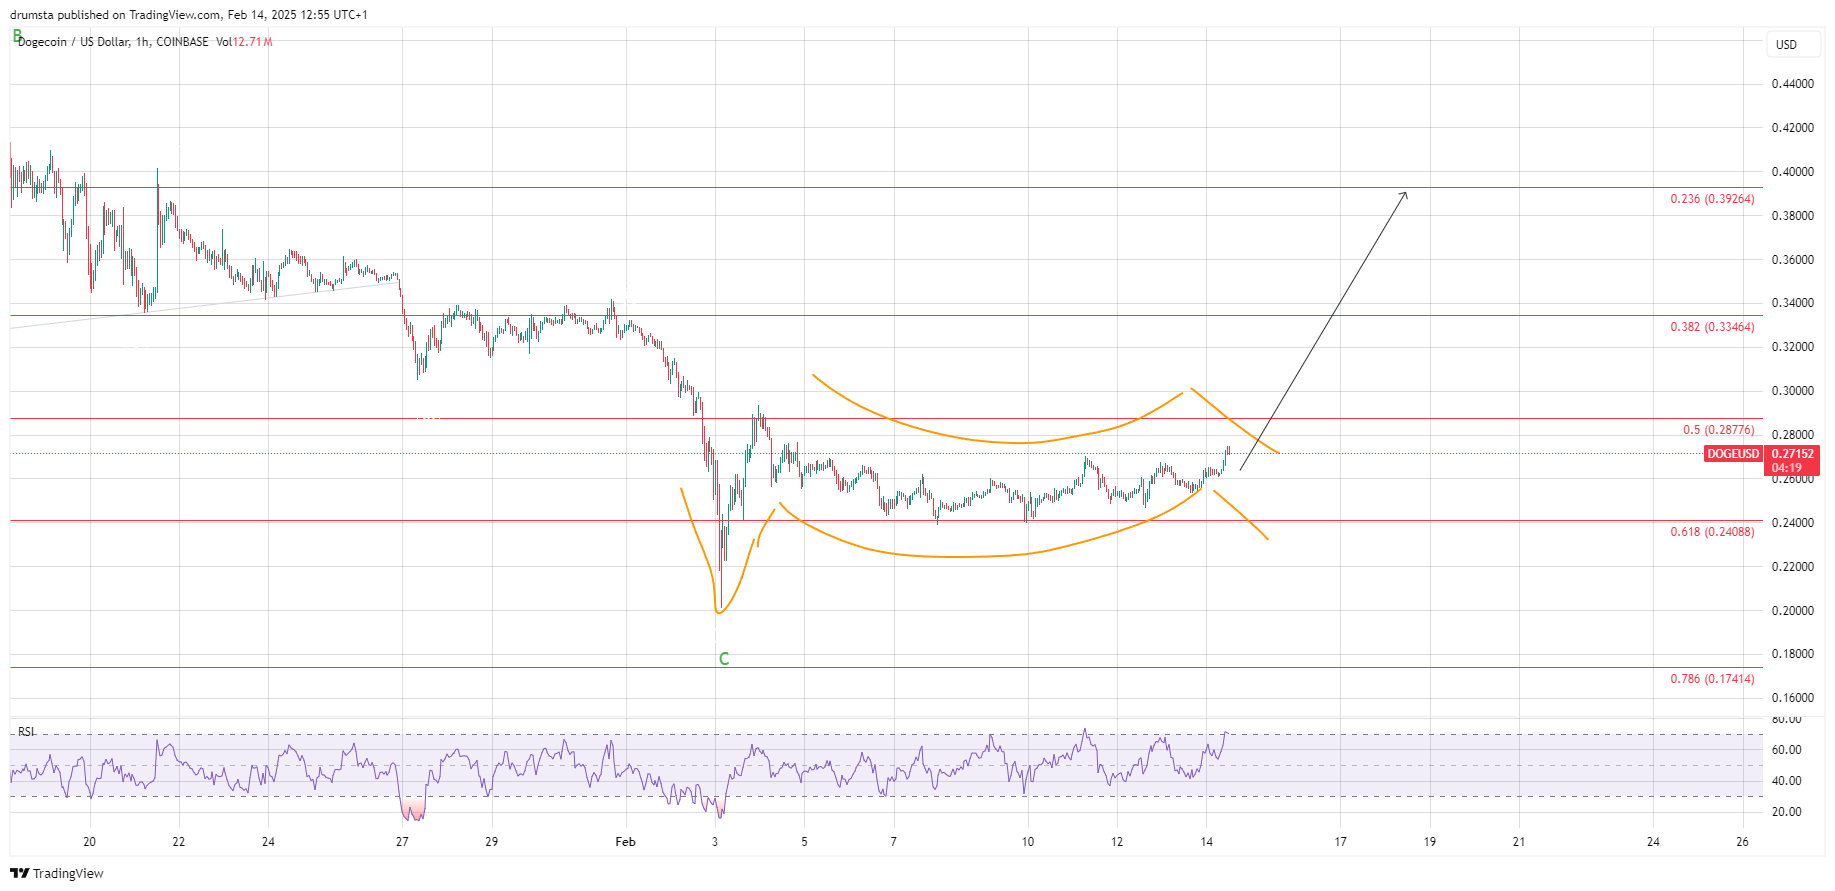
Additionally, Fibonacci retracement levels suggest that if the breakout gains momentum, the price could extend towards $0.39 (0.236 Fibonacci). However, a rejection at $0.287 could trigger a temporary pullback towards $0.24, where the 0.618 retracement offers a strong support zone.
The RSI on the 1-hour chart is trending higher, indicating increasing buying pressure. However, traders should be cautious of overbought conditions, as a short-term retracement may occur before a sustained rally. If the rounded bottom pattern plays out successfully, DOGE could be entering a new bullish phase, potentially retesting higher resistance levels seen in late 2024.
Key Levels to Watch
- Immediate Resistance: $0.287 (0.5 Fibonacci retracement)
- Key Resistance: $0.334 (0.382 Fibonacci retracement)
- Major Resistance: $0.39 (0.236 Fibonacci retracement)
- Immediate Support: $0.2408 (0.618 Fibonacci retracement)
- Key Support: $0.1741 (0.786 Fibonacci retracement)
- Critical Support: $0.0891 (1.0 Fibonacci retracement, cycle low)
About the Author
Bob MasonChief Crypto Boss
TEST 30 He has written extensively for a broader audience and his current focus is on developments relating to the financial markets including, but not limited to currencies, commodities, alternative asset classes, and global equities.
Latest news and analysis


Advertisement