
Advertisement
Advertisement
Natural Gas Price Forecast: Tests Resistance – Will the Rally Continue?
By:
Natural gas maintains strength near recent highs. Resistance at $3.83 and support around $3.53–$3.56 could dictate the next move in the ongoing uptrend.
Natural gas reached a new near-term trend high of $3.80 on Friday before pulling back slightly. That high put it closer to the next identified resistance zone that looks to be around $3.83. That price level includes the completion of the 61.8% Fibonacci retracement, and it is also a weekly high from two weeks ago. It looks likely that this week will end with natural gas in a relatively strong position, in the top third of the week’s trading range.
Whether bullish momentum can be sustained into the next week, leading to a breakout above $3.80, remains to be seen. Alternatively, a pullback and consolidation within the weekly range from two weeks ago could also play out.
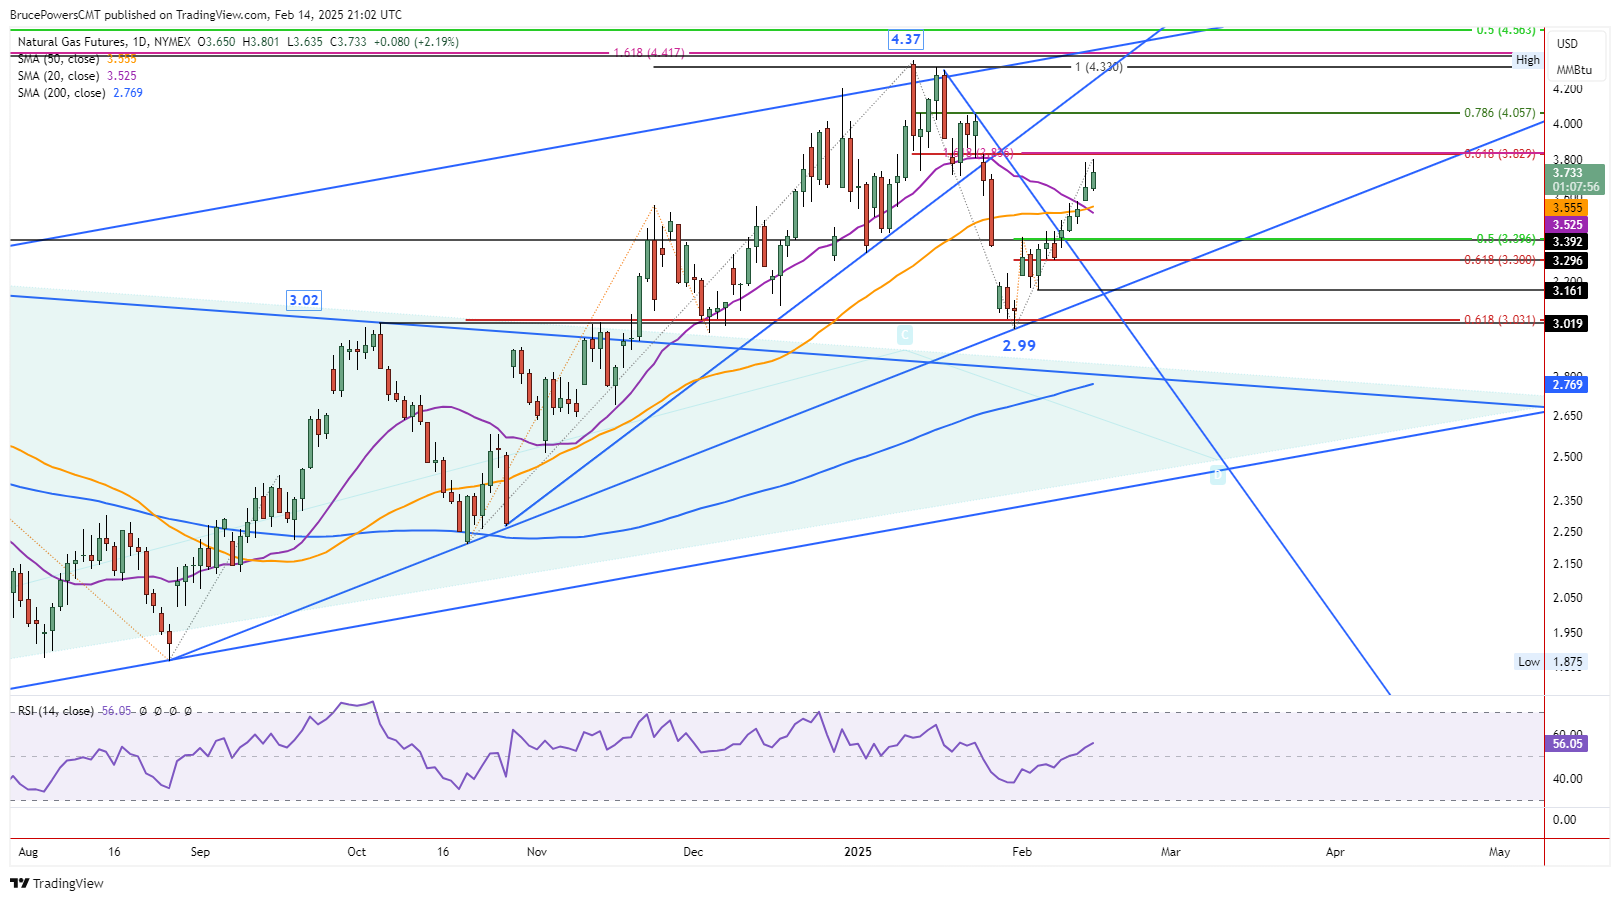
Further Weakness Likely Below $3.64
Further weakness towards lower potential support levels may follow a drop below today’s low of $3.64. Potential support around the 20-Day and 50-Day MA, currently from $3.53 to $3.56 will likely be tested. Notice that the 20-Day line crossed below the 50-Day line today. That relationship should continue to provide clues going forward. Natural gas completed a $1.38 or 31.6% bearish correction at the $2.99 low two weeks ago. Given the subsequent $0.81 or 27% advance, as of today’s high, it wouldn’t be surprising to see a rest before it may be ready to proceed higher.
Lower Support
Other price levels to watch for support include the prior interim swing high at $3.39 from early January and this week’s low at $3.35. The $3.39 price level is confirmed by the 50% retracement of the recent advance, which is $3.40. Further down is the 61.8% Fibonacci retracement at $3.03. The $3.30 price level is also the two-week low. Notice that in both cases, there are two indicators pointing to the same of similar price area.
Long-term Bull Trend Remains Intact
In the bigger picture, long-term bullish signals triggered the last quarter of 2024. There was the breakout of a large symmetrical triangle pattern and a bullish reversal of the long-term downtrend. The expectation is for the bull trend starting from the low of $1.52 to eventually continue once the correction is complete.
Notice that the recent swing low that followed the $4.37, an almost two-year high, successfully found support around the initial bull breakout area of $3.02. The subsequent bullish reaction indicates the low was likely significant and it established a higher swing high for the price structure of the uptrend.
For a look at all of today’s economic events, check out our economic calendar.
About the Author
Bruce Powerscontributor
Bruce has been involved in the financial markets for over 20 years, as an analyst, trader, educator, and writer.
Latest news and analysis


Advertisement