
Advertisement
Advertisement
EUR/USD Elliott Wave Forecast: Completed Bullish Pattern
By:
Key Points:
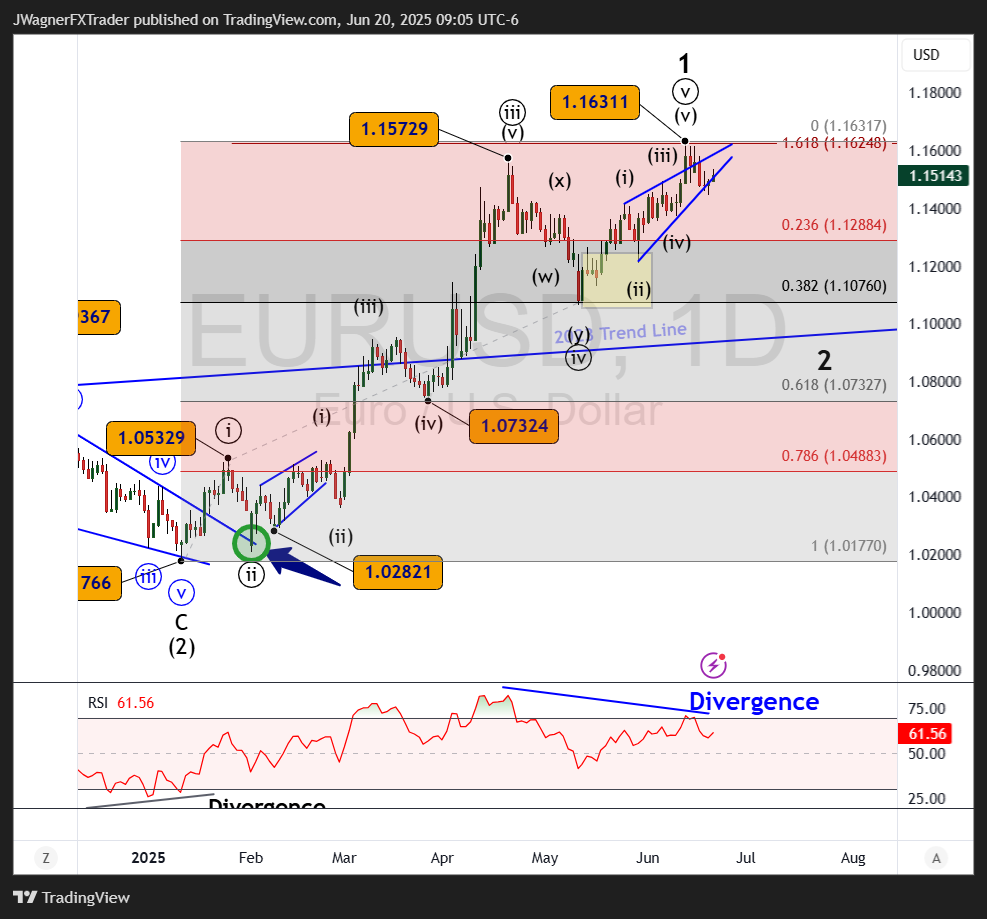
- EURUSD likely completed an ending diagonal pattern last week near 1.1631.
- The short-term trend now points downward.
- The next downside targets are 1.1065, and possibly 1.0733.

Current Elliott Wave Analysis
Starting from the May 12 low at 1.10649, EURUSD seems to have formed a diagonal pattern—shaped like a rising wedge. Based on where it appears within the larger trend from the January 13 low, this looks like an ending diagonal.
There’s a small chance it could be a leading diagonal, as wave (i) of ((v)) of 1, but the ending diagonal is more likely.
The rally since January 13 was fast and strong—one of the biggest year-start moves in recent memory. But now it looks tired and ready for a pullback.
A key sign of an ending diagonal is showing up in the RSI indicator. There is divergence between wave ((v)) and wave ((iii))—a typical feature of a top of a market reaching the end of the Elliott wave impulse pattern.
If this is indeed an ending diagonal, then the reversal may be sharp. A drop back to 1.1065 is expected as part of wave 2. Even lower levels near 1.0733 could follow in the next few months.
Bottom Line
EURUSD likely finished a medium-term top at 1.1631 with an ending diagonal. A move down to 1.1065 looks like the next step.
If EURUSD rallies above 1.1631, it may mean the diagonal was actually a leading diagonal—wave one of a larger five-wave move higher.
Key Level for Bearish Bias: 1.1631
Initial Target: 1.1065
Secondary Target: 1.0733
About the Author
Bob MasonChief Crypto Boss
123456789 30 He has written extensively for a broader audience and his current focus is on developments relating to the financial markets including, but not limited to currencies, commodities, alternative asset classes, and global equities.


Advertisement