
Advertisement
Advertisement
Gold Hits Record Levels as Market Uncertainty Rises; Silver Eyes $35
By:
Gold has reached new record levels above $3,000, while silver maintains strong bullish momentum below $35.

Gold (XAU) surged above $3,000 and hit a new record high of $3,038 on Tuesday. This surge occurred due to uncertainty over US President Donald Trump’s reciprocal tariffs set to take effect on April 2. However, traders are closely waiting for the Federal Reserve’s monetary policy decision, further creating market uncertainty and boosting gold prices.
Moreover, market sentiment remains weak despite talks between Trump and Russian President Vladimir Putin. Putin agreed to a 30-day halt on attacks on Ukrainian energy facilities, easing some trader concerns. However, gold continued its rally, climbing over 15% this year. Meanwhile, escalating tensions in the Middle East also fueled demand, as Israel’s airstrikes killed more than 400 people in Gaza, threatening a fragile two-month ceasefire.
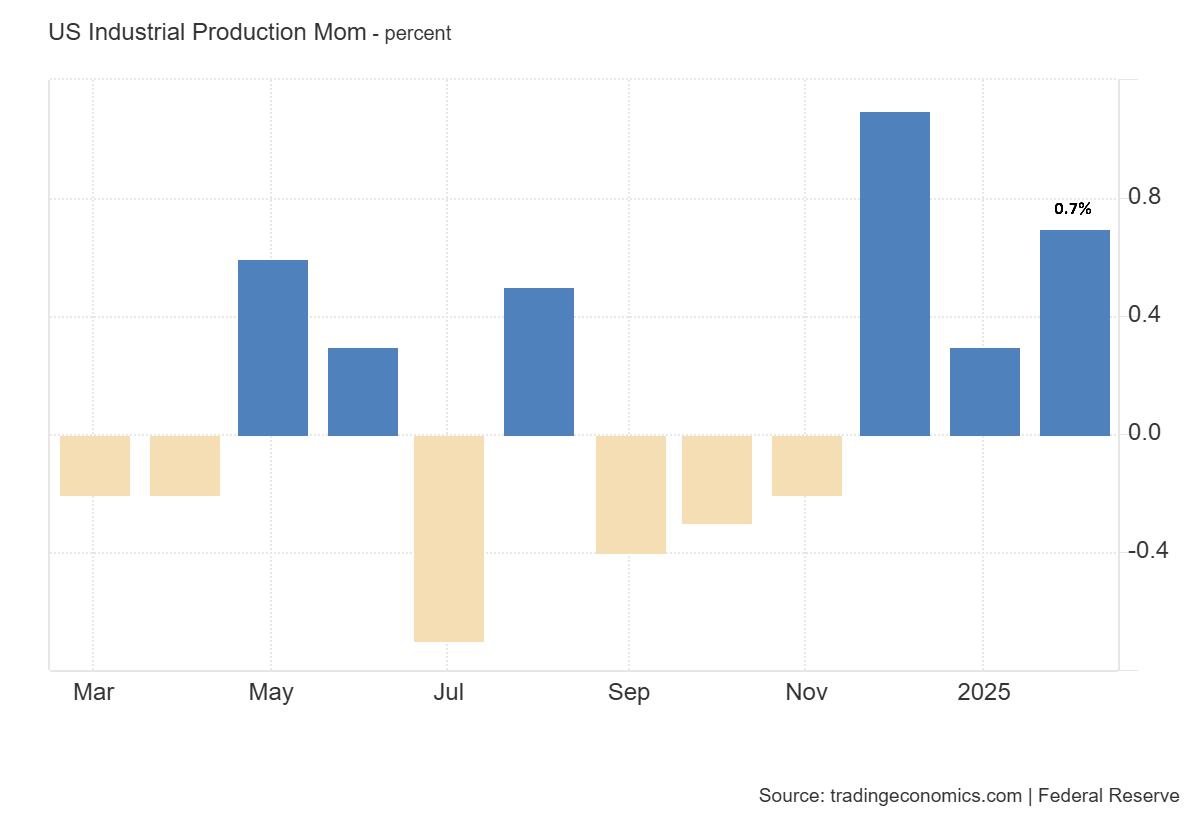
Silver (XAG) also showed strong bullish momentum, nearing the $35 level. Economic data revealed mixed signals, with US Industrial Production rising 0.7% in February, surpassing the 0.2% forecast, as shown in the chart below.
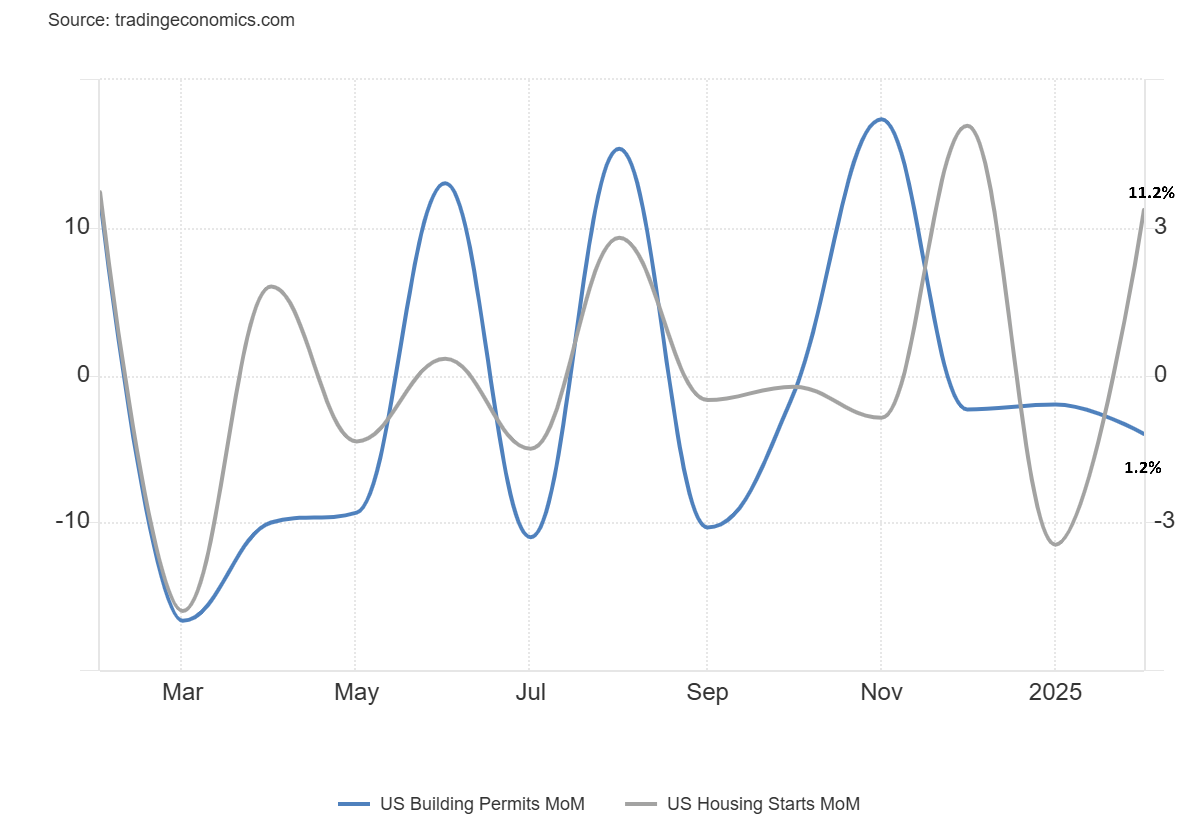
Meanwhile, housing data remained uncertain, as building permits fell by 1.2%, while housing started to surge by 11.2%, as shown in the chart below. Moreover, the decline in US Treasury yields and a weaker dollar supported gold prices. The US 10-year Treasury yield dropped to 4.183%, while the US Dollar Index fell to 103.23.
Gold (XAU) Technical Analysis
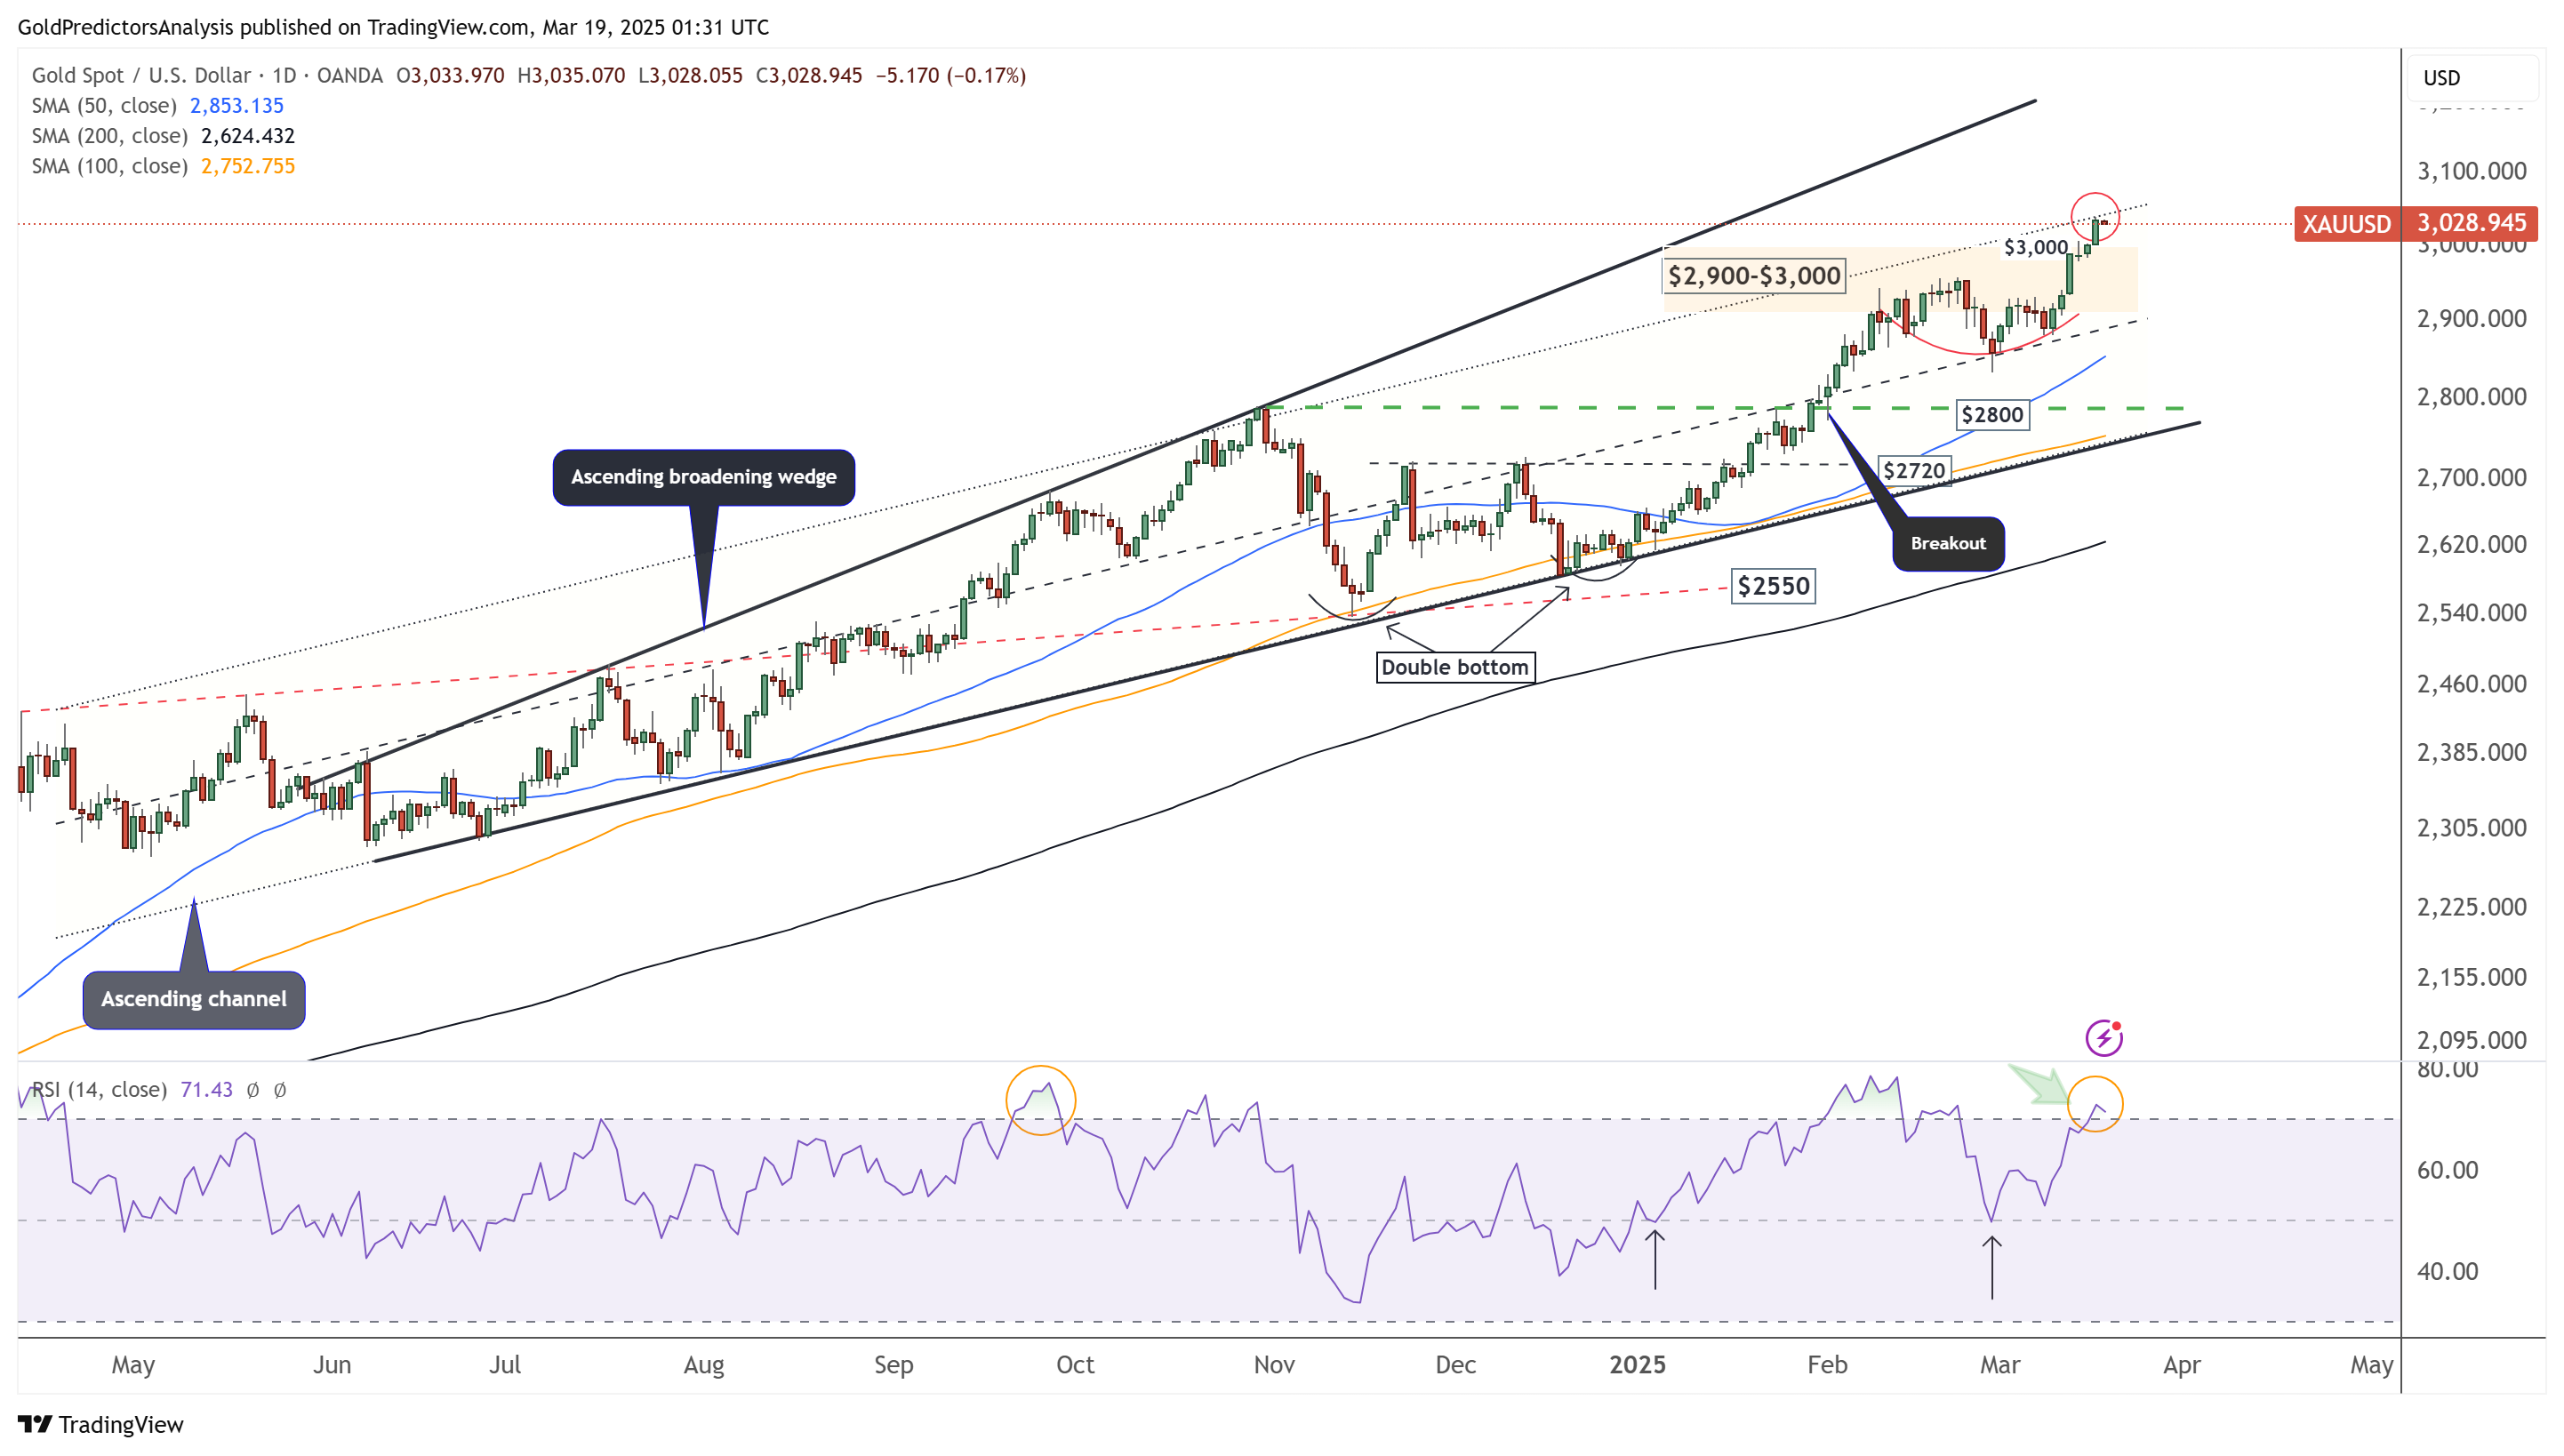
Gold Daily Chart – Target Zone
The daily chart for gold shows that the price has breached the $3,000 key level and hit the target zone of the ascending channel between $3,000 and $3,050. Despite overbought conditions, the market shows no weakness and indicates bullish price action. The rising 50 and 200 SMAs indicate bullish momentum. A weekly close above $3,000 will indicate continued bullish momentum toward $3,200. However, the key event of the week is the FOMC meeting minutes.
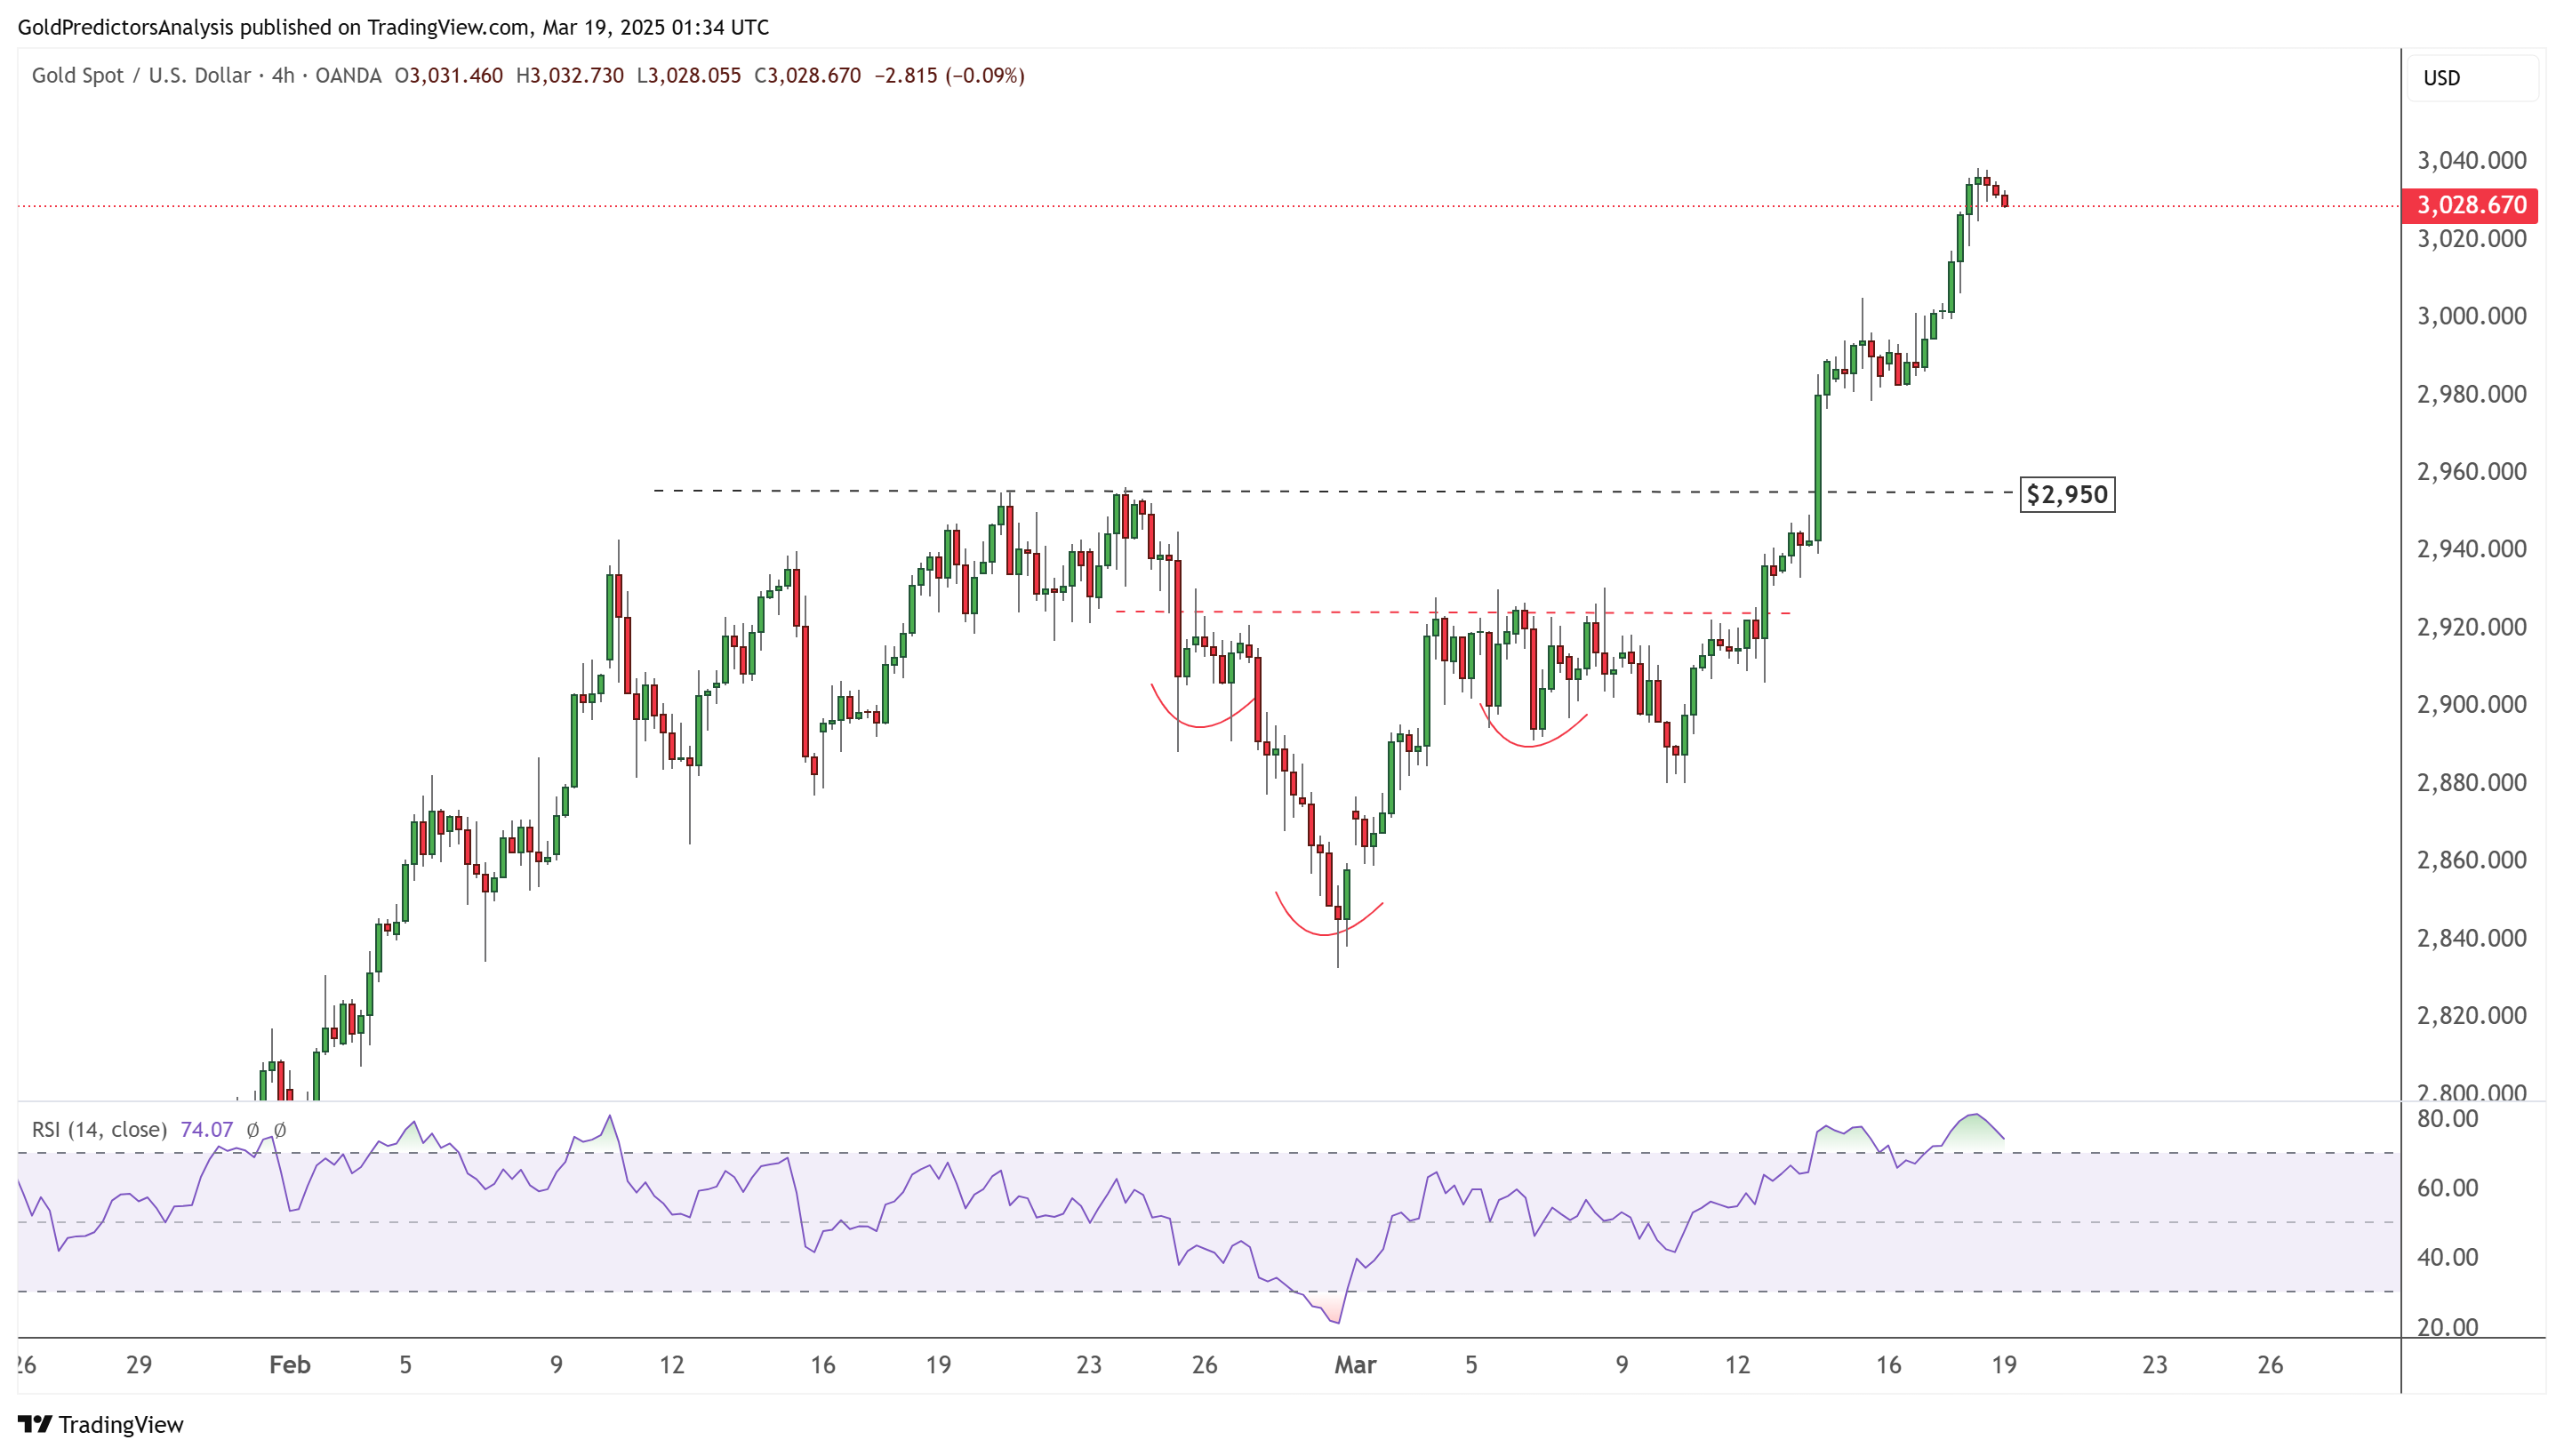
Gold 4-Hour Chart – Inverted Head and Shoulders
The 4-hour chart for gold shows that the breakout from the inverted head and shoulders has resulted in a price surge despite overbought levels seen on the RSI. The price is overextended in the short term and indicates a potential correction.
Silver (XAG) Technical Analysis
Silver Daily Chart – Positive Price Action
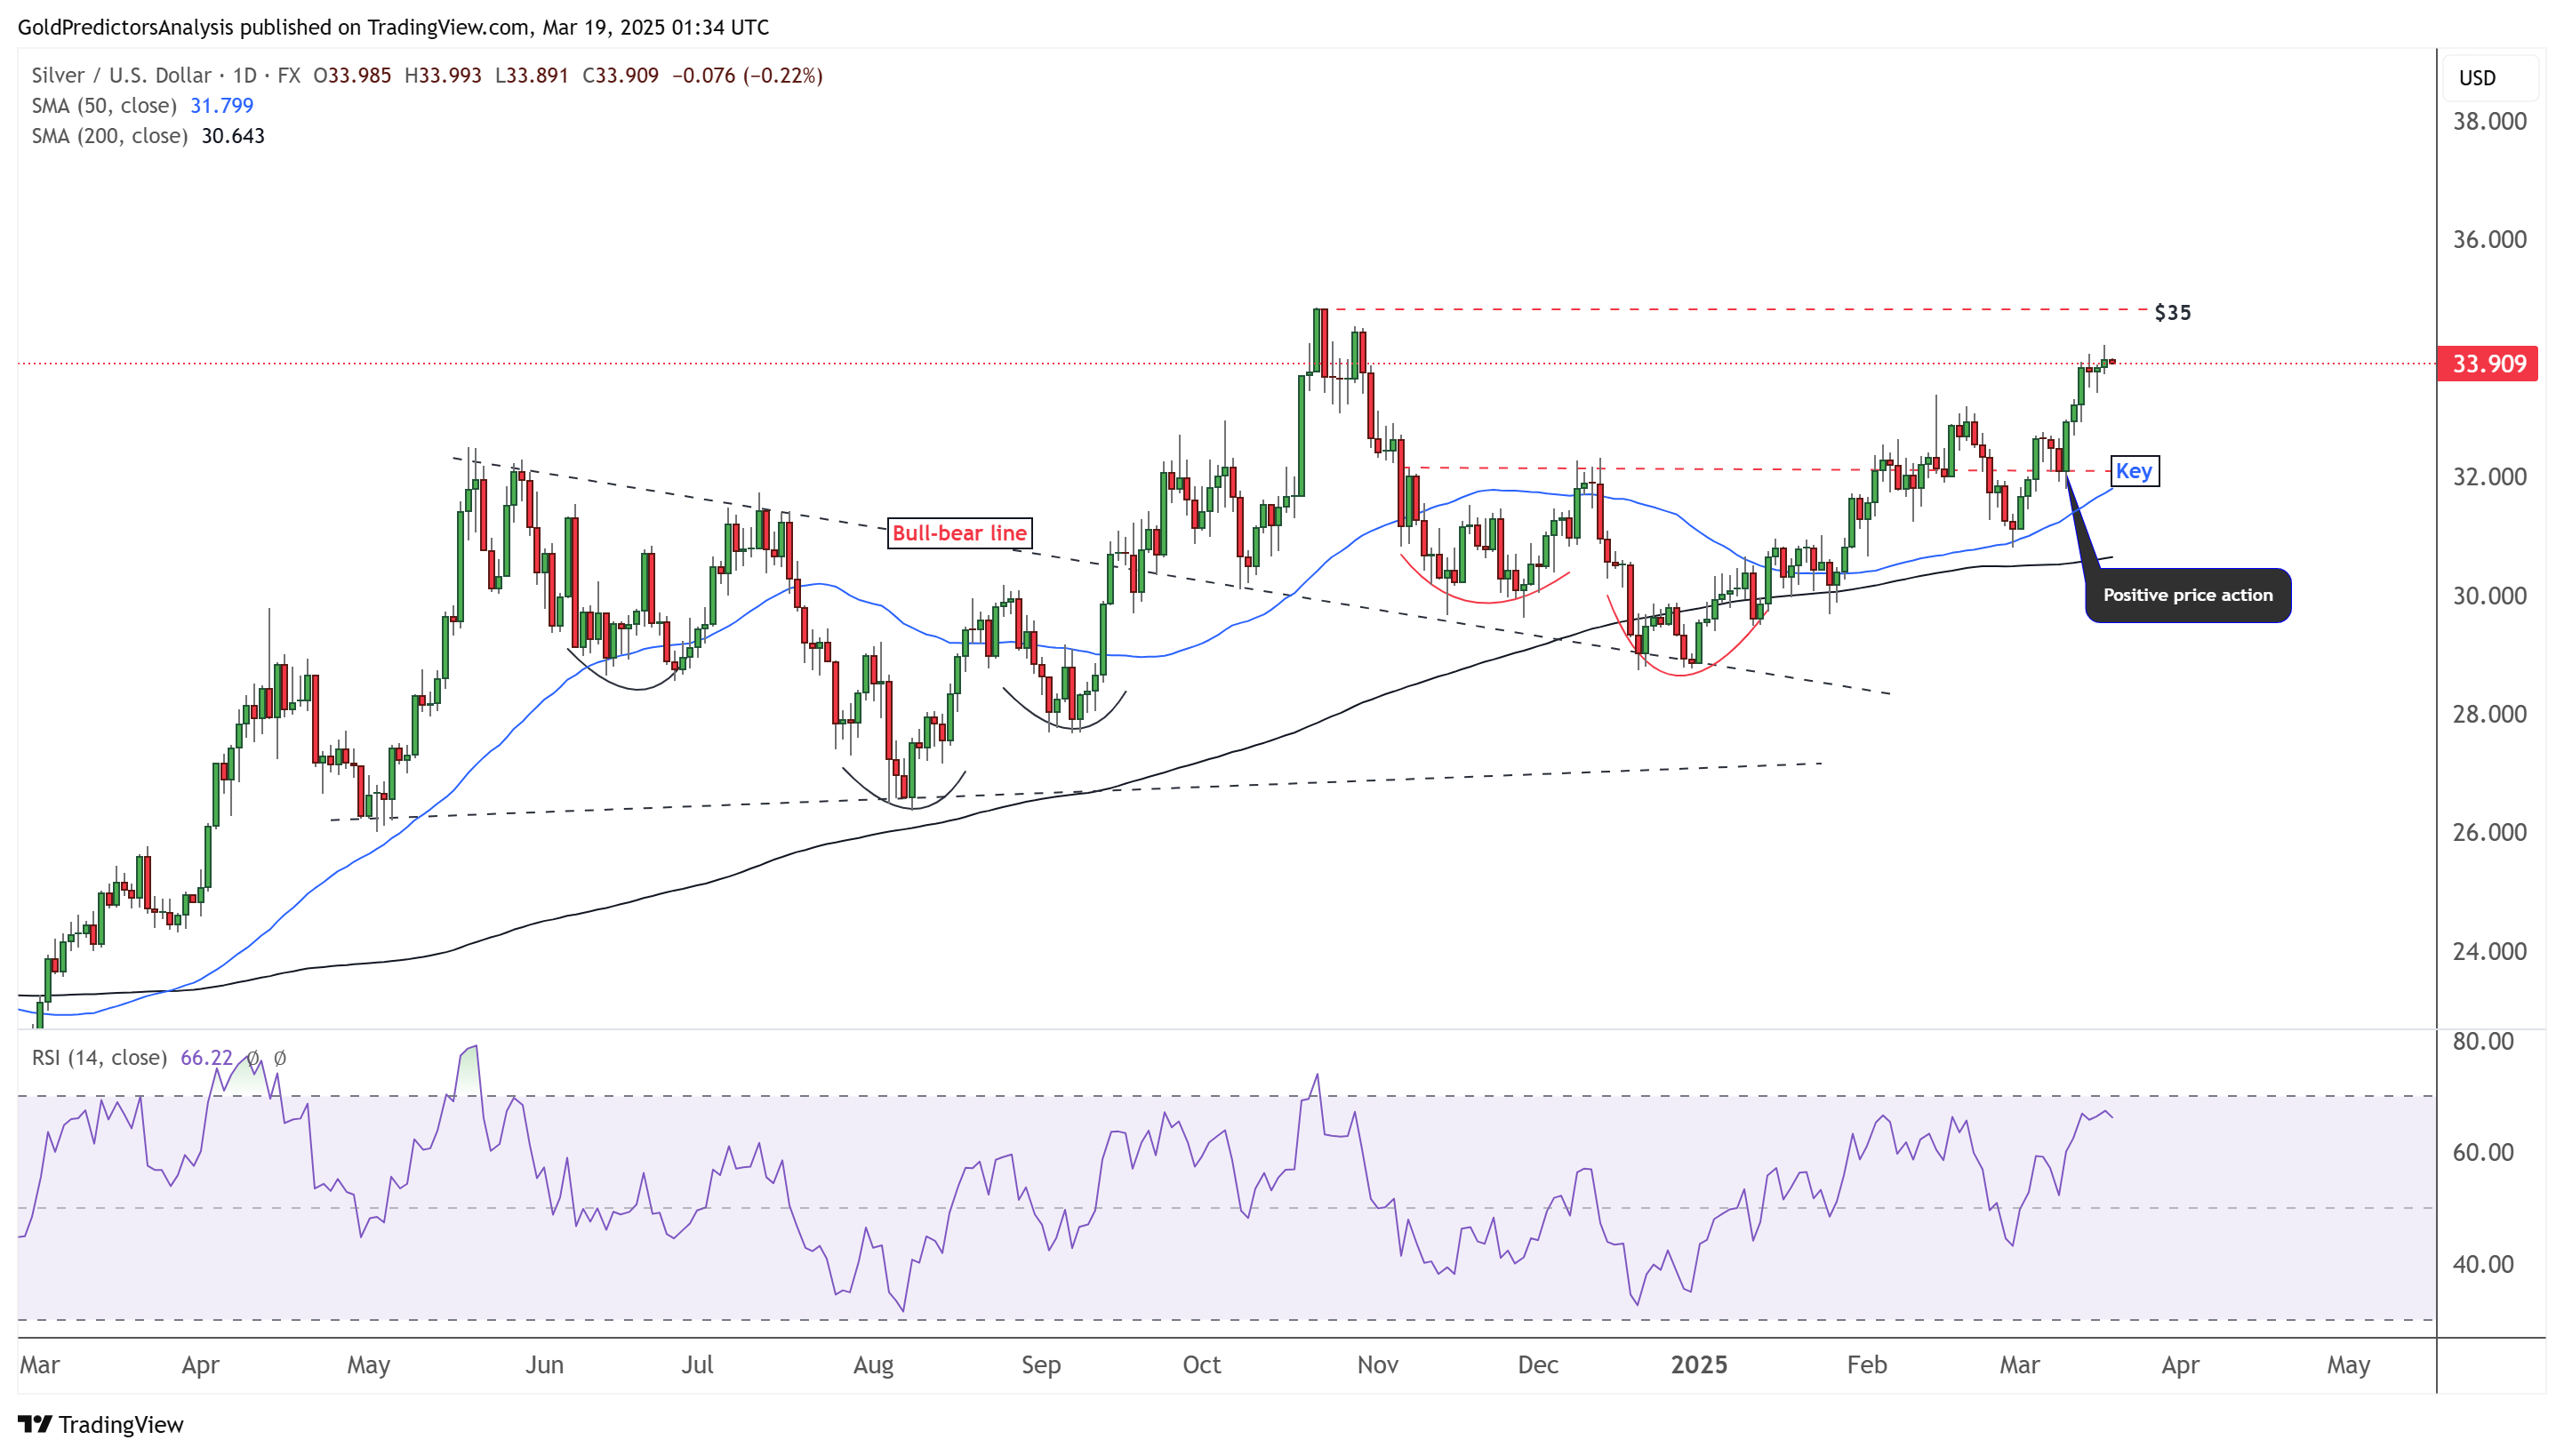
The daily chart for silver shows the formation of a bullish price structure as the price has broken the key level of $32.50. This breakout has initiated a strong upward move. The emergence of bullish price action at the bull-bear line and the breakout from the key level of $32.50 indicate a move toward $35.
Silver 4-Hour Chart – Ascending Broadening Wedge
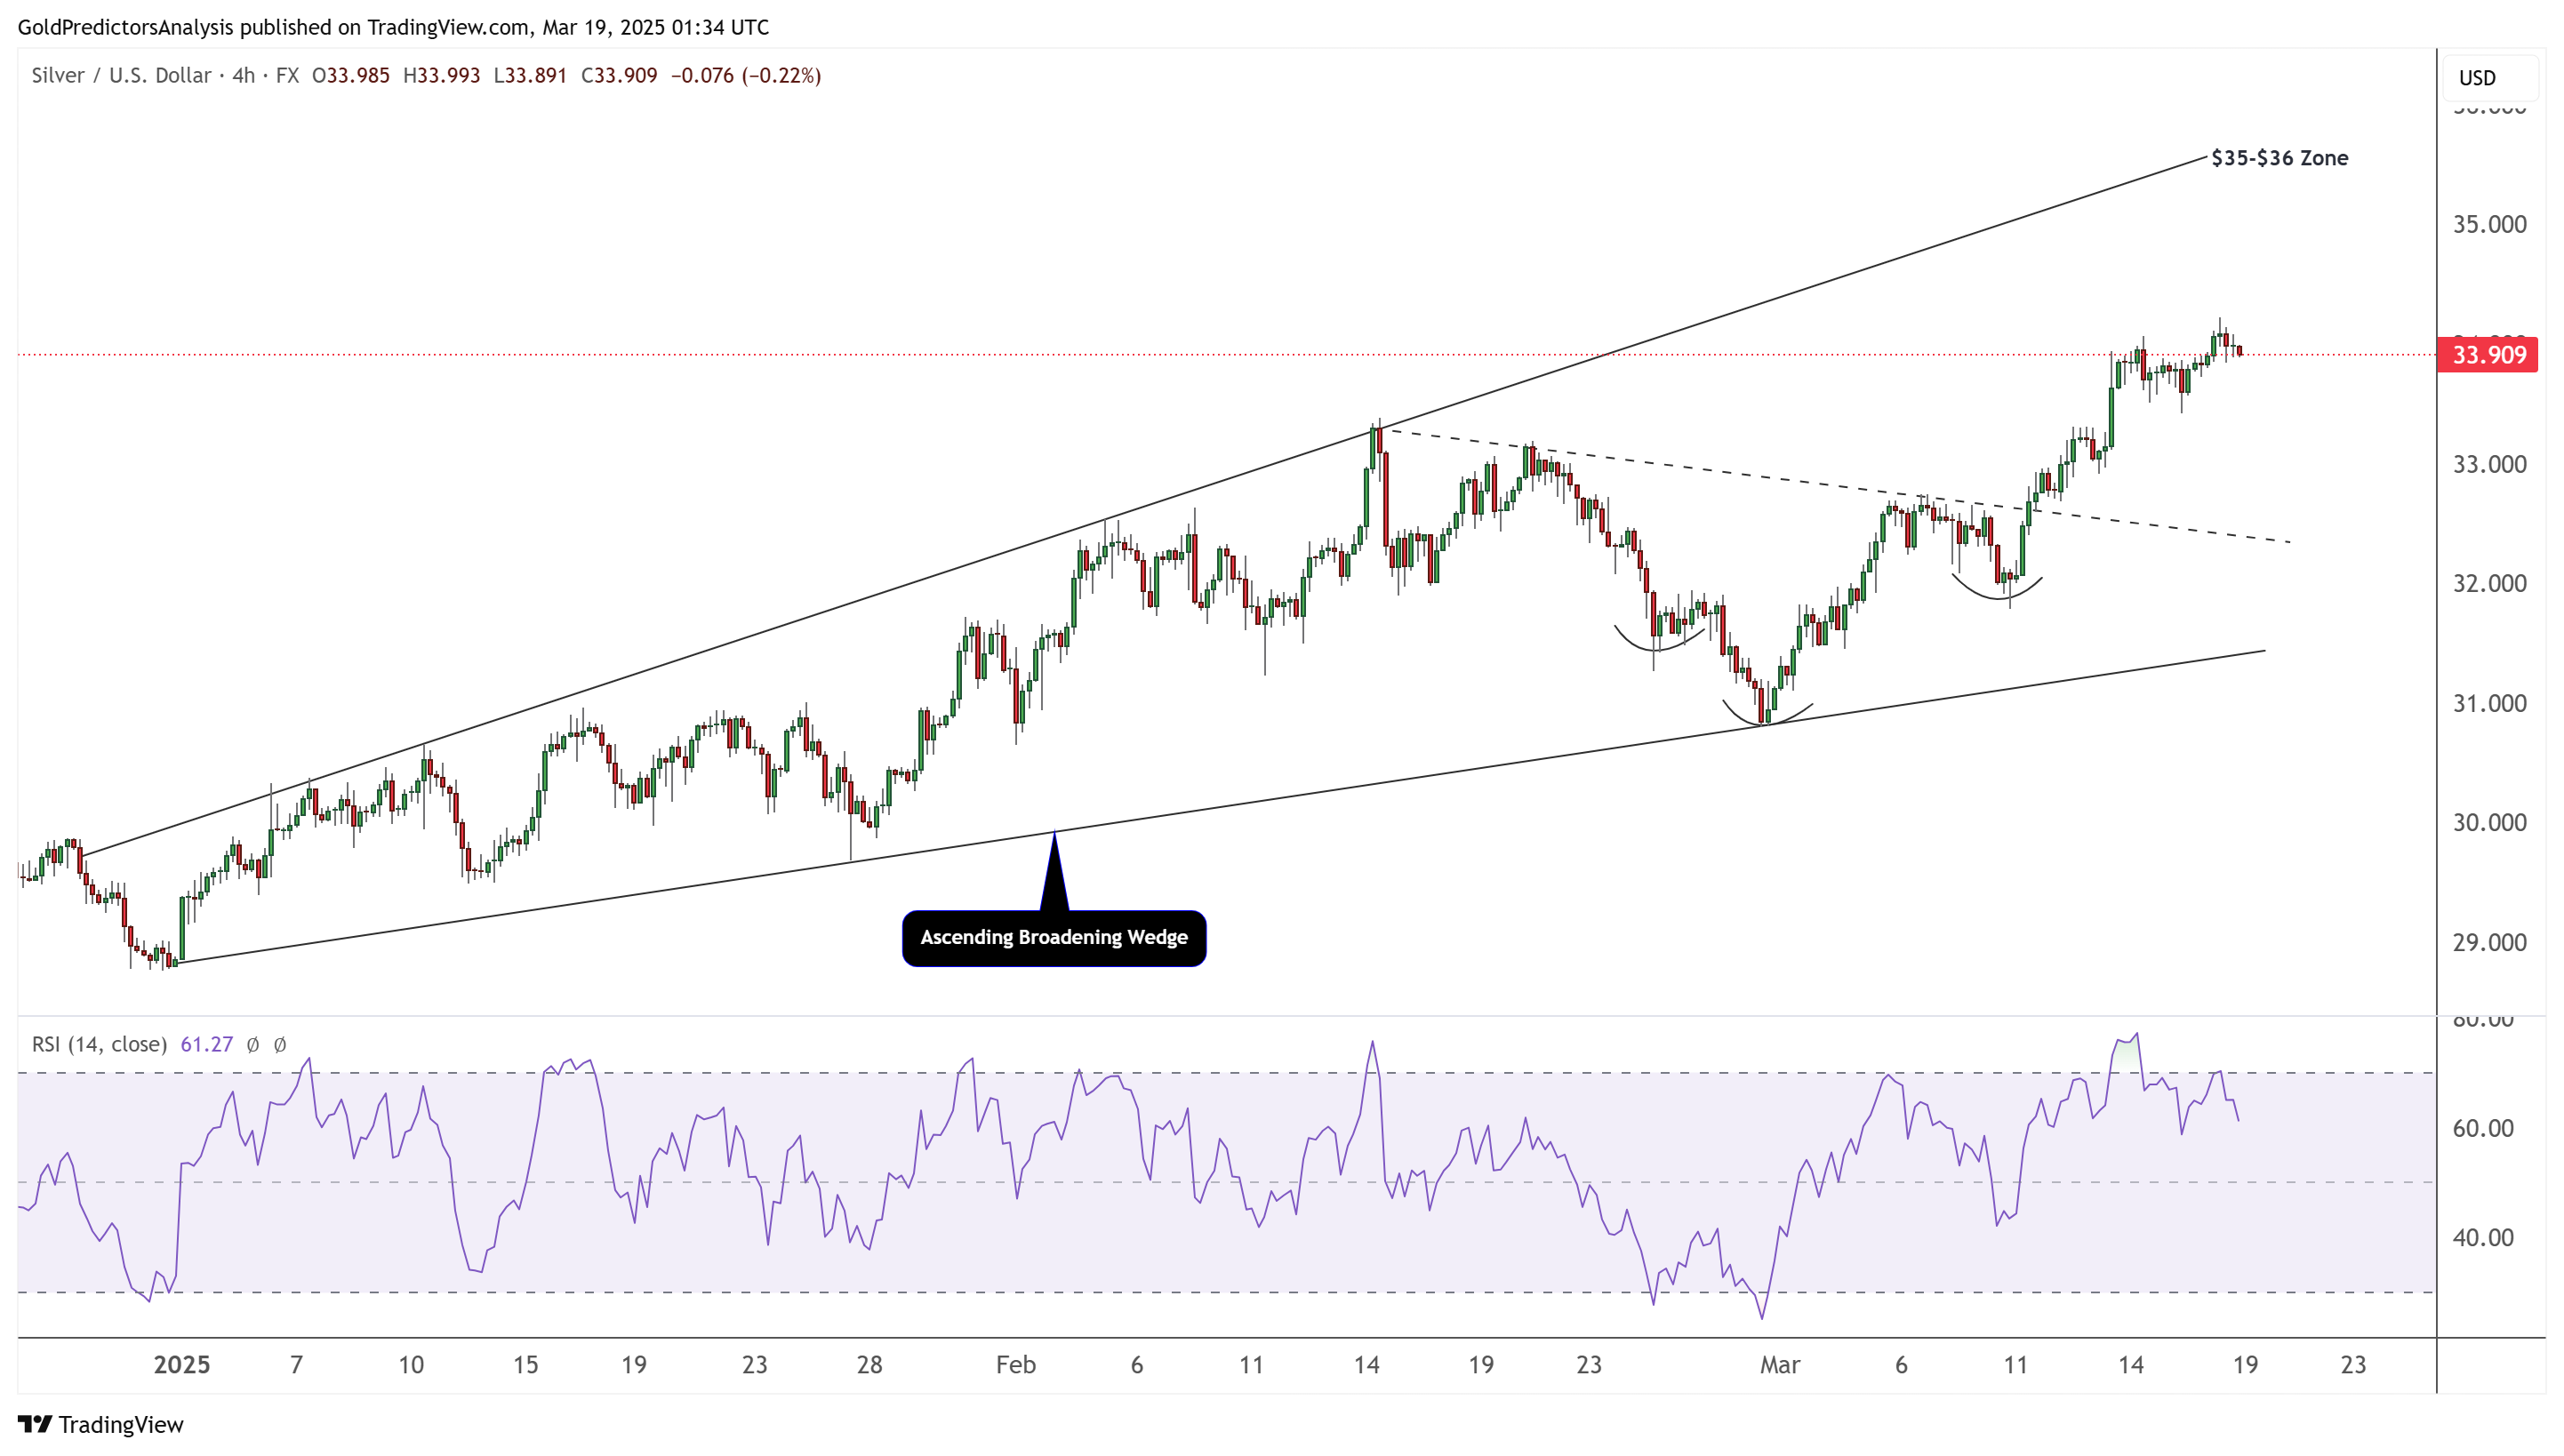
The 4-hour chart for silver shows that the price is moving within an ascending broadening wedge pattern, highlighting strong volatility. As the RSI indicates that the price is overextended in the short term, a correction from this level may be considered a buying opportunity for the next move.
US Dollar (DXY) Technical Analysis
UD Dollar Daily – Negative Price Development
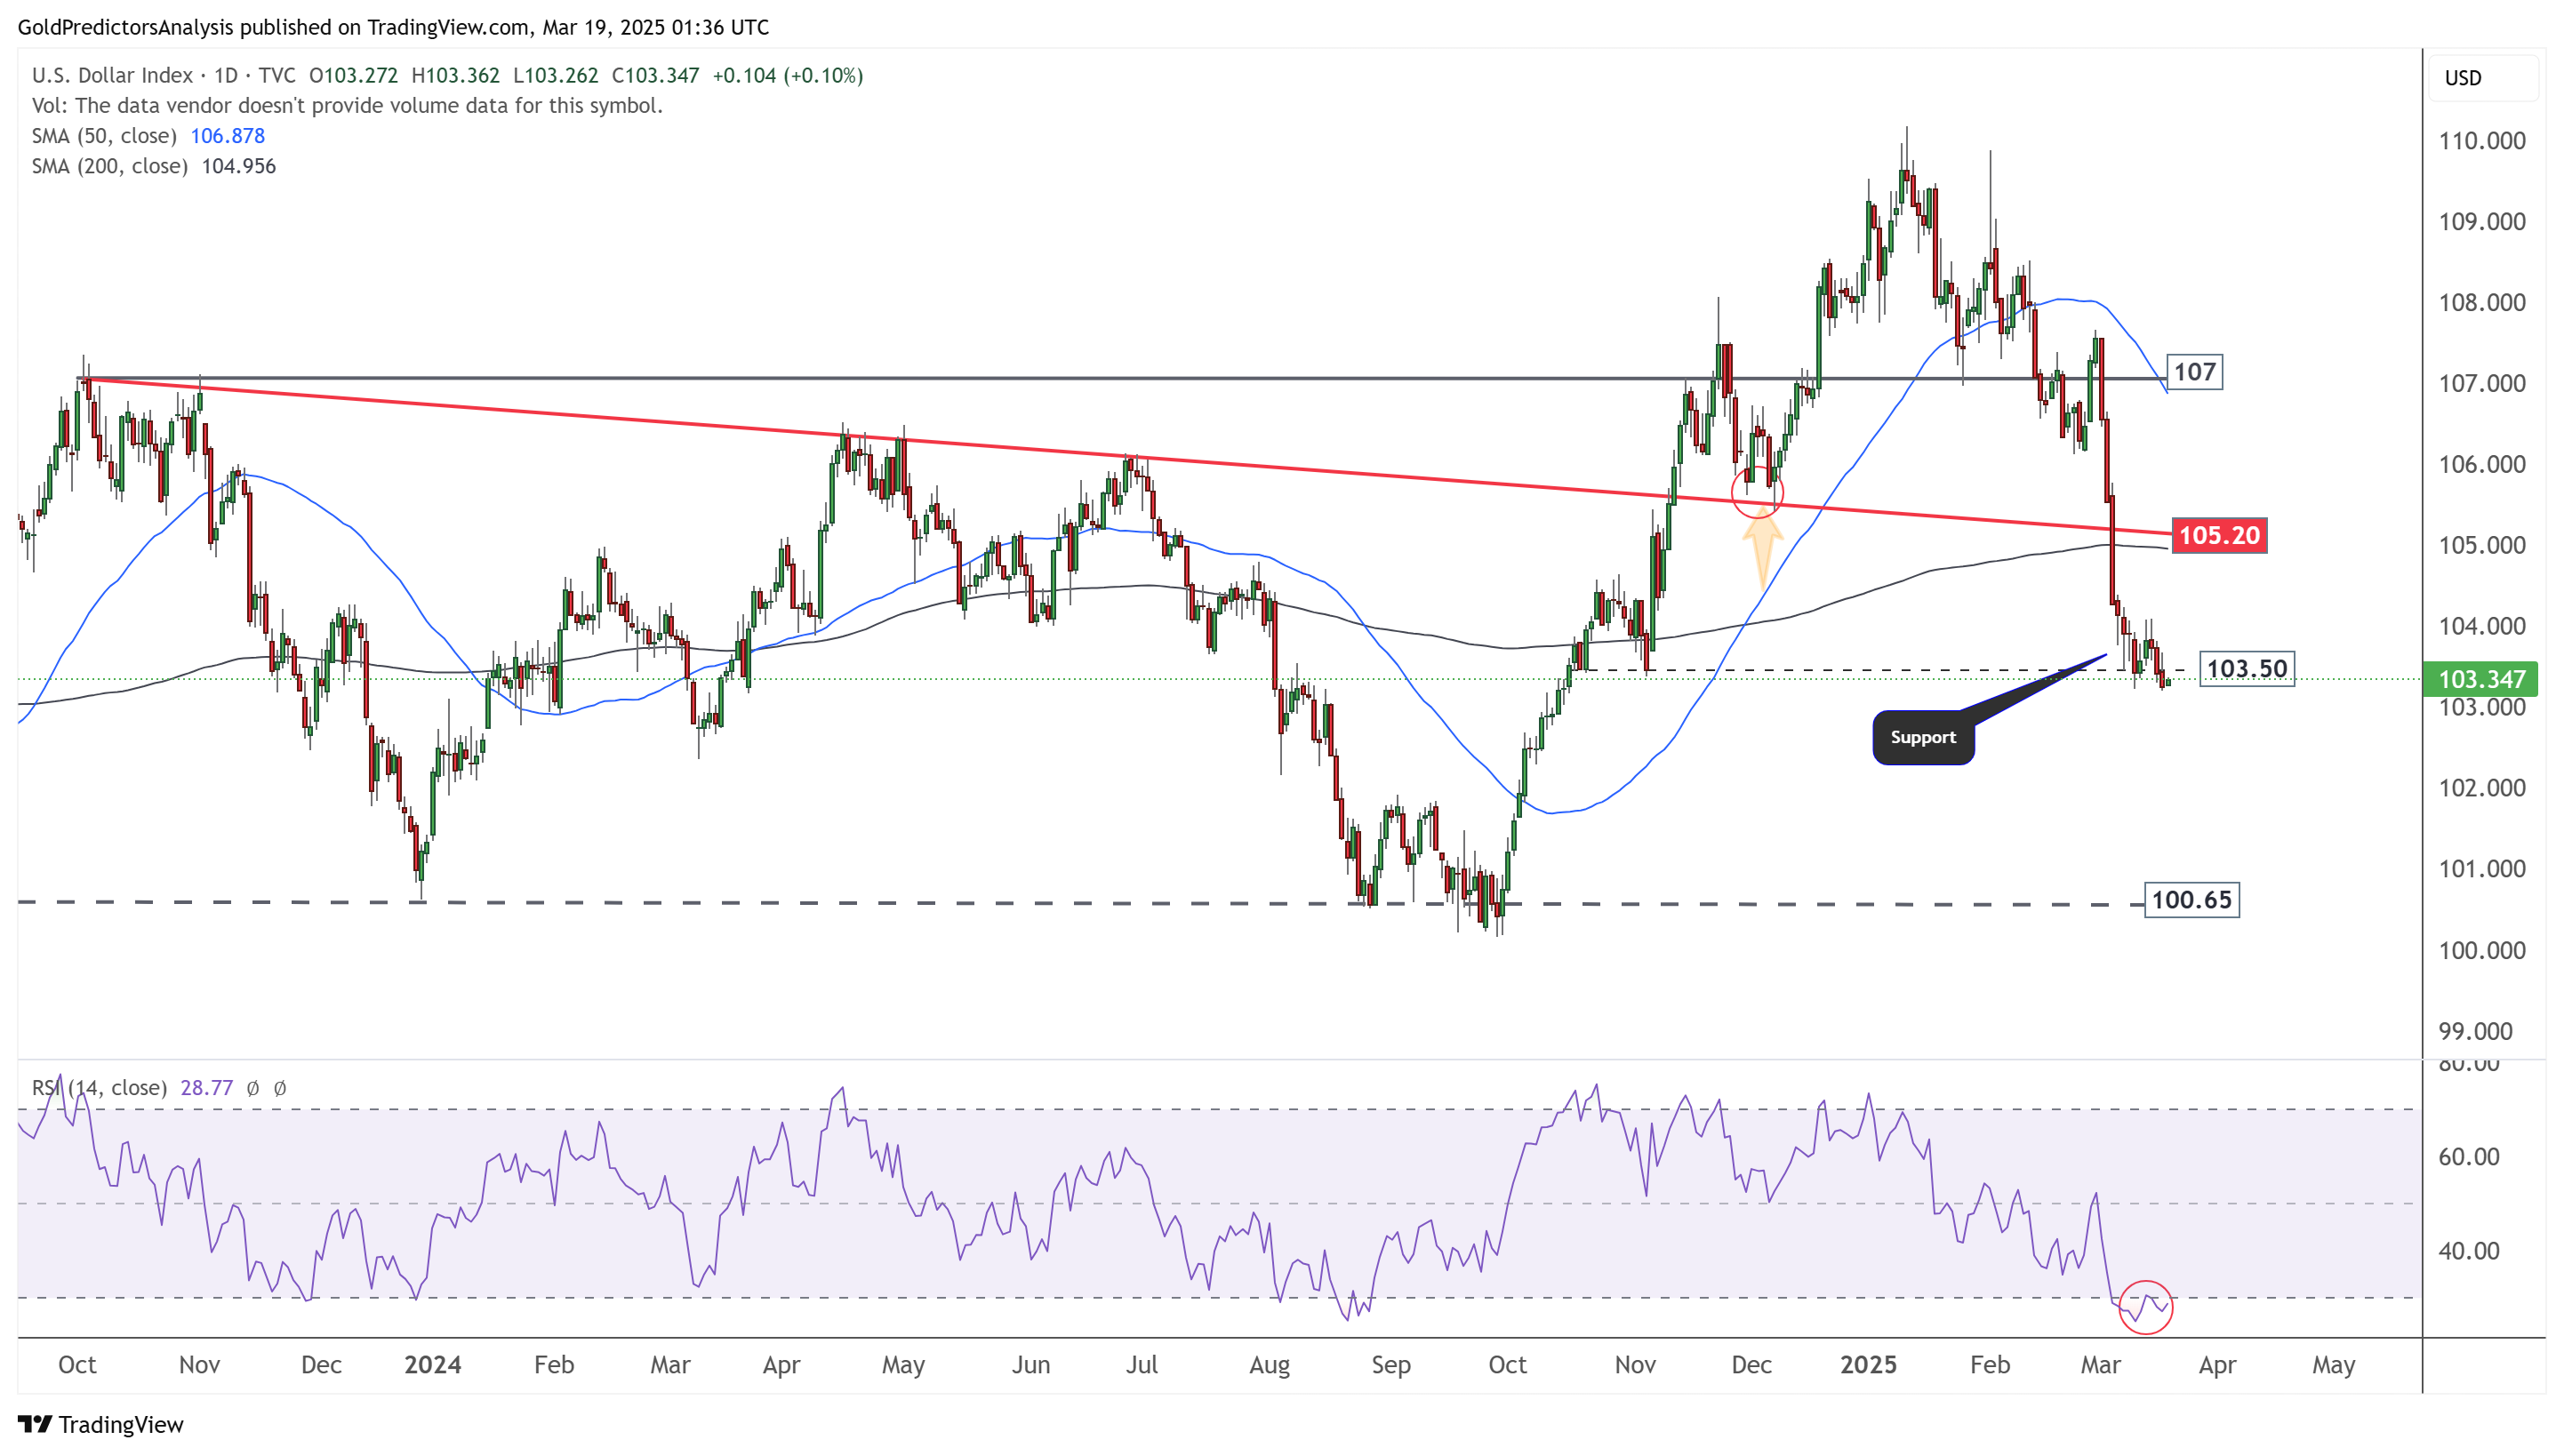
The daily chart for the US Dollar Index shows that it remains under bearish pressure and has developed negative price action despite strong support at 103.50. The price is breaching this support level and appears to be heading to 100.65.
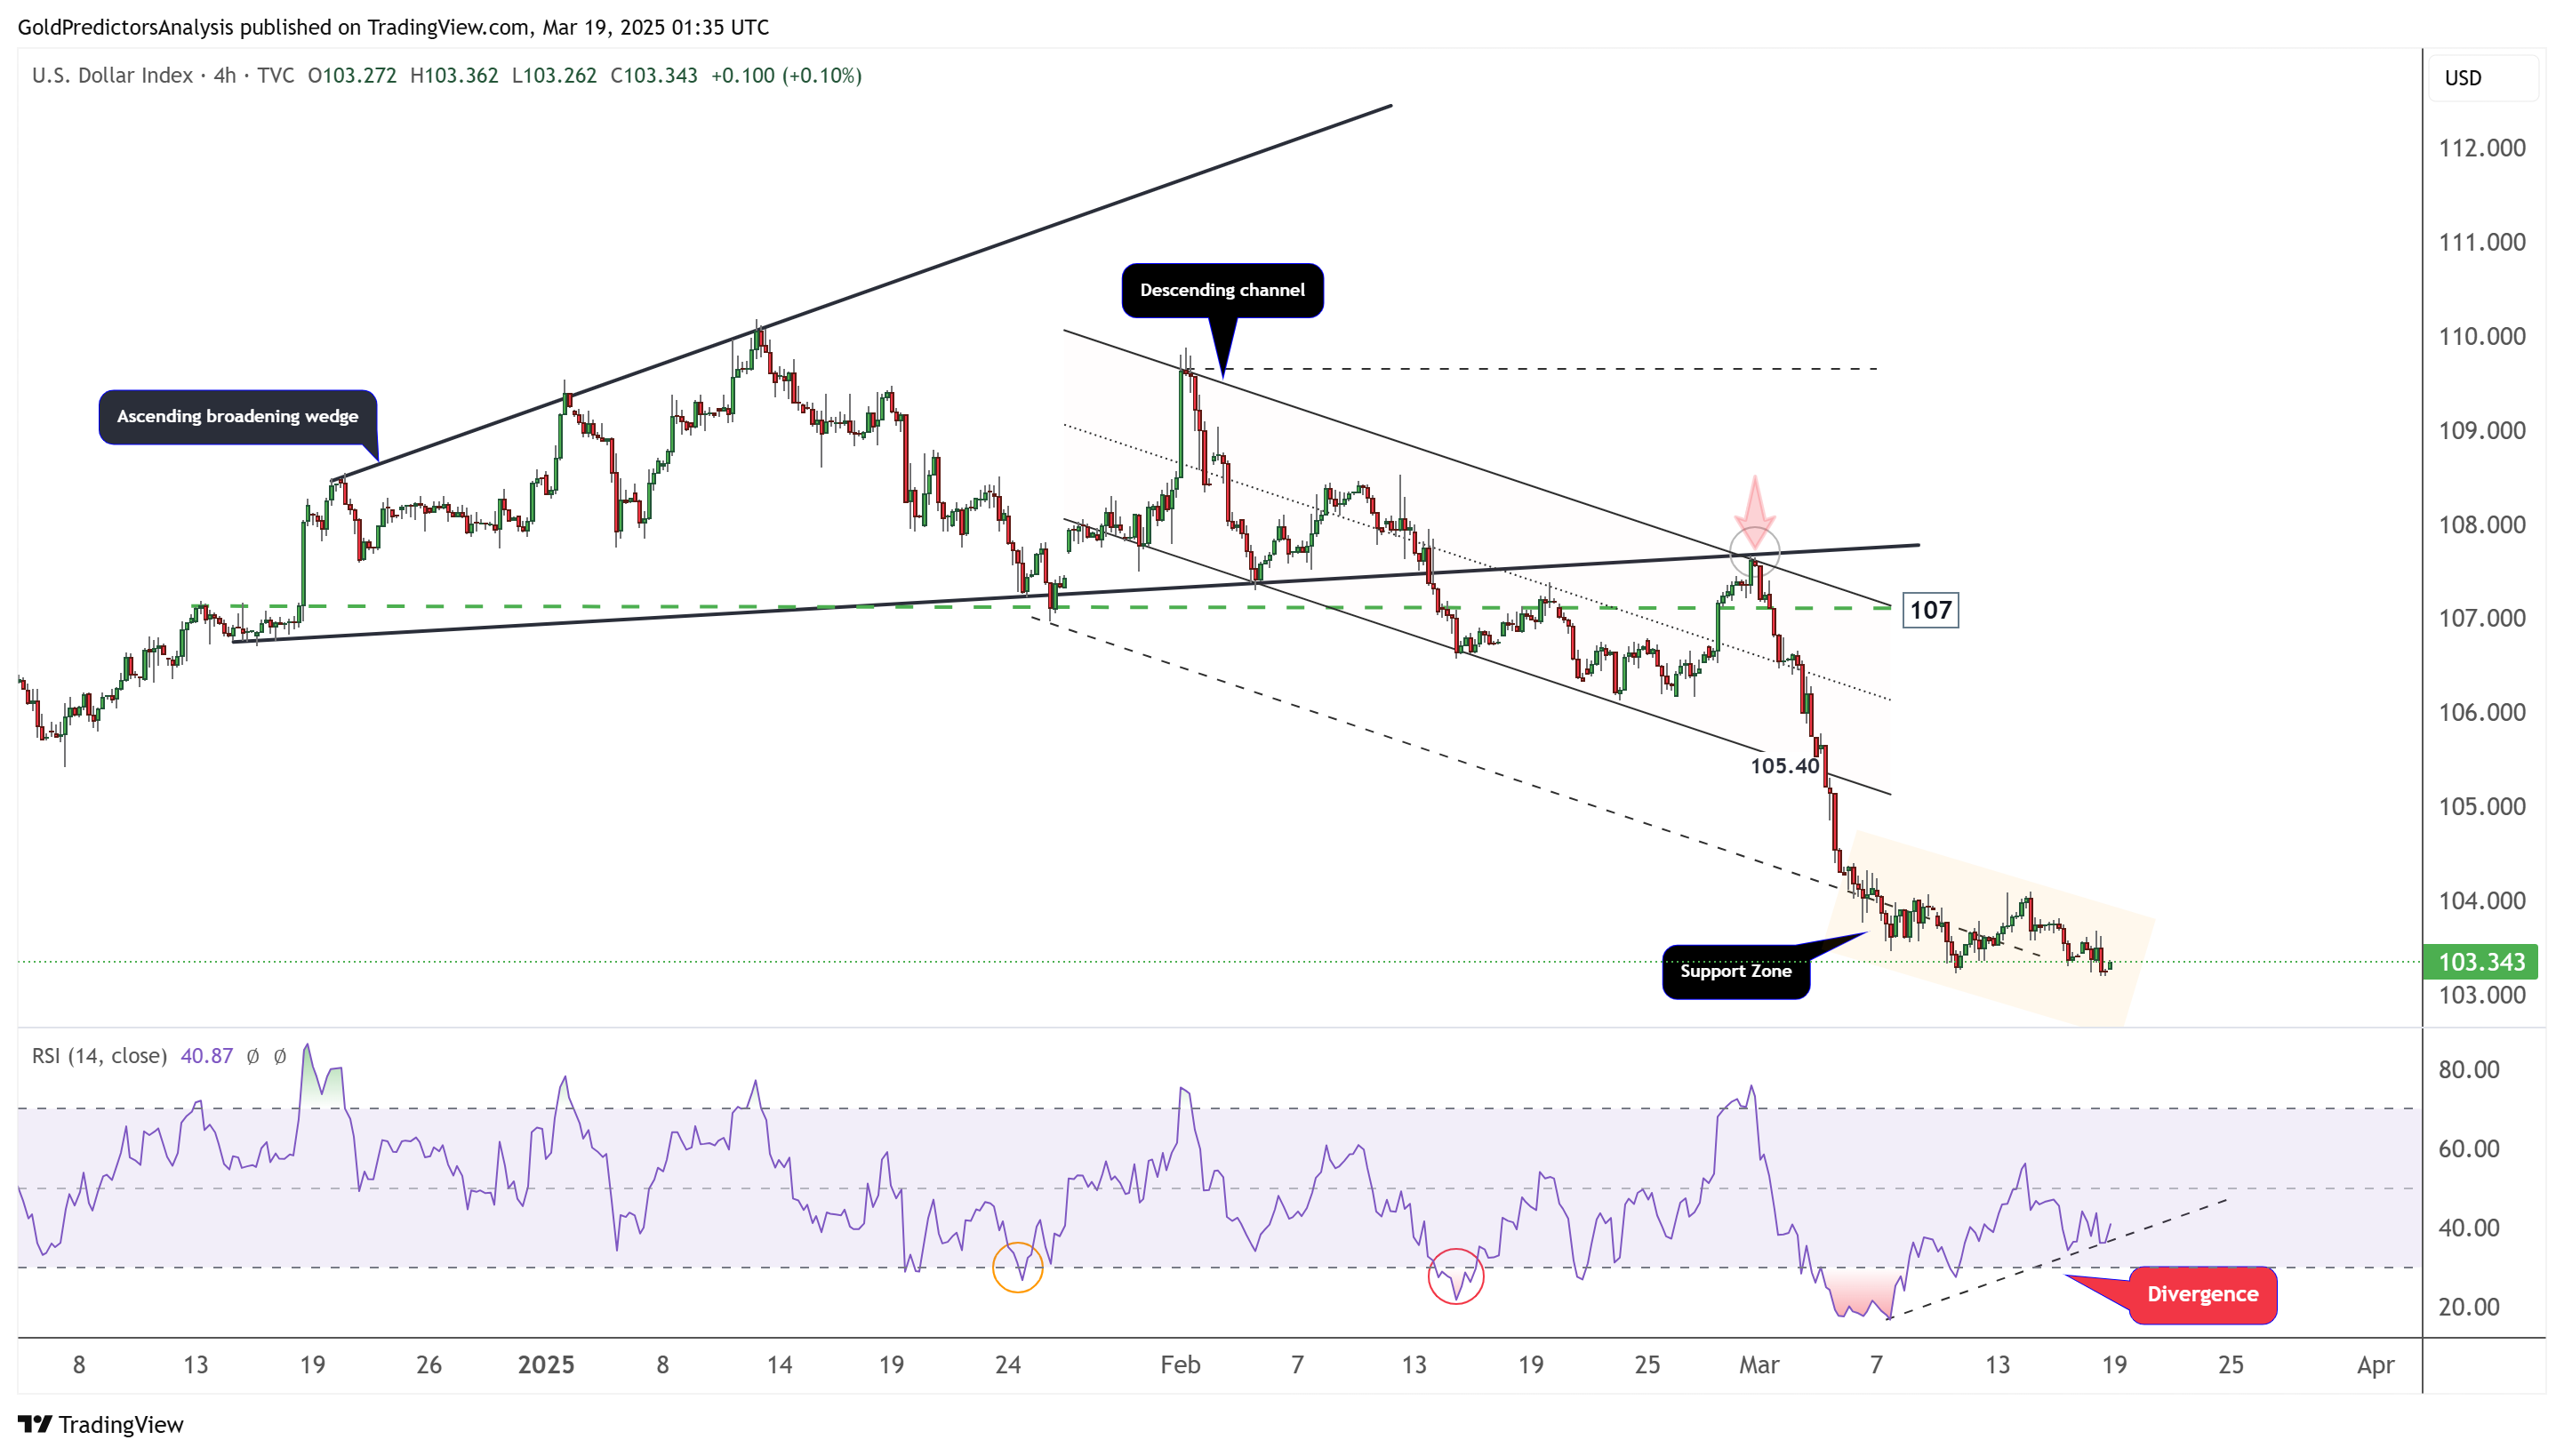
US Dollar 4-Hour Chart – Bearish Pressure
The 4-hour chart also highlights the bearish pressure as the price looks weak at the descending channel support line and appears ready to break down. However, the RSI shows divergence, indicating a potential short-term rebound. The technical reason for the decline and the emergence of bearish pressure is the breakout of the ascending broadening wedge pattern, which signals strong volatility.
About the Author
Bob MasonChief Crypto Boss
TEST 30 He has written extensively for a broader audience and his current focus is on developments relating to the financial markets including, but not limited to currencies, commodities, alternative asset classes, and global equities.
Did you find this article useful?
Latest news and analysis


Advertisement