
Advertisement
Advertisement
Natural Gas and Oil Forecast: Supply Risks vs. Demand Growth—What’s Next for Prices?
By:
Key Points:
- Oil prices rise as Middle East tensions and China’s stimulus drive demand, while global supply risks add to market volatility.
- OECD warns that U.S. tariffs may slow North American growth, potentially weakening global energy demand in the months ahead.
- Venezuelan oil exports remain uncertain as PDVSA plans to continue operations post-Chevron license expiration—impacting supply outlook.

Market Overview
Crude oil prices edged higher on Tuesday, driven by geopolitical instability and China’s economic stimulus. Ongoing supply disruptions in key shipping routes and Beijing’s efforts to boost domestic consumption added support to prices.
China’s crude oil throughput rose 2.1% in early 2024, reflecting sustained demand, while retail sales exceeded forecasts despite rising unemployment. However, global economic risks loom. The OECD warned that U.S. tariffs could slow North American growth, dampening energy demand.
Meanwhile, U.S.-Russia talks may lead to eased sanctions, potentially increasing Russian crude supply. With Venezuela’s production uncertain, markets remain cautious, balancing supply concerns against demand-side pressures.
Natural Gas Price Forecast
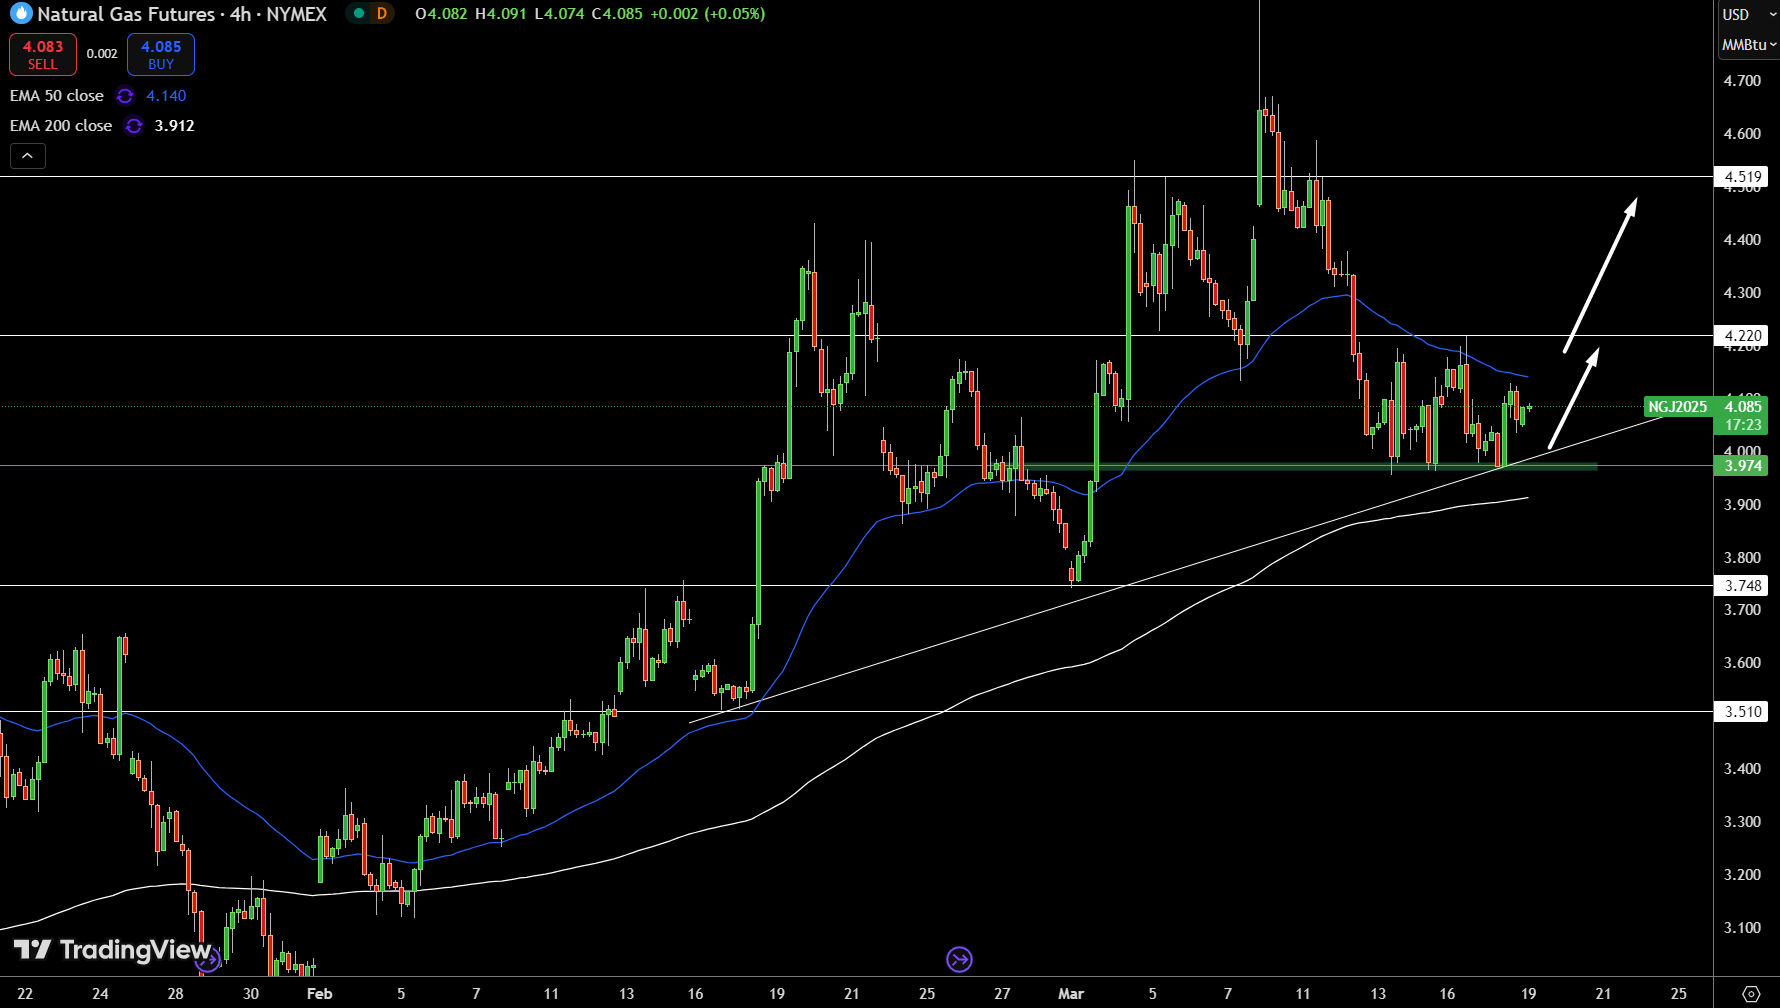
Natural Gas (NG) is trading at $4.12, showing slight gains as it consolidates above key support. The pivot point at $3.97 is critical—holding above it keeps the bullish momentum intact, while a break lower could invite selling pressure toward $3.75 and $3.51.
The 50-day EMA at $4.14 suggests near-term resistance, while the 200-day EMA at $3.91 reinforces the broader uptrend. On the upside, $4.22 is the next hurdle for buyers, with $4.52 as a potential breakout target. An upward trendline continues to support buying pressure, but a failure to hold $3.97 could shift sentiment.
For now, NG remains bullish, but traders should watch for a decisive move above $4.22 or below $3.97 to gauge the next trend direction.
WTI Oil Price Forecast
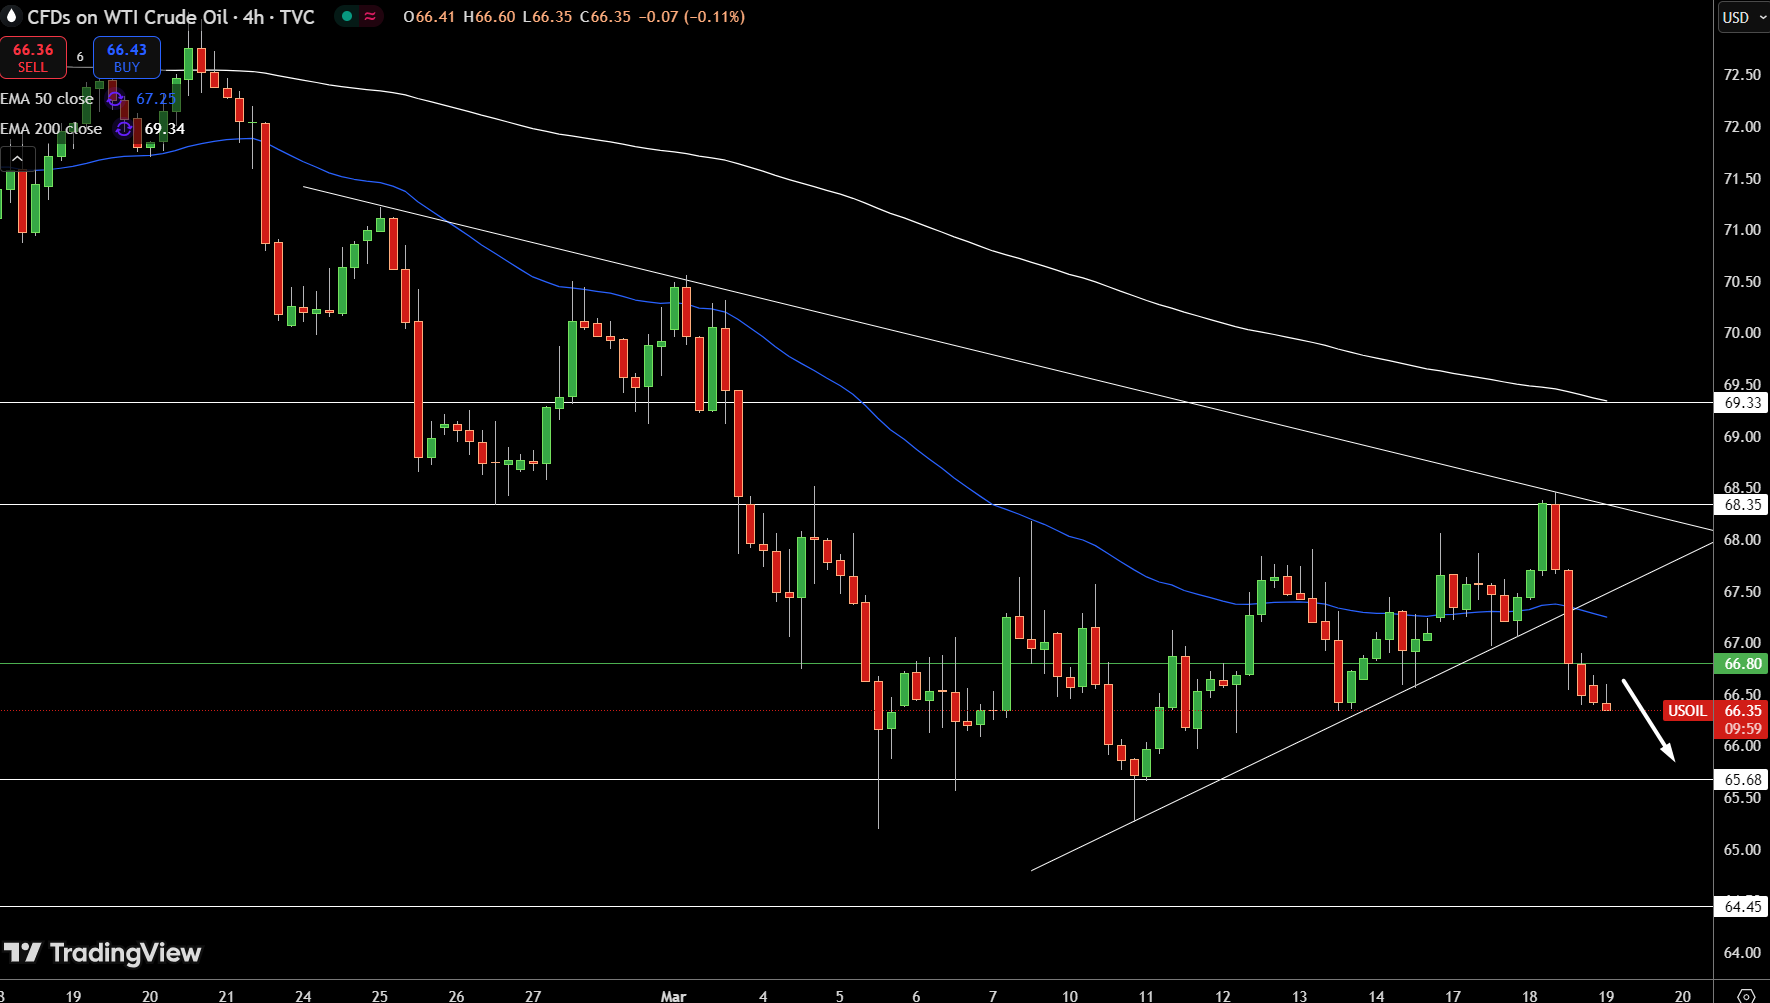
U.S. crude oil (USOIL) is trading at $66.39, struggling to gain traction as it hovers below the pivot point at $66.80. The 50-day EMA at $67.25 is acting as resistance, while the 200-day EMA at $69.34 suggests a broader downtrend.
A break below $65.68 could accelerate losses toward $64.45, reinforcing the bearish sentiment. The formation of three black crows and a bearish engulfing pattern signals potential downside pressure.
However, if buyers manage to reclaim $66.80, a push toward $68.35 could unfold, with $69.33 as the next key level. The market remains at a crossroads, and a decisive move above or below these levels will determine the next trend.
Brent Oil Price Forecast
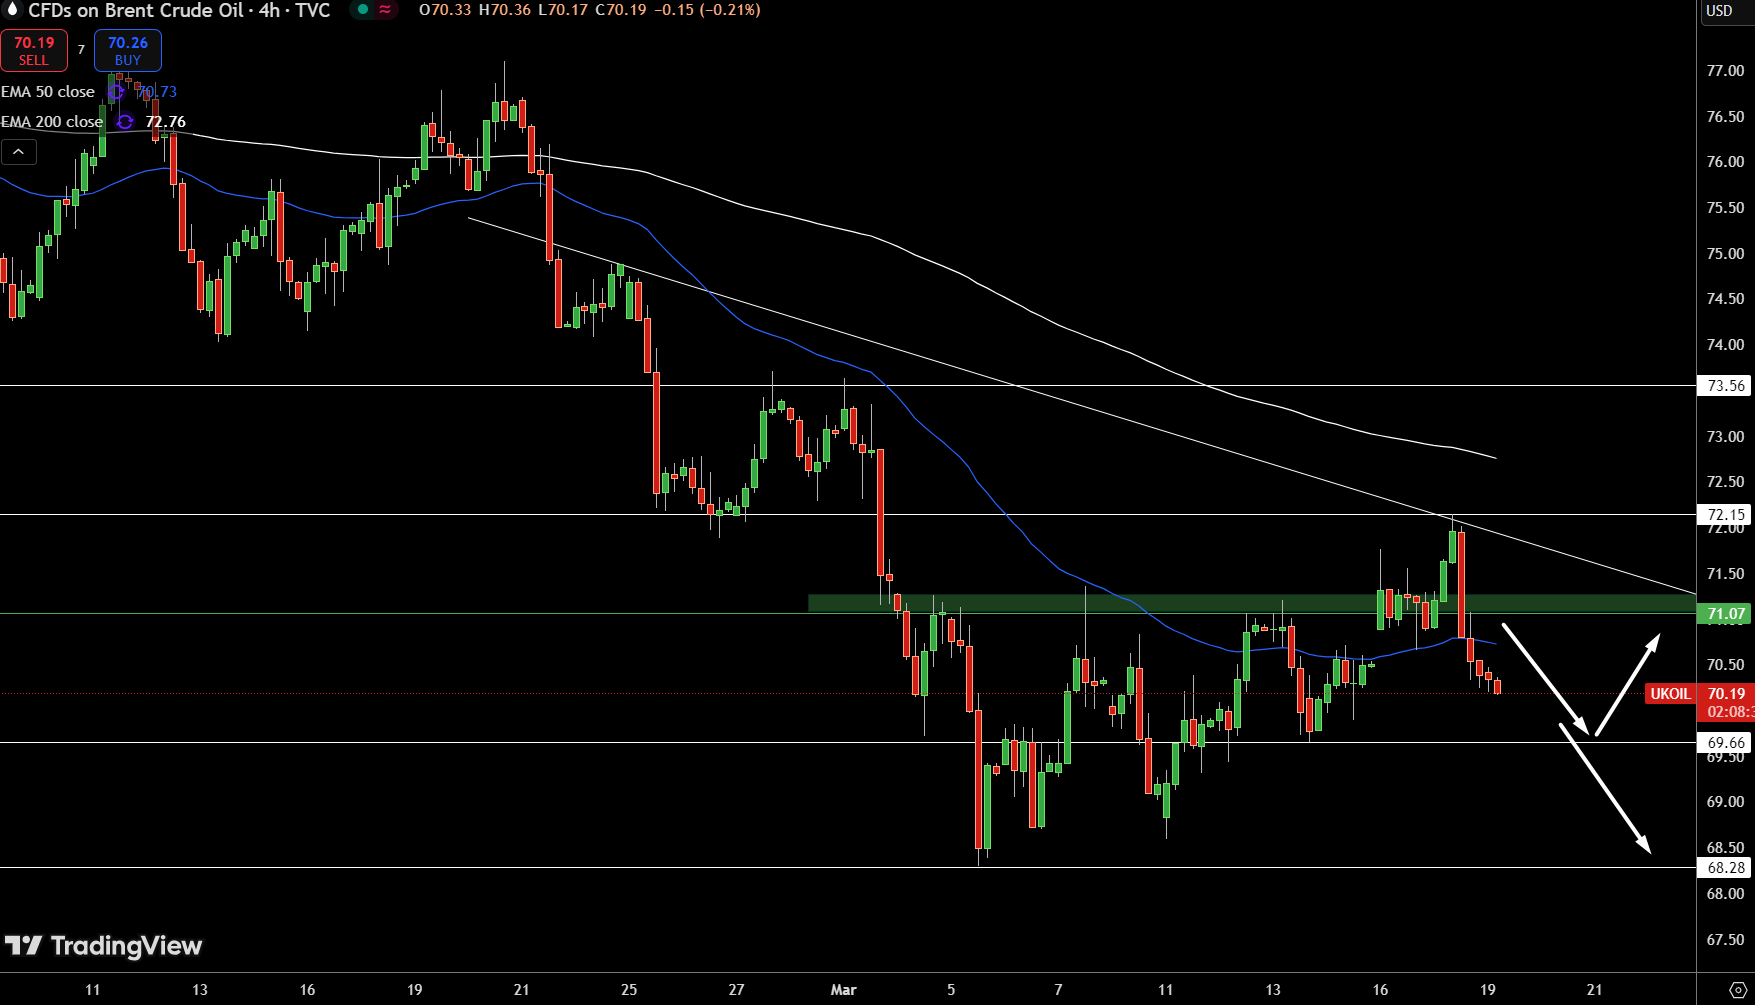
Brent crude (UKOIL) is trading around $70.20, struggling to gain momentum as it remains below the pivot point at $71.07. The 50-day EMA at $70.73 is acting as dynamic resistance, reinforcing near-term selling pressure. The 200-day EMA at $72.76 suggests a broader downtrend, adding to the bearish outlook.
A break below $69.66 could trigger further downside toward $68.28, especially with the three black crows and bearish engulfing patterns signaling growing weakness. However, if buyers reclaim $71.07, UKOIL could test $72.15, with an extended move toward $73.56 if momentum builds.
The market remains in a consolidation phase, and traders should watch for a confirmed breakout or breakdown before positioning for the next move.
About the Author
Bob MasonChief Crypto Boss
TEST 30 He has written extensively for a broader audience and his current focus is on developments relating to the financial markets including, but not limited to currencies, commodities, alternative asset classes, and global equities.
Did you find this article useful?
Latest news and analysis


Advertisement