
Advertisement
Advertisement
Gold Price Forecast: Bullish Rebound as Buyers Defend Key Support
By:
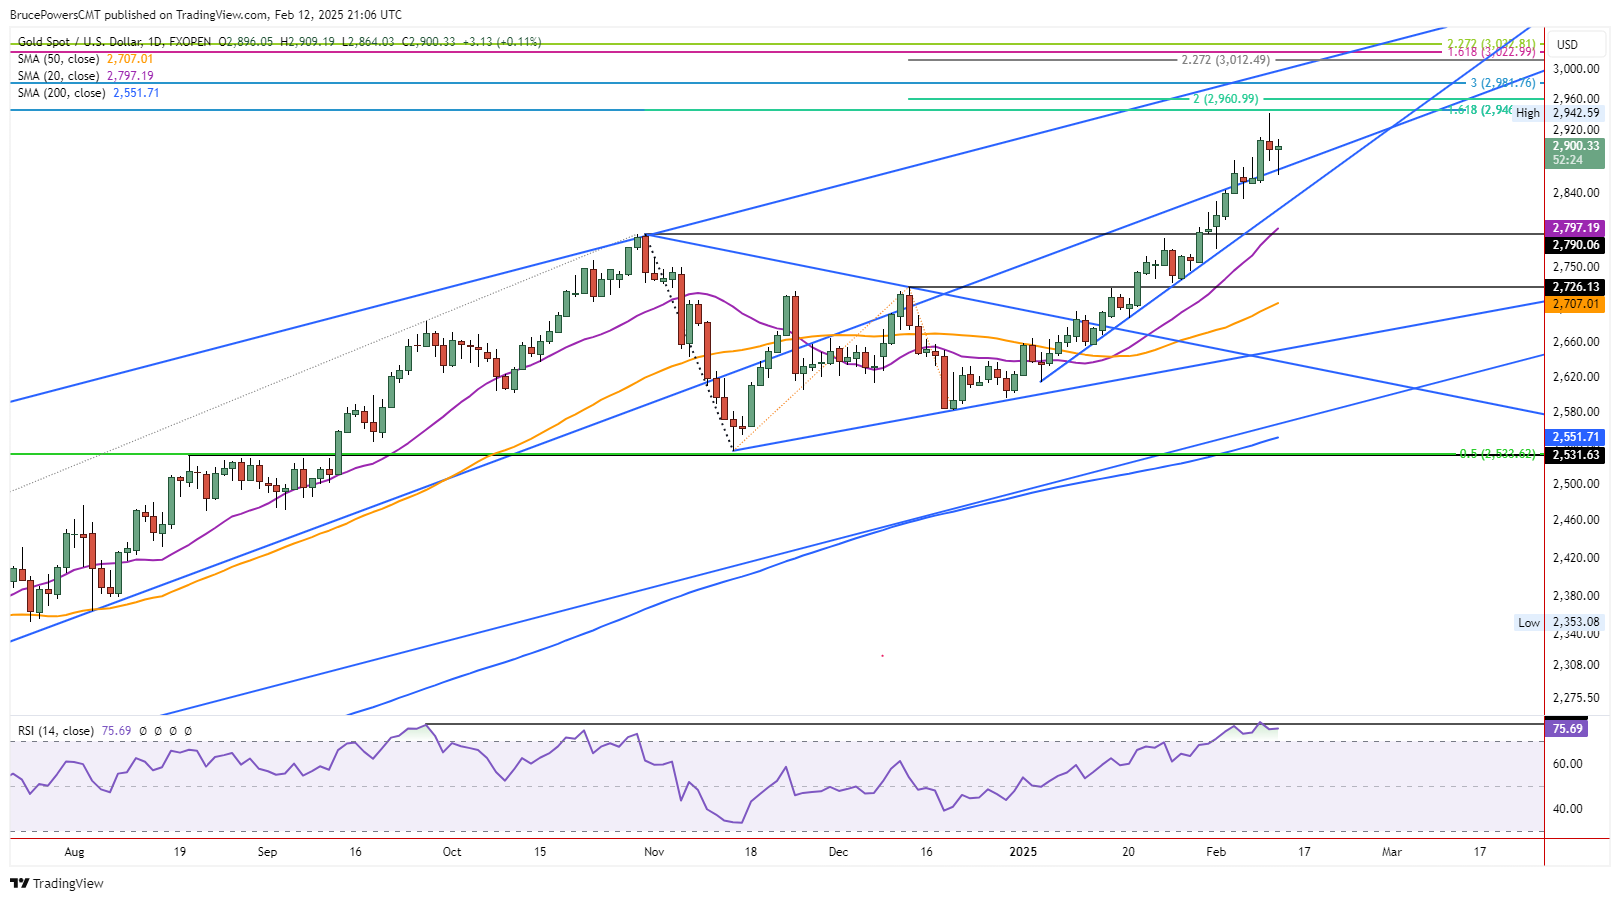
Gold tested support at $2,864 before rebounding, with a potential bullish hammer forming, signaling strength toward resistance levels at $2,909 and $2,943.
Gold successfully tested support on Wednesday near a trendline. A pullback below Tuesday’s low found support at $2,864 before the buyers took back control. Subsequently, an intraday rally followed, reaching a high for the day at $2,909. At the time of this writing gold is trading in the top third of the day’s trading range, which starts at $2,894.
Moreover, if it closes in the top third of the day’s price range it will likely complete a bullish hammer candlestick pattern. In this case, the pattern would be indicating bullish momentum rather than a trend reversal, which is where it is commonly used. Also, today’s closing price will likely be the second highest closing price for gold historically. Monday’s closing price at $2,912 was the highest.
Bullish Hammer Setting Up
Although today’s decline triggered a breakdown below Tuesday’s bearish shooting star candlestick pattern, the bullish reaction today may negate that signal. Nonetheless, near-term price levels look relatively clear. Today’s low of $2,864 is short term support. If broken to the downside the trendline will also have failed to retain support and lower prices become targets.
This week’s low at $2,853 is a key price level as it is part of a series of six consecutive weeks of higher weekly highs and higher weekly lows. A change in that bullish weekly pattern may provide a clue to That bullish pattern may begin to change once that pattern starts to change.
Near Term Resistance at Monday’s High of $2,912
On the upside, a breakout above today’s high of $2,909 will show strength, but Monday’s high of $2,912 should also be considered. It was resistance on Monday, which had the highest historical closing price at $2,907. Tuesday’s record high in gold was $2,943.
The advance completed a couple targets there were derived from Fibonacci extension and projection targets. Therefore, resistance was seen in a price area that could lead to a pullback. Nonetheless, if the $2,943 high is exceeded higher targets start with $2,961, followed by $2,982.
Channel Shows Possible Higher Target
Furthermore, notice that there is a trendline across the top of a large parallel trend channel. The line was confirmed with the recent swing high at $2,790. It also shows the possibility of higher prices if Tuesday’s high can be exceeded.
For a look at all of today’s economic events, check out our economic calendar.
About the Author
Bruce Powerscontributor
Bruce has been involved in the financial markets for over 20 years, as an analyst, trader, educator, and writer.
Latest news and analysis


Advertisement