
Advertisement
Advertisement
Natural Gas Price Forecast: Bullish Momentum Remains as Resistance Tested
By:
Closing above the 50-Day MA and 38.2% Fibonacci retracement strengthens natural gas’s outlook, with resistance at $3.64-$3.69 as the next target.
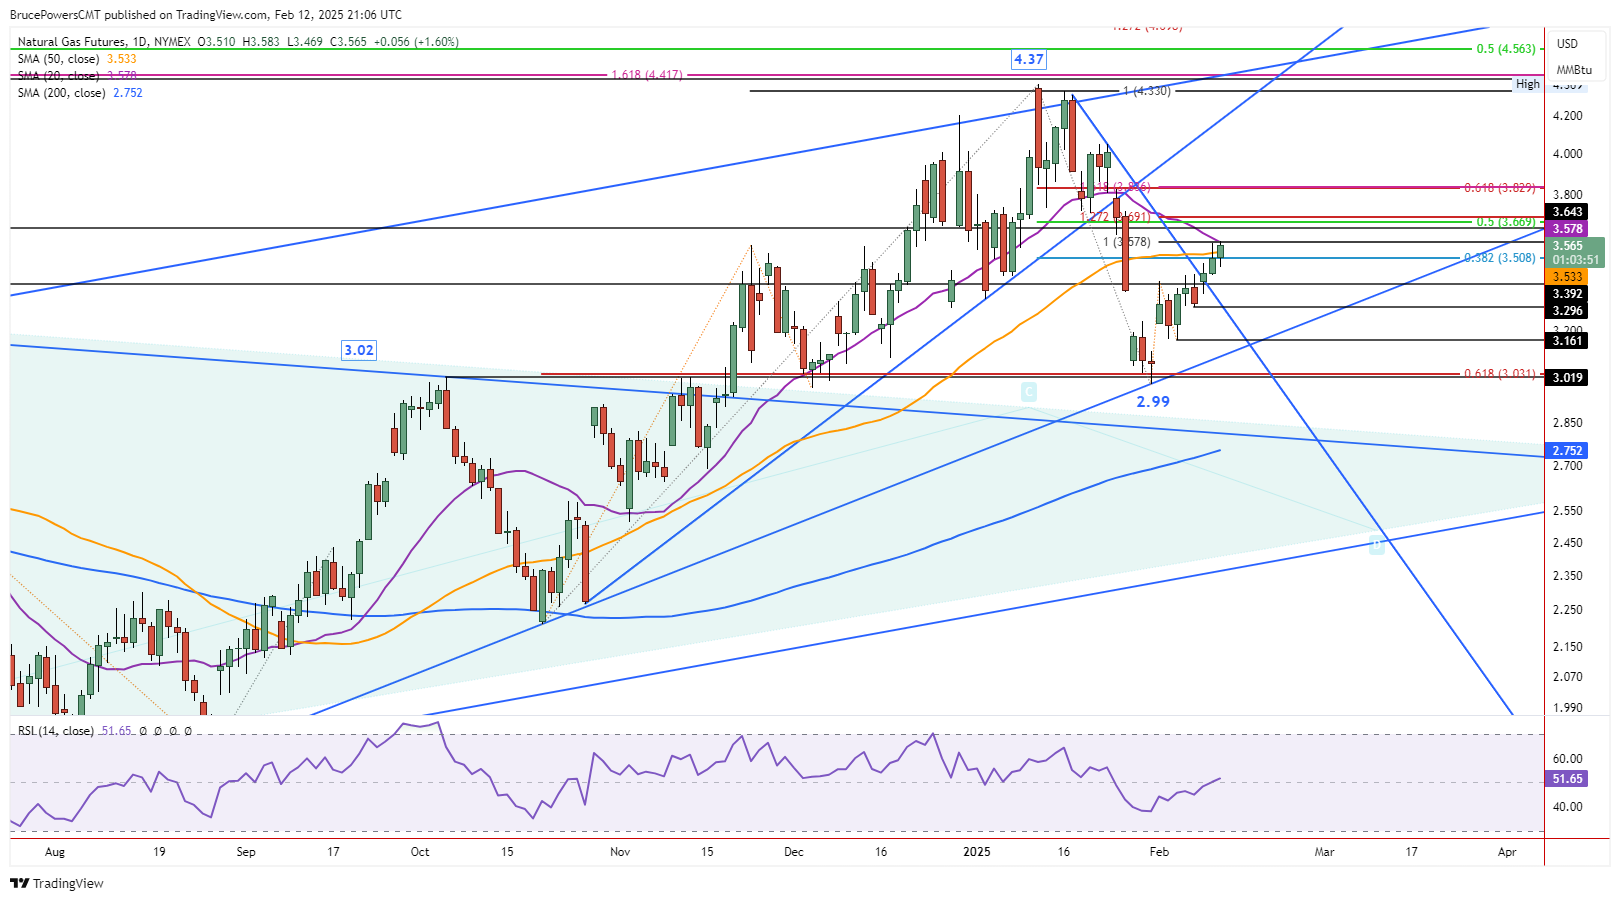
Natural gas showed sustained strength on Wednesday with another test of resistance around $3.58. At the time of this writing, it continues to trade near the highs of the day. So far, the high of the day at the time of this writing was $3.58 and the low $3.47.
There was a slight rise above Tuesday’s high of less than $0.01 today and natural gas is on track to end the day above the 50-Day MA (orange) for the first time since January 27. It is also interesting to note that the 20-Day MA (purple) has now converged with the previously discussed price level of $3.58, the high for Tuesday.
Daily Close Above 50-Day Line is Bullish
A daily close above the 50-Day line is bullish and may provide a clue that indicates further underlying strength in the price of natural gas. Also, the 38.2% Fibonacci retracement level at $3.51 was exceeded for the second time today and a strong close above that price level looks likely. However, today’s rise was the first test of resistance around the 20-Day MA since the drop below it on January 27. Resistance has been seen but whether it can be sustained remains to be seen. Given the signs of underlying strength, a reclaim of the 20-Day MA may be possible before a pullback.
Reclaim of 20-Day Line Would Show Further Strength
If the 20-Day MA can be reclaimed, the next higher target zone is from around $3.64 to $3.69. That price zone consists of the prior swing high and peak for 2023 at $3.64, a 50% retracement level at $3.67, and a 127.2% extended target for a small rising ABCD pattern (not shown). The initial target for the ABCD pattern was completed at $3.58.
Now that the 20-Day line has fallen to converge with the $3.58, the $3.58 price zone takes on greater potential significance. Since a breakout above the 2023 high of $3.64 provided a new bullish trend reversal signal for the long-term trend in late-December, it is a key price level. A rise above it would be bullish, and especially a daily close above it.
Last week’s price range and likely this week as well are within the price range from two weeks ago from $2.99 to $3.83. Since the low end of the price range was tested as support with last week’s low, an upswing to test resistance near the week’s high could be in process.
For a look at all of today’s economic events, check out our economic calendar.
About the Author
Bruce Powerscontributor
Bruce has been involved in the financial markets for over 20 years, as an analyst, trader, educator, and writer.
Latest news and analysis


Advertisement