
Advertisement
Advertisement
Gold Price Forecast: Extends Rally, but Overbought Signals Hint at Pullback
By:
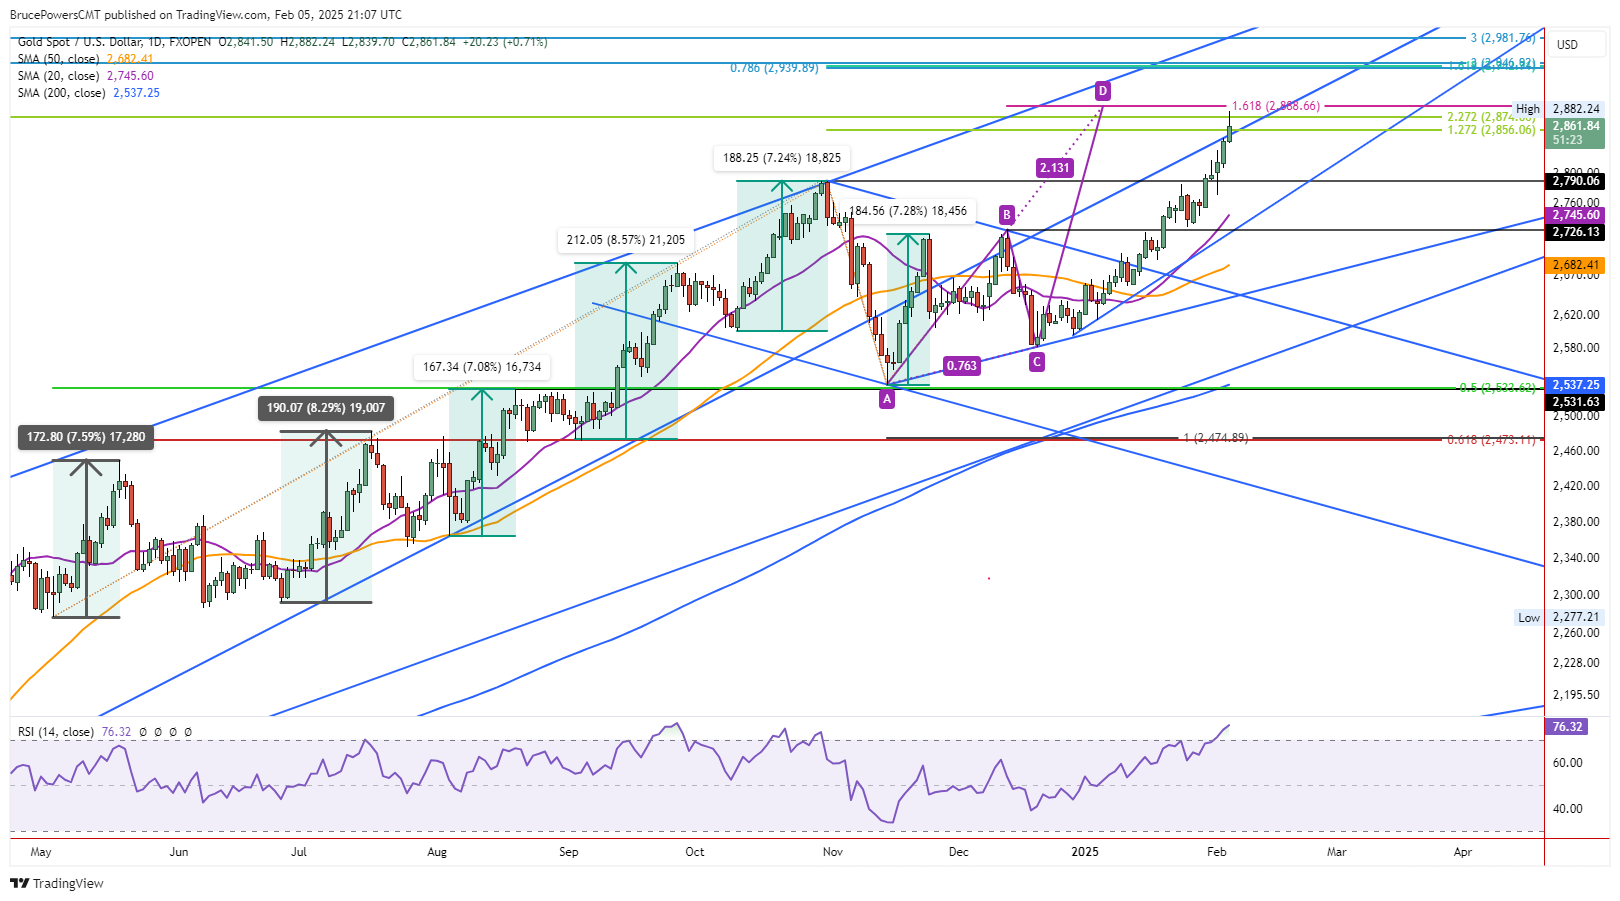
Gold surged to a record $2,882 before resistance emerged, with overbought conditions signaling a potential pullback. Key support lies at $2,790 and $2,772.
Gold’s bull trend continued to rise on Wednesday as it hit a new record high of $2,882 before encountering resistance. Following that high gold began to pull back intraday and is currently trading near the midpoint of the day’s trading range, which is at 2,861. During Wednesday’s advance gold exceeded potential targets at $2,856 and $2,874, before stalling a little below the next higher target at $2,889.
That price level is the 161.8% extended target for a rising ABCD pattern that began from the recent swing low at $2,537 (A). It shows a harmonic relationship between the first (AB) and second (CD) upswings. Once that occurs, the possibility of encountering resistance increases.
Price Reaching Overbought
Certainly, the price of gold looks to have gotten extended and is due for a correction of some degree. Both the intraday pullback today and the completion of an ABCD pattern target, point to that conclusion. Moreover, the relative strength index (RSI) momentum oscillator reached an overbought of 76.50 today, like the 77.24 overbought reading listed at the minor interim swing high from late-September 2024.
Resistance Seen Following Day’s High
Overall, gold showed strength during Wednesday’s advance as it rose beyond lower targets, as noted above. Nonetheless, prices can go only so far before they are due for a price correction in a retracement. To what degree that might occur remains to be seen. And there is little sign of it yet. The upswing from the $2,582 swing low (C) completed a $300 or 11.6% rally as of today’s high at $2,882.
That level of performance exceeds the previous six rallies, which peaked at 8.6%. However, it is interesting to note that as gold was rising out of a base following the October 2023 lows, it did see similar stronger rallies, from 10.6% to 17.8%. Does the current 11.6% advance point to further strong momentum as the next leg up in the long-term bull trend begins?
Key Support Starts at $2,840
Further weakness is likely if there is a drop below today’s low of $2,840. The recent new trend high breakout level at $2,790 will then provide the first more significant potential support area. Also, this week’s low at $2,772 is a potential support level, assuming it is not broken before this week ends.
For a look at all of today’s economic events, check out our economic calendar.
About the Author
Bruce Powerscontributor
Bruce has been involved in the financial markets for over 20 years, as an analyst, trader, educator, and writer.
Latest news and analysis


Advertisement