
Advertisement
Advertisement
Oil, Natural Gas, USD/CAD Analysis: Energy Prices Struggle Against Trade Shifts
By:
Key Points:
- WTI crude oil (CL) continues to face bearish pressure due to the US-China trade war.
- Natural gas (NG) rebounds from strong support at $3.
- USD/CAD shows strong volatility due to financial uncertainty impacting the energy market.

China’s retaliatory tariffs on US crude oil and LNG put downward pressure on oil prices. The tariffs, set at 10% for crude and 15% for LNG, will take effect on February 10. However, their impact remains limited, as US oil exports comprise only a small fraction of China’s total imports. Market participants still see a possibility of negotiations. This uncertainty weighed on oil prices and pushed WTI crude oil (CL) to $71 and Brent crude oil (BCO) to $75.
Moreover, the strong rebound in oil prices on Tuesday was due to President Trump signing a directive to enforce sanctions on Iran more strictly. This move raised concerns over global supply disruptions, as Iran’s oil exports could be significantly affected. Market reactions indicated traders anticipated a tighter supply, leading to a price recovery. Trump’s firm stance on Iran was consistent with his previous policies, reinforcing expectations that Iranian oil flows would face further restrictions.
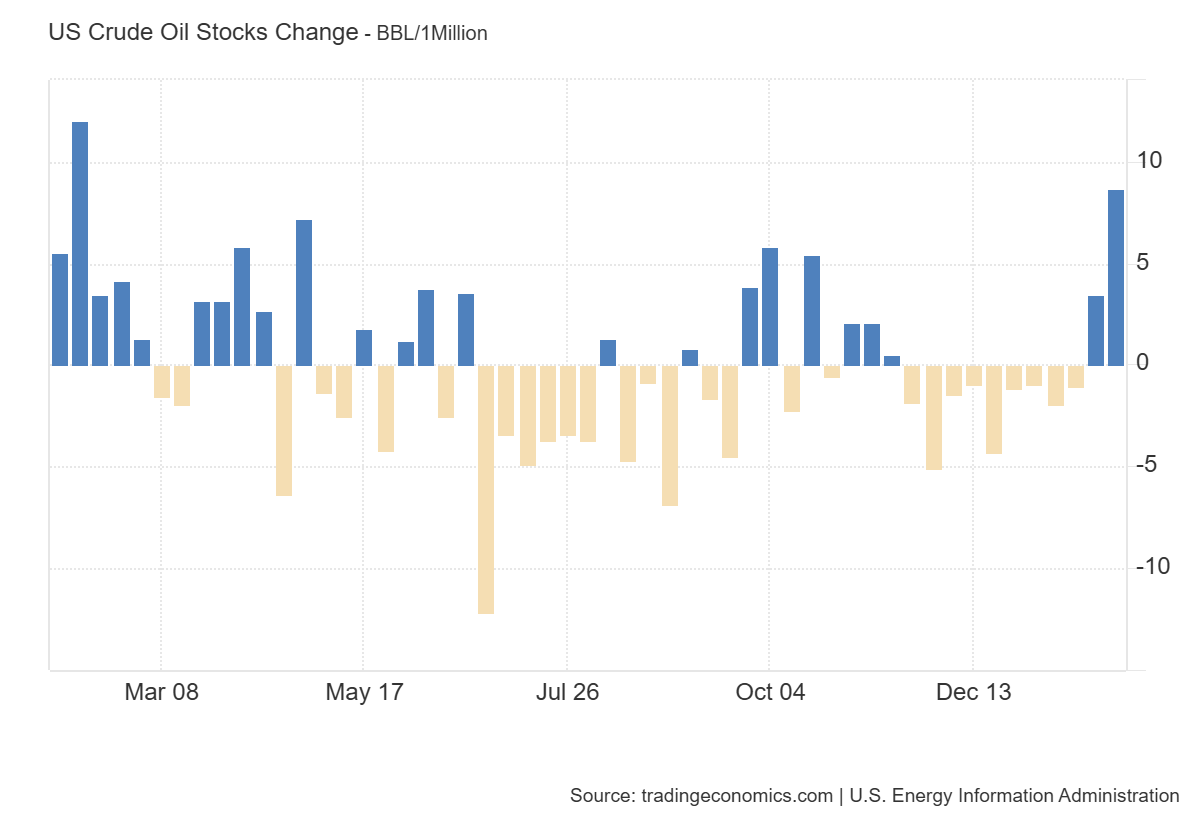
Meanwhile, US crude inventories saw a sharp increase, surpassing market expectations. The chart below shows an increase of 8.664 million barrels, the highest in nearly a year. This build added to market uncertainty, as higher stockpiles typically weigh on oil prices. However, the US-China trade war has offset this factor, leading to heightened uncertainty in the oil market. The market is now waiting for US and Canadian employment data to gain further direction for the US dollar and energy markets.
WTI Crude Oil (CL) Technical Analysis
Oil Daily Chart – Bearish Pressure
The daily chart for WTI crude oil shows that the price trades within a triangle pattern and remains under bearish pressure. The price has broken below the 50-day and 200-day SMAs. The 50-day SMA remains below the 200-day SMA, indicating continued bearish pressure in the oil market. Moreover, the RSI remains below the mid-level, suggesting the price may continue toward the triangle support area around $68.

Oil 4-Hour Chart – Descending Channel
The 4-hour chart for WTI crude oil shows that the price has been trading within a descending channel and remains under bearish pressure. The price has approached the $71 level, and the continued bearish pressure indicates further downside in oil prices.

Natural Gas (NG) Technical Analysis
Natural Gas Daily Chart – Key Support
The daily chart for natural gas (NG) shows that the price has formed an inverted head-and-shoulders pattern, indicating a bullish price action. The correction has reached strong support at $3. The ongoing demand for natural gas might lift prices from these key levels. The 50-day and 200-day SMAs remain upward, signaling positive momentum in natural gas prices.

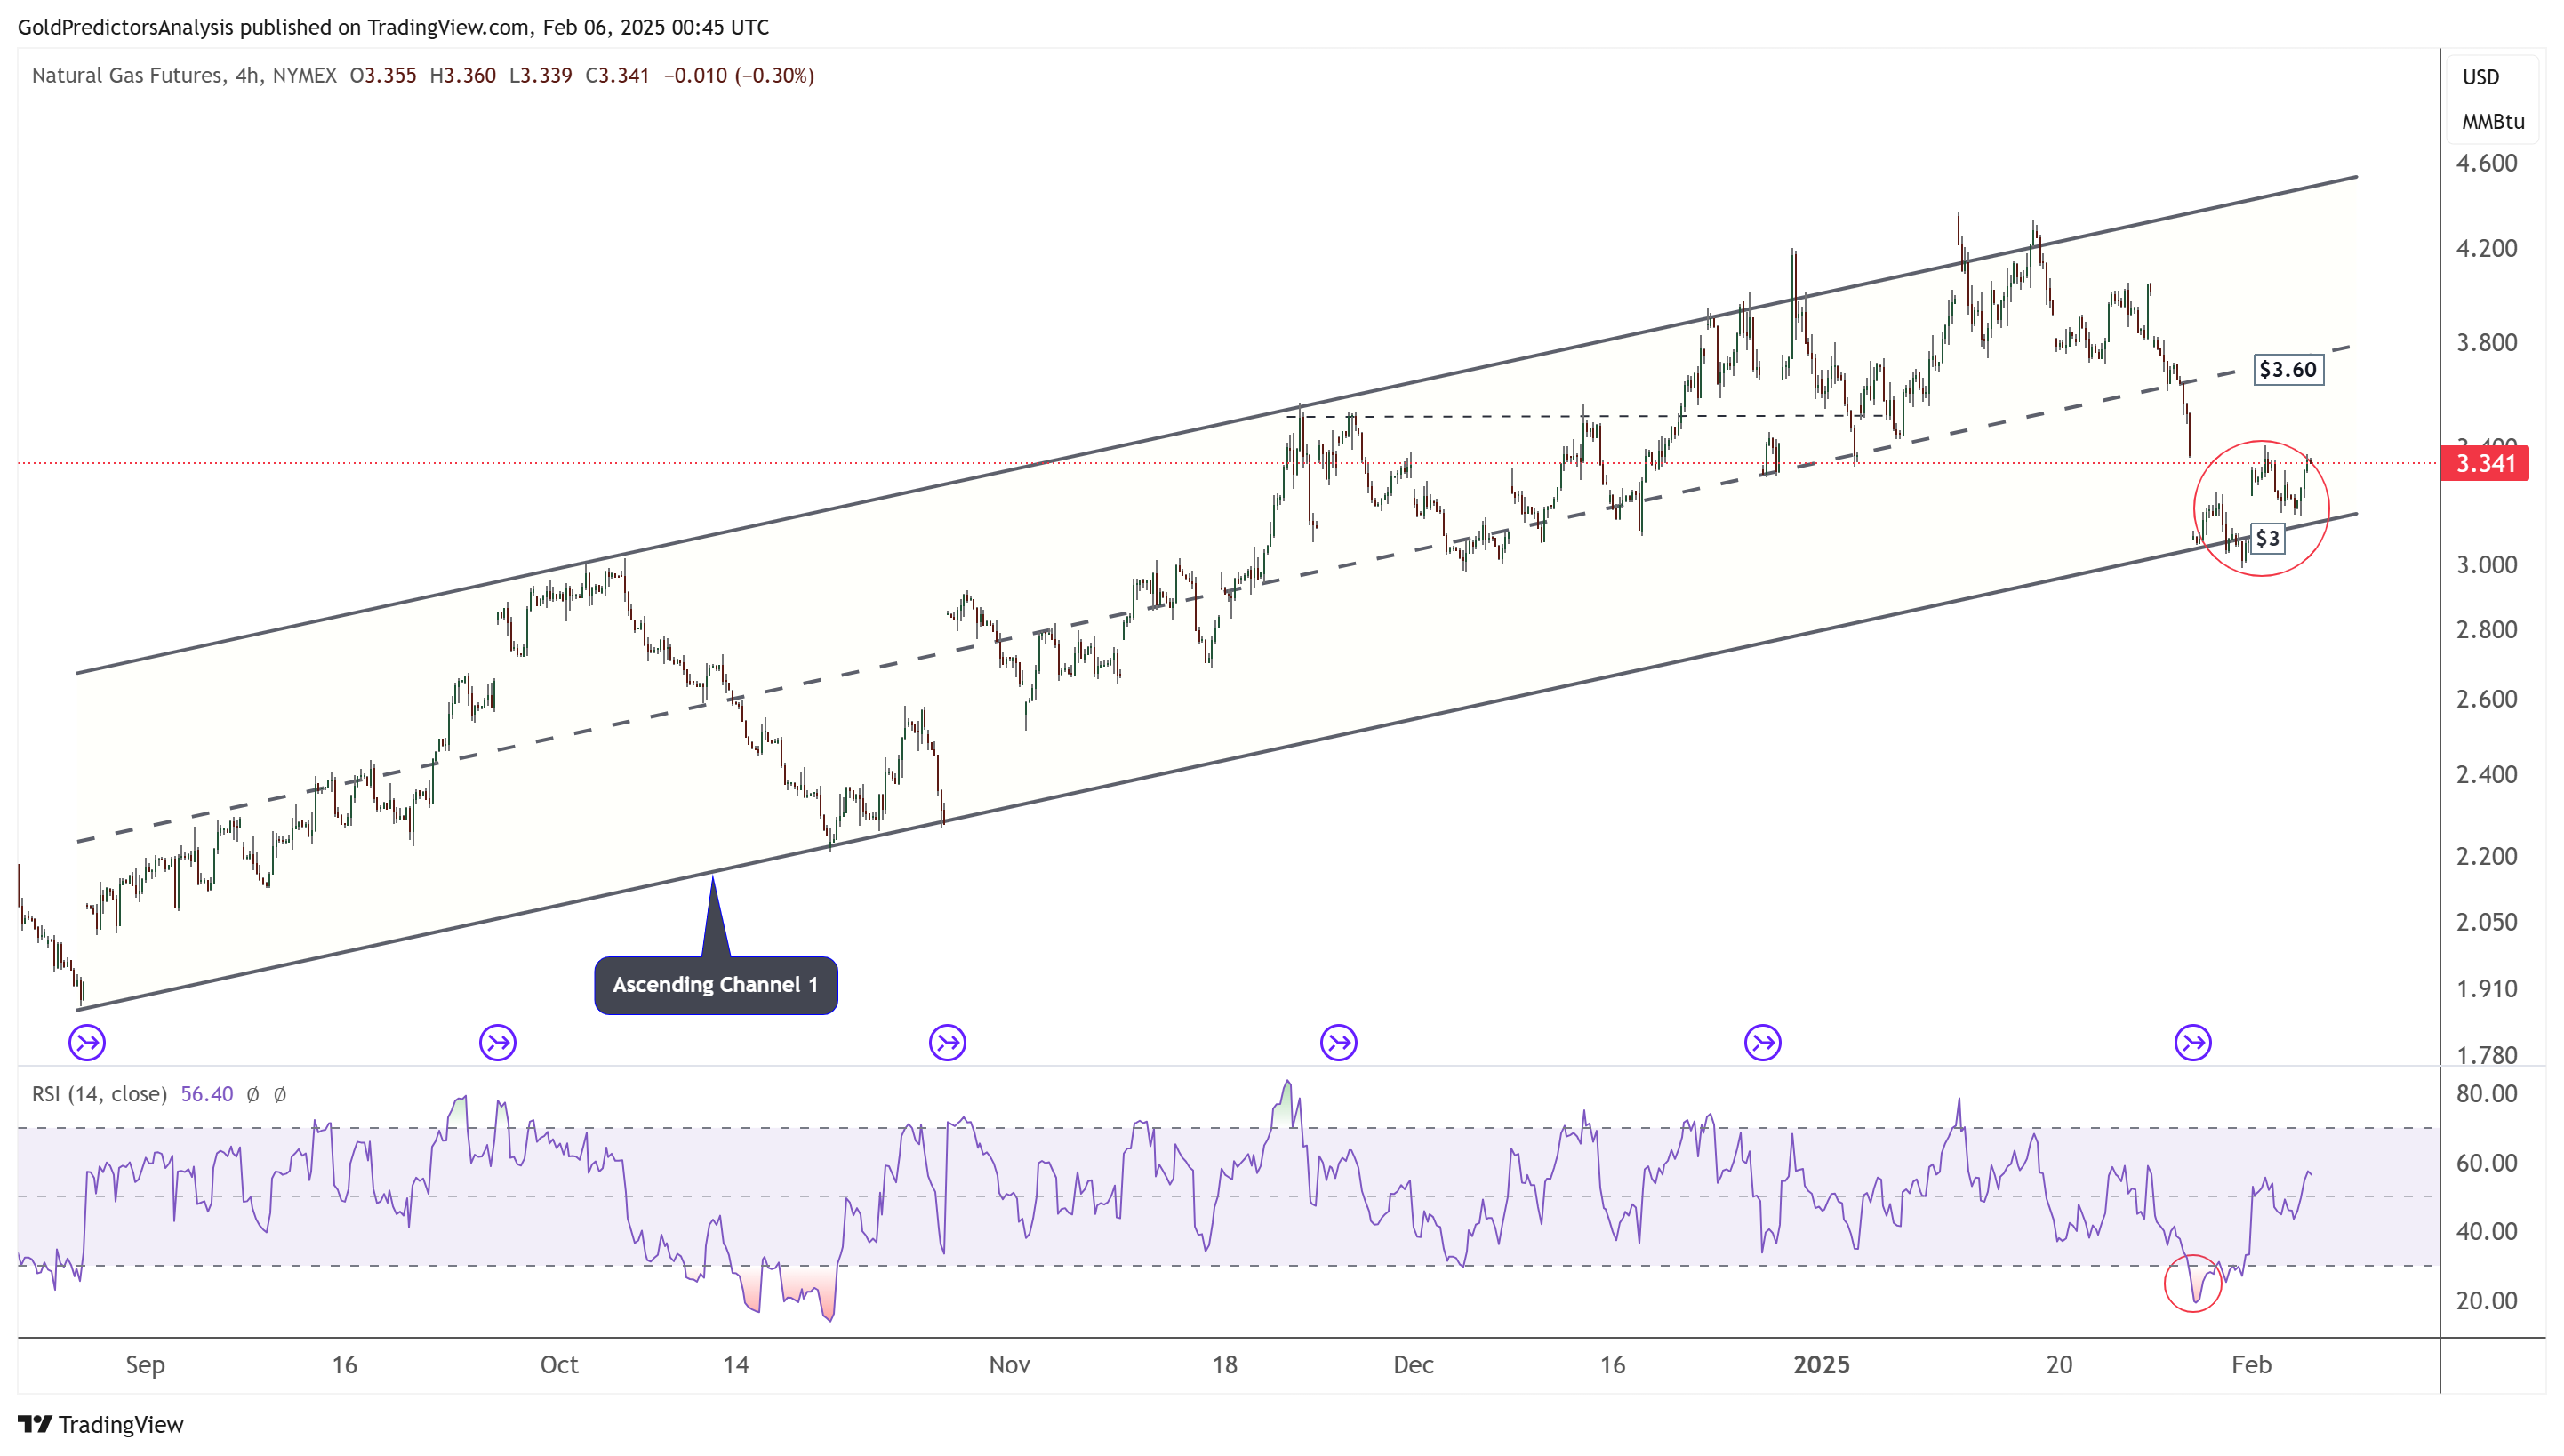
Natural Gas 4-Hour Chart – Ascending Channel
The 4-hour chart for natural gas also confirms strong support around $3. The price has formed an ascending channel, and a rebound from this channel suggests a strong upward trend. The RSI is rebounding from oversold levels, further strengthening the likelihood of an upward rally.
USD/CAD Technical Analysis
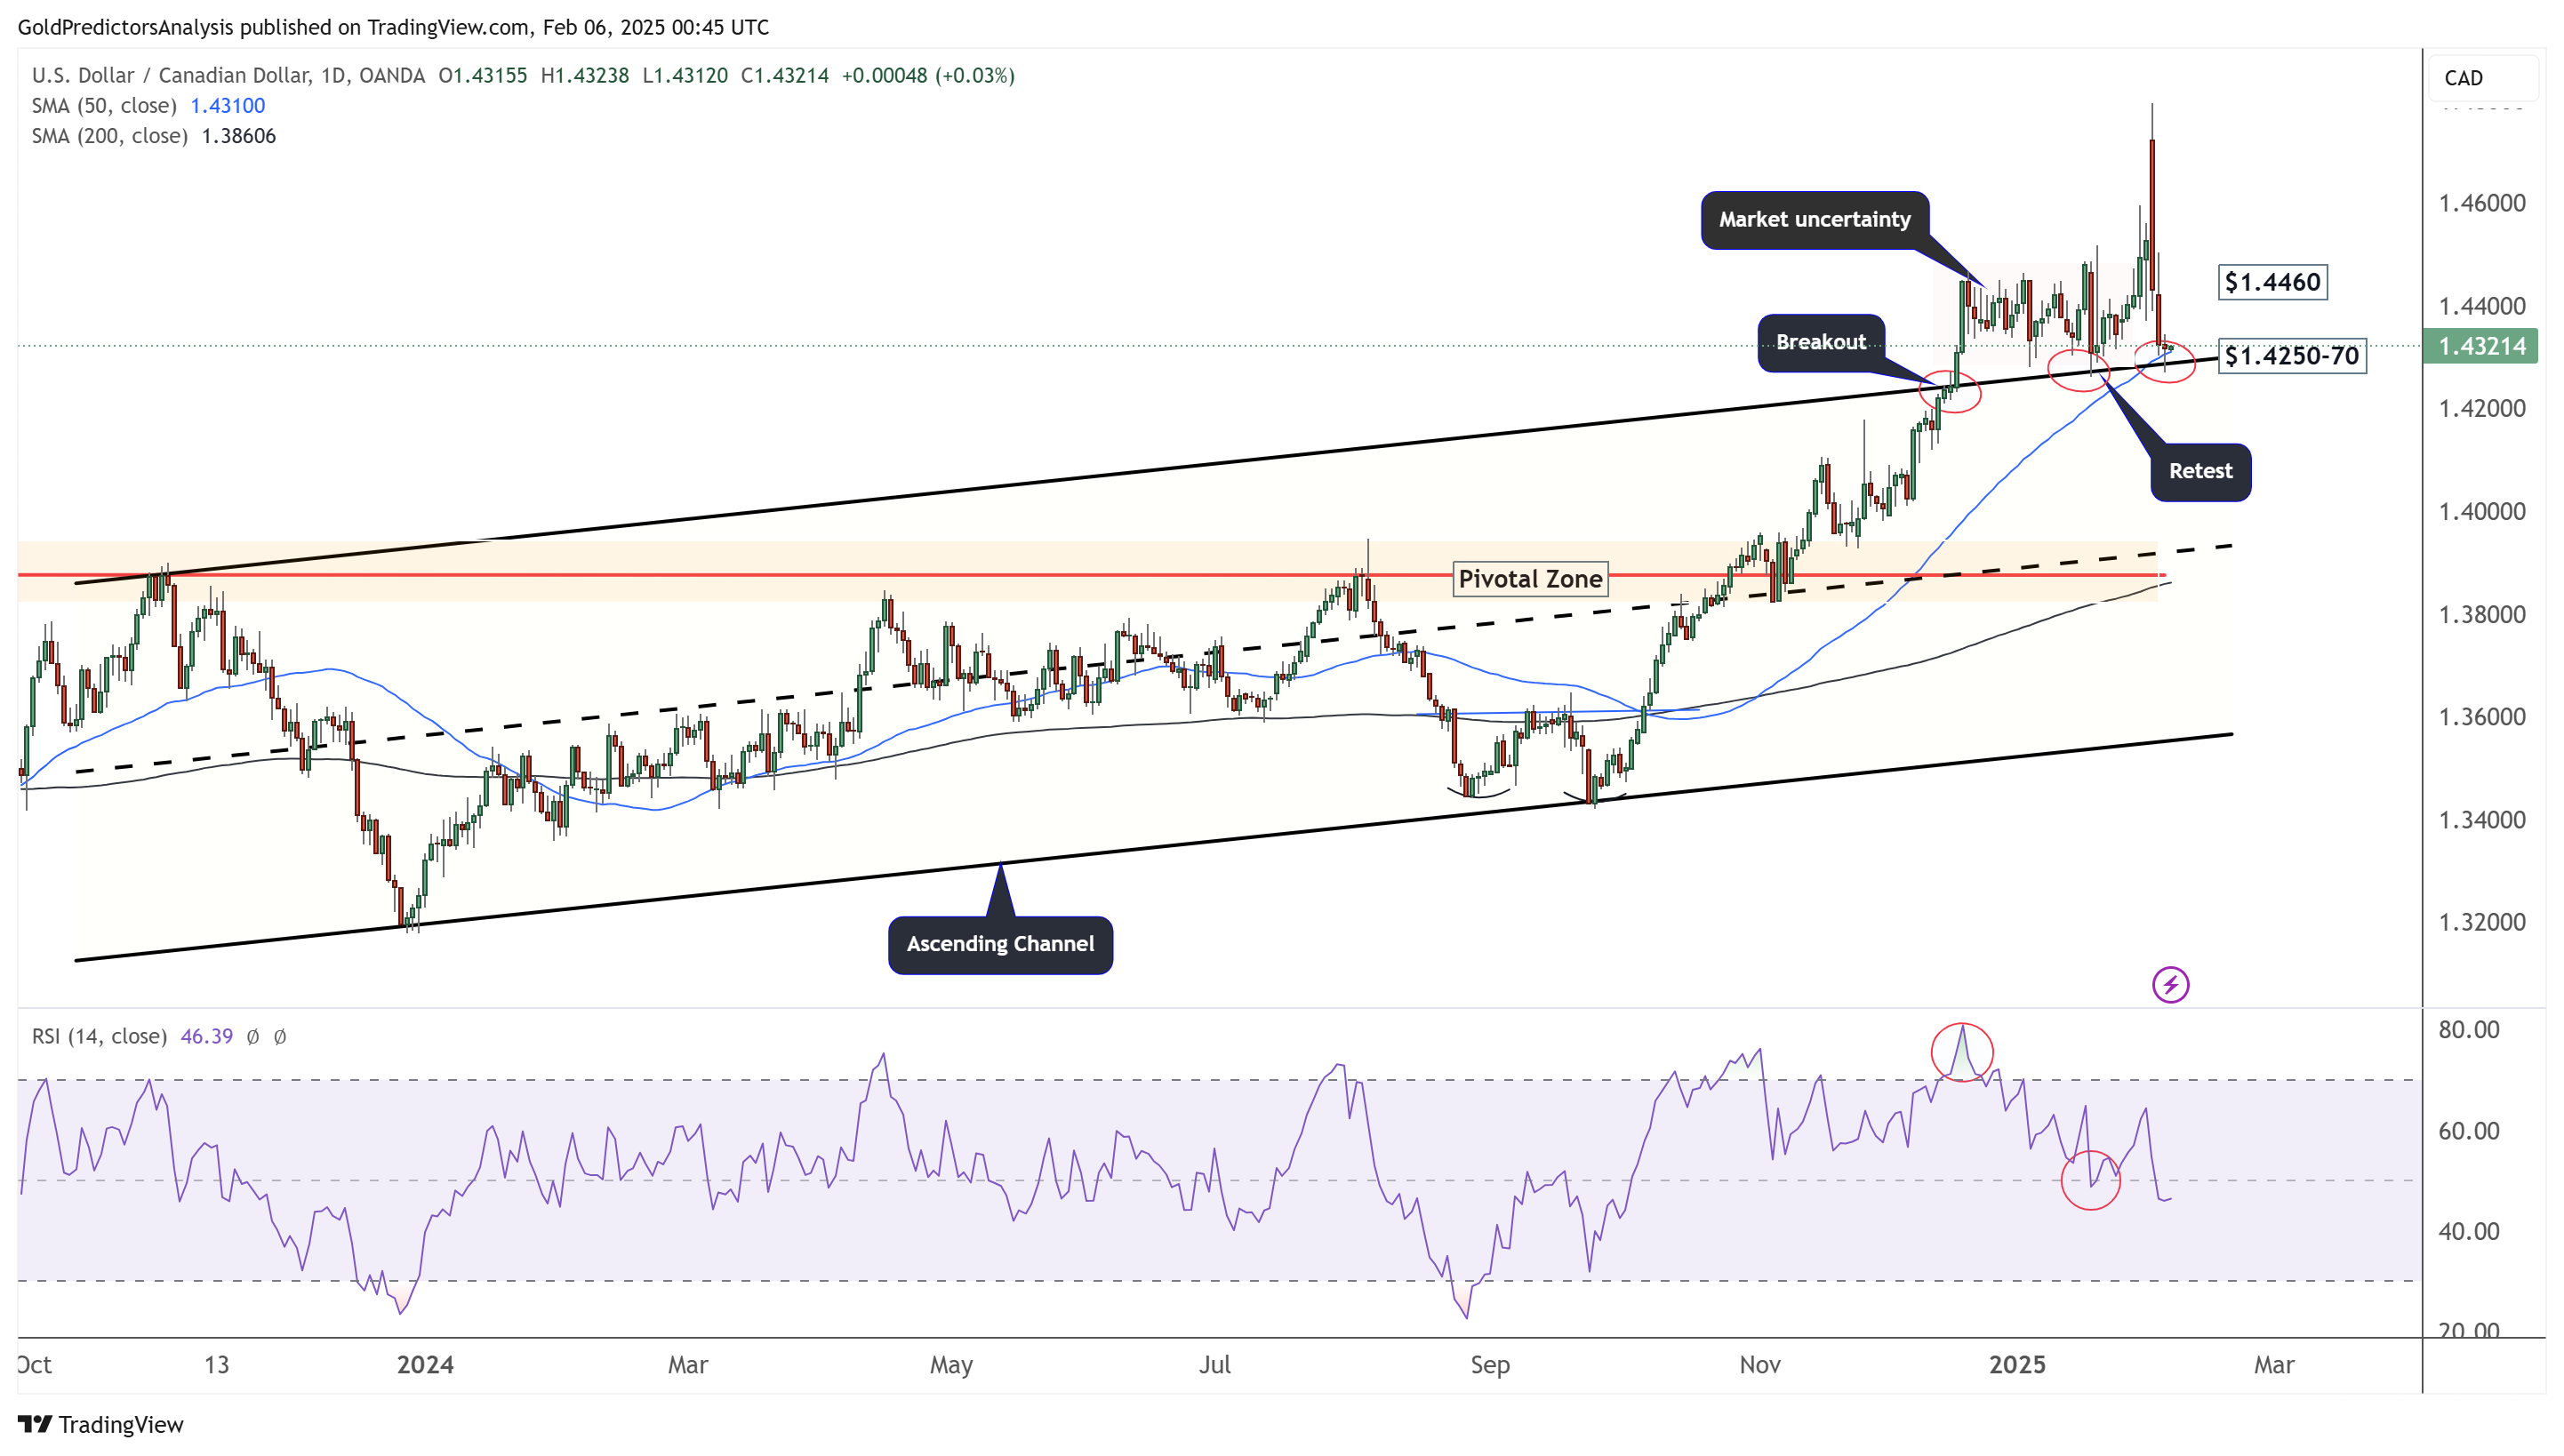
USD/CAD Daily – Market Uncertainty
The daily chart for USD/CAD shows market uncertainty following the breakout from the ascending channel. This uncertainty has resulted in strong moves, with USD/CAD spiking to $1.48 before reversing lower to $1.4270. The price has been hovering around the 50-day SMA for the past 24 hours, indicating a potential rebound from these levels. A break below $1.4250 would signal further downside for USD/CAD.
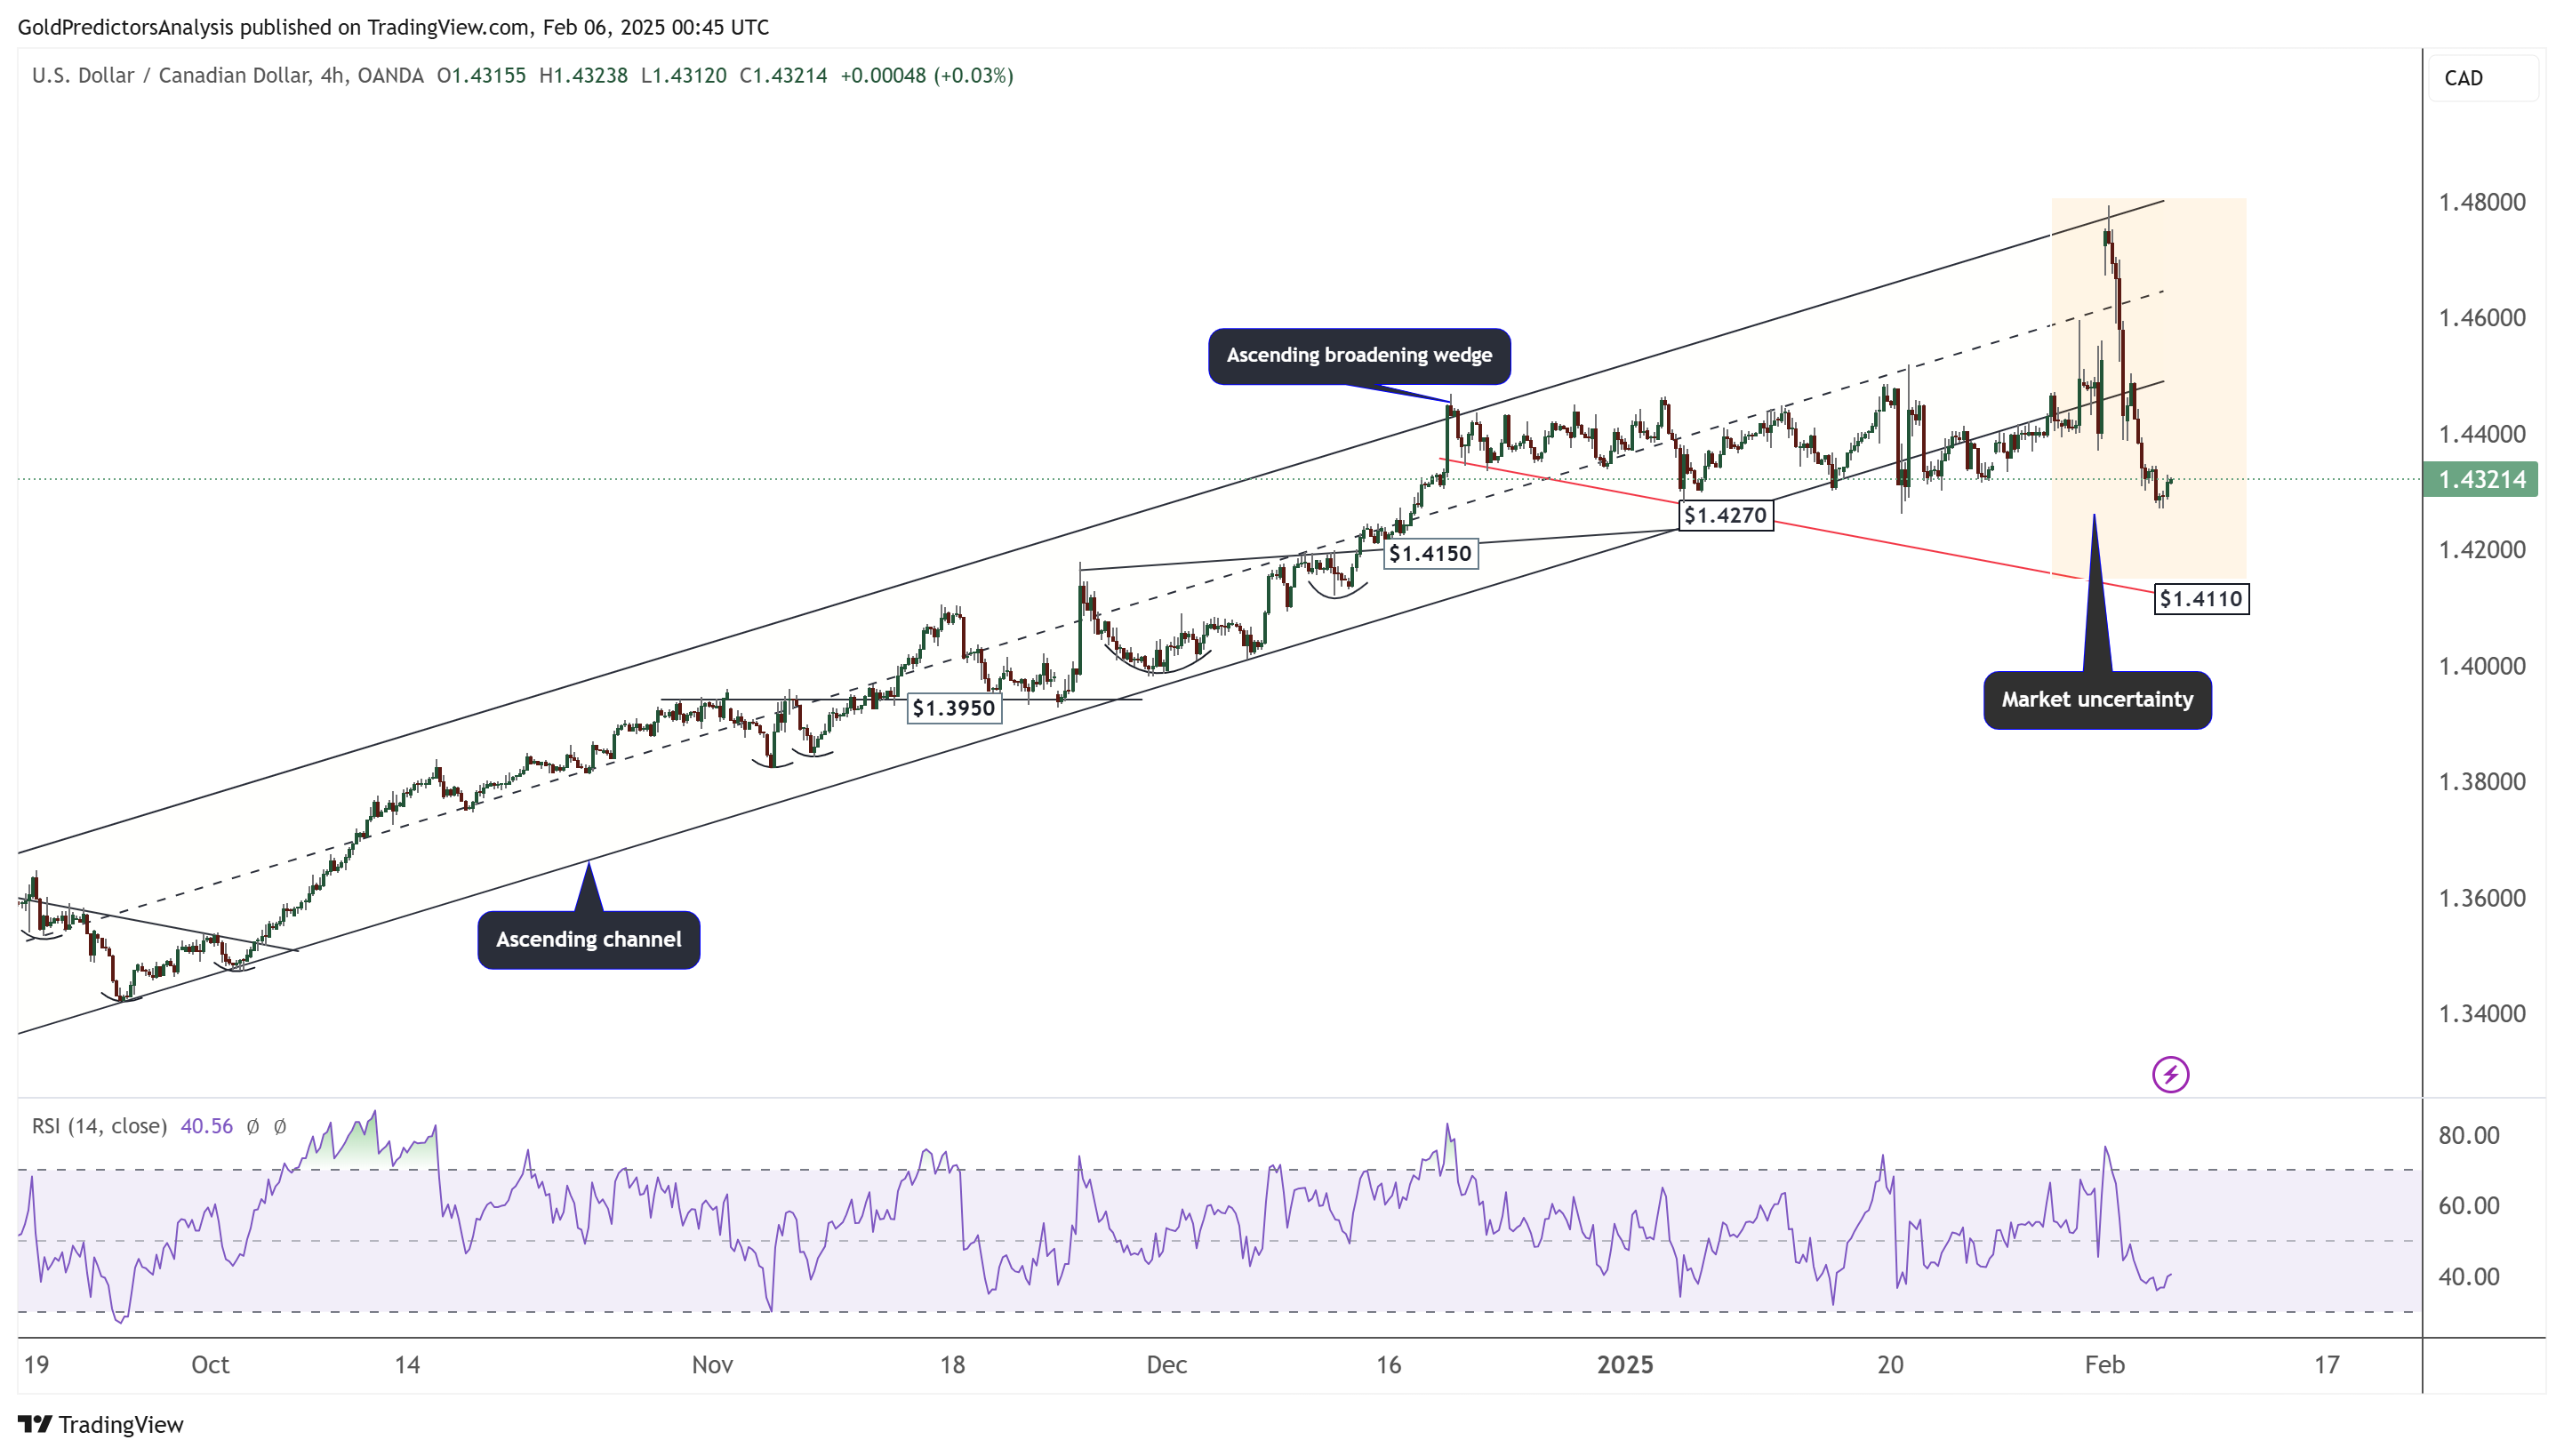
USD/CAD 4-Hour Chart – Market Uncertainty
The 4-hour chart for USD/CAD shows that the price remains within a wide range due to strong uncertainty in the financial market. The orange zone in the chart highlights market uncertainty, with strong support around $1.4110.
About the Author
Bob MasonChief Crypto Boss
TEST 30 He has written extensively for a broader audience and his current focus is on developments relating to the financial markets including, but not limited to currencies, commodities, alternative asset classes, and global equities.
Latest news and analysis


Advertisement