
Advertisement
Advertisement
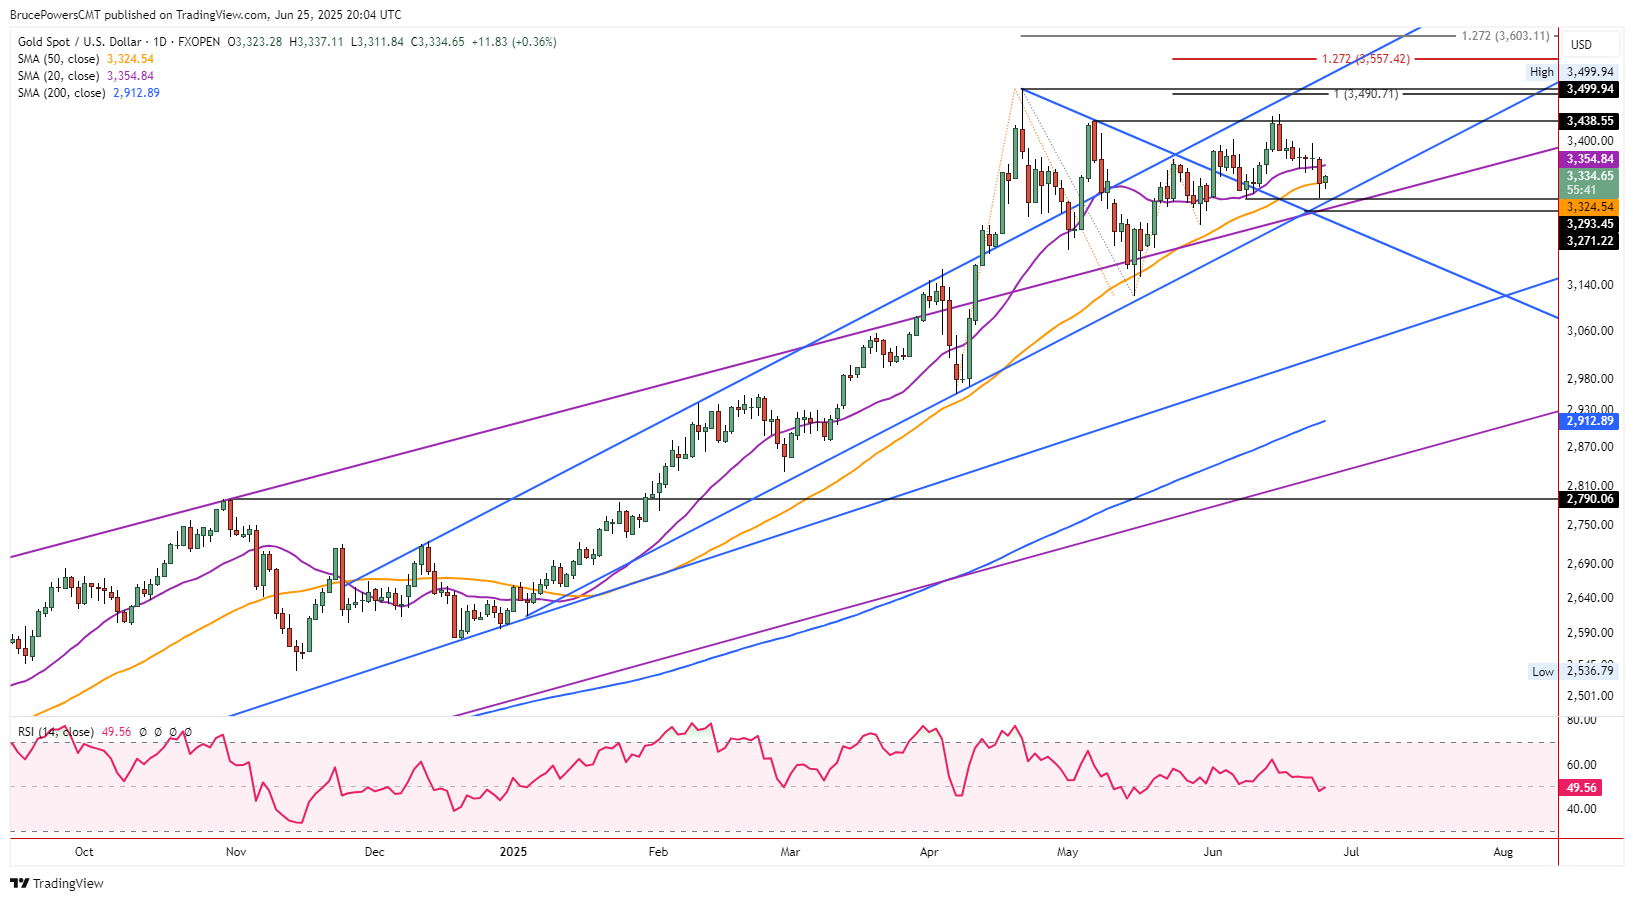
Gold (XAU/USD) Price Forecast: Downward Pressure Remains at Key Trend Support
By:
A drop below $3,272 would breach key trendlines, signaling a deeper correction, while a rally above $3,370 is needed to revive bullish momentum.
Gold consolidated in a narrow range on Wednesday around a potential support zone near the 50-Day MA. At the time of this writing, the high for the day was $3,337 and the low $3,312, while the 50-Day line is at $3,324. Therefore, gold remains clearly below the 20-Day MA, after closing below it on Tuesday. That was the weakest close relative to the 20-Day MA since the line was reclaimed on May 21. It had acted as dynamic support since then until it failed yesterday. Also, a weak relative closing price, essentially at the 50-Day MA, shows weakening demand.
Key Dynamic Support Being Tested
Nevertheless, what happens next will be more revealing. Dynamic support for the intermediate uptrend, beginning from January, is being tested. Gold needs to recover from support around the 50-Day MA if it is to retain the current trajectory. A decline below Tuesday’s low of $3,295 puts it at risk of dropping below an interim swing low at $3,293, which is part of the near-term uptrend that began following a test of support at the 50-Day MA. Other lower price levels that subsequently could see signs of support include the intersection of an uptrend and downtrend line (blue) around $3,272. There is also a top rising trend channel line (purple) crossing at the same point. Then, a little lower is a prior interim swing low at $3,245.
Several Lines Converge
The purple rising channel represents the upswing that began from the October 2023 lows. A decisive bull breakout of the channel triggered on April 10, followed by a retracement that successfully tested the price area around the line as support. The current pullback is a second test of support near the top purple channel line.
It represents a longer trend than a shorter rising trend channel (blue) that began from the January lows. The point of highlighting where the three lines meet is that a decline below $3,272 will mean that both a downtrend line and top channel line have been broken. If price then stays below that price level, it will confirm the bearish sentiment.
Strength Needed Above $3,370
Alternatively, support around the 50-Day MA holds and leads to a bullish reversal. An early sign of strength would be seen on a rally above today’s high, however, that would not be convincing enough to confirm a bullish reversal. Rather, a decisive rally above Tuesday’s high of $3,370 would be needed.
For a look at all of today’s economic events, check out our economic calendar.
About the Author
Bruce Powerscontributor
Bruce has been involved in the financial markets for over 20 years, as an analyst, trader, educator, and writer.


Advertisement