
Advertisement
Advertisement
Natural Gas Price Forecast: Tests 200-Day MA Amid Bearish Momentum
By:
With momentum fading and support near, natural gas could stabilize; however, the breach of key trendlines raises the risk of continued downside pressure.
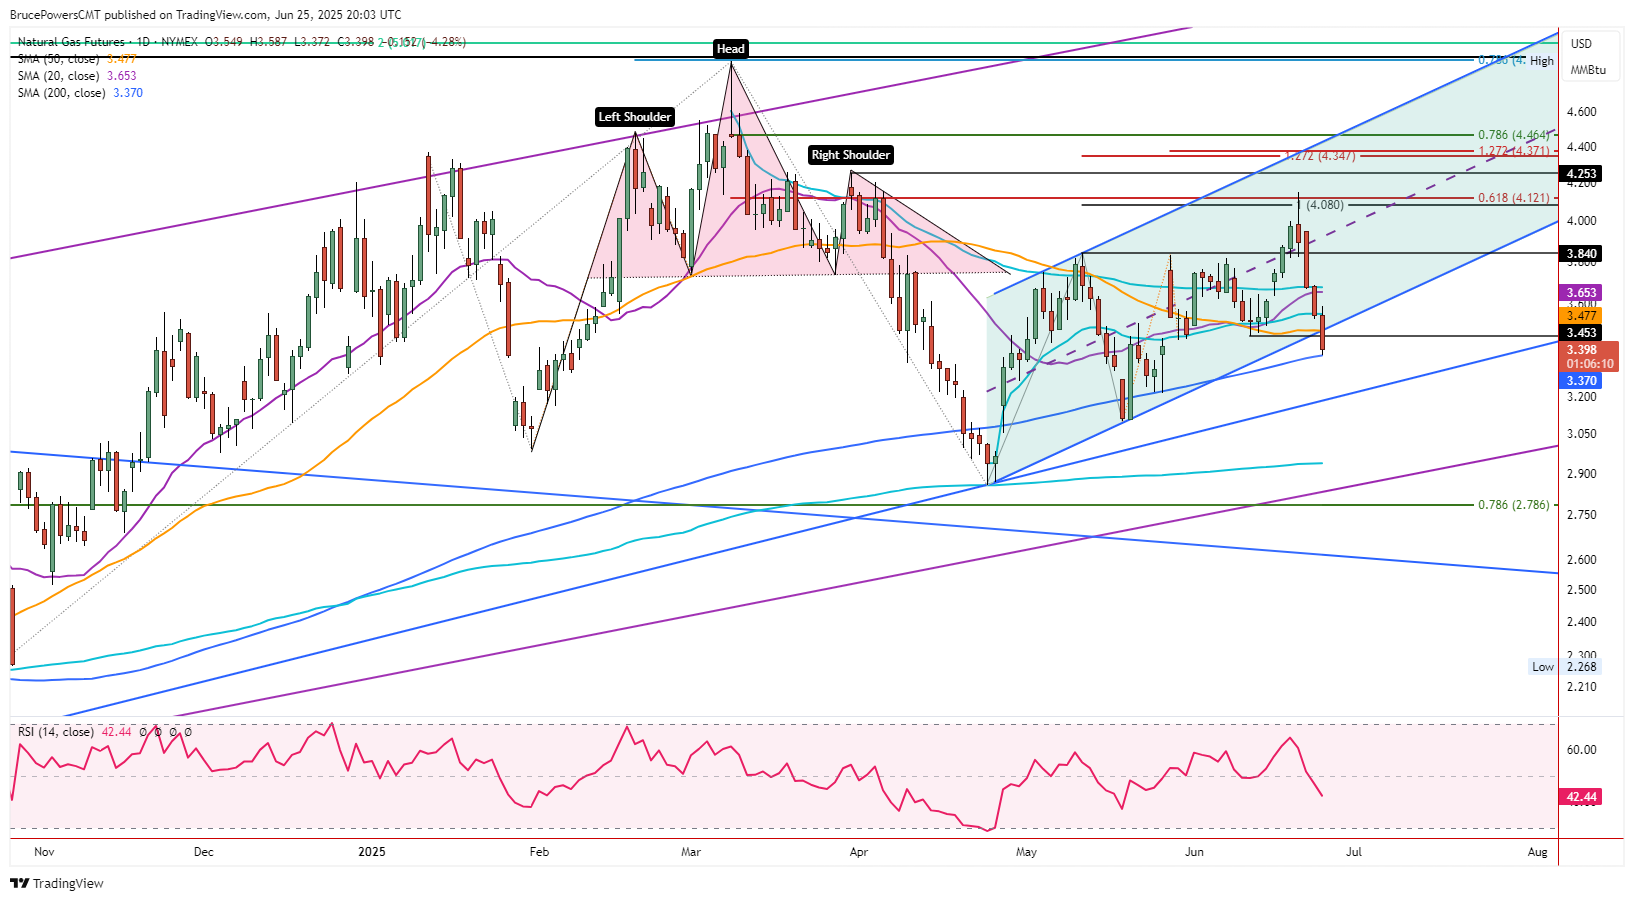
Natural gas fell to test support around the 200-Day MA on Wednesday, reaching a new pullback low of $3.37, at the time of this writing. The 200-Day line is currently at $3.37 as well. This marks the third instance since the March peak that the 200-Day MA has been tested as support. The two prior events led to brief declines below the 200-Day MA for as many as four days, before the line was reclaimed.
Today’s drop shows weakening demand as the 50-Day MA was broken, as well as a rising trendline that has represented dynamic support for the short-term uptrend, starting from the April swing low. And it looks like today’s closing price will be clearly below that trendline, as currently trading continues near the lows of the day.
Drop Below 4-Week Support
On a weekly basis, this week’s decline put the price of natural gas at a four-week low, confirming a bearish reversal following last week’s trend high of $4.15. The decline below the lower uptrend line shows the potential for a bearish continuation as the current uptrend shows early signs of possible failure. However, there is also a good chance that support will be seen around the 200-Day MA and lead to a bullish reversal. Today is the fourth consecutive day of declines and bearish momentum started near last week’s high. So, there is a chance that selling momentum will decline. Although there is no sign of it yet.
Measured Move Support Completion of Correction
It is also interesting to note that the prior bearish correction that followed the initial rally from the April swing low saw the price of natural gas decline by $0.74 (or 19.3%). That puts the current decline close to a match as it has led to a drop of as much as $0.78 (or 18.9%). When comparing price, the current decline exceeded the previous decline, but natural gas is now very close to matching on a percentage basis. Once there are similar swings, there is the potential for support to be seen.
Weekly Closing to Provide Clue
Since there are only two more trading days for the week, there is a risk that natural gas confirms the recent bearish signals on a weekly basis. As noted above, support for the past several weeks was broken this week. The lower and therefore more significant weekly low was at $3.45, while last week’s low was $3.63.
For a look at all of today’s economic events, check out our economic calendar.
About the Author
Bruce Powerscontributor
Bruce has been involved in the financial markets for over 20 years, as an analyst, trader, educator, and writer.


Advertisement