
Advertisement
Advertisement
Gold (XAU/USD) Price Forecast: Tests Trend Support, Poised for Bullish Continuation
By:
Gold tests trend support around $3,347; if it holds and rebounds above $3,388, the uptrend could continue toward resistance at $3,451.
Gold dipped to a new pullback low of $3,347 on Thursday, where it found support aligned with the 20-Day MA. A successful test of support on the 20-Day line is bullish if it is retained. The prior minor pullback also bounced off support of the 20-Day line, as well as the previous pullback to that, the area around the 20-Day line showed support. A minor sign of weakness was indicated by a break of the short uptrend line today.
But it becomes more significant if support fails at the 20-Day MA. Potential support around the 20-Day MA is the maximum anticipated pullback if the short-term uptrend is to be retained and therefore the potential for a bullish trend continuation signal in the near-term. Be aware that futures closed early on Thursday due to a U.S. holiday.
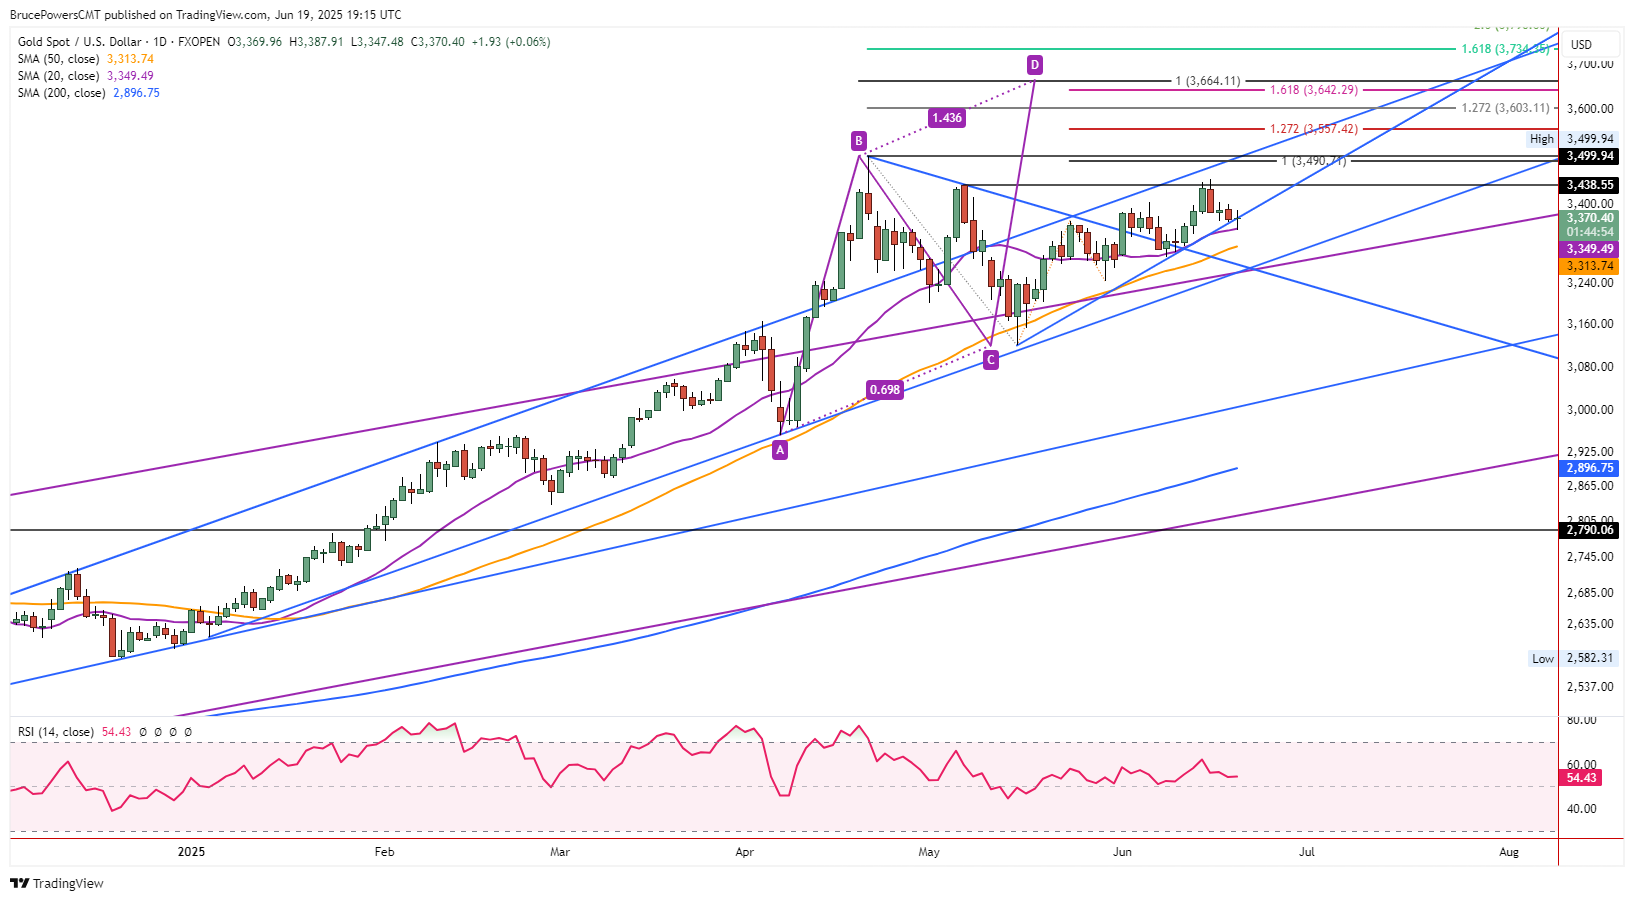
Bullish Above $3,388
A one-day bullish breakout above today’s high of $3,388 will indicate that support was retained at the 20-Day line. The short-term uptrend of higher swing highs and higher swing lows, beginning from the May swing low, would be expected to continue at that point. Key resistance would then be at the recent high of $3,451, with a decisive breakout above that level signaling a continuation of the short-term uptrend and a bullish reversal, above $3,449, of the recent bearish correction.
Weak Momentum is a Concern
There is a concern that bullish momentum following a recent trendline breakout has been weak. This is evidenced by the failure to hold above the $3,439 lower swing high. Today’s low of $3,347 is near-term support and if it is broken a break of the 20-Day line will have also occurred. Lower price levels for possible support are the 50-Day MA, now at $3,314, and prior support at the prior interim swing low of $3,293. The 50-Day line is a key dynamic trend indicator.
50-Day Moving Average is Key
Gold bounced off support around the 50-Day line on each of the two previous bearish retracements. It should do so again if the intermediate bull trend, starting from the November swing lows, is to be retained. Nonetheless, if drop below the line occurs, support might be seen around the intersection of several trendlines at $3,271, or an interim swing low at $3,2,45.
For a look at all of today’s economic events, check out our economic calendar.
About the Author
Bruce Powerscontributor
Bruce has been involved in the financial markets for over 20 years, as an analyst, trader, educator, and writer.


Advertisement