
Advertisement
Advertisement
Natural Gas Price Forecast: Gas Extends Rally, Eyes Higher Price
By:
With consistent higher closes and a strong uptrend, natural gas shows bullish continuation potential, as it contacts a resistance zone up to $4.17.
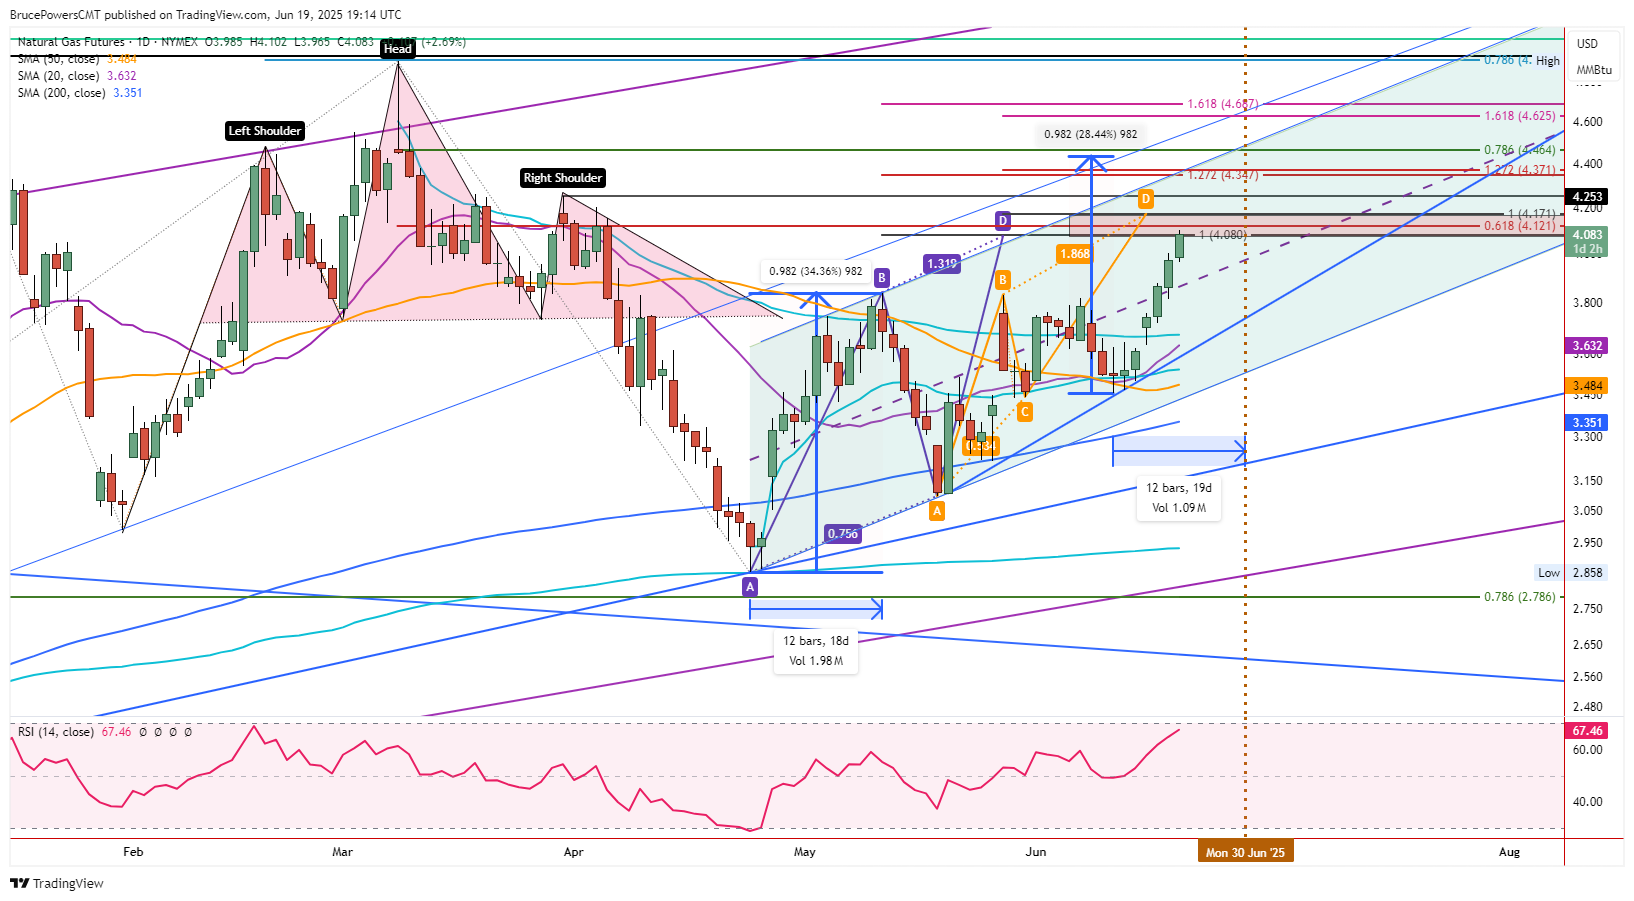
Natural gas continued to advance on Thursday to a new rally high of $4.10. Demand remained strong at the close, which may continue to be seen during Friday’s trading session. Today was a holiday in the U.S., so futures markets closed early. Nonetheless, Thursday completed four consecutive days of higher daily lows and higher highs, and five days of closing prices near the high of the daily range. These are bullish signs.
ABCD Target Reached
Despite bullish indications, an initial target and therefore potential resistance, marked by a rising ABCD pattern (purple), was hit at $4.08. Just something to be aware of, as a potential resistance zone begins from there and up to $4.17. The higher price point is the completion of a smaller ascending ABCD pattern (orange). In between the two price levels there is the 61.8% Fibonacci retracement at $4.12. Once there is symmetry in gains between two consecutive upswings, there is the possibility of resistance.
Strong Bullish Momentum
Of course, a rally above today’s high will provide a bullish continuation signal, with the two initial targets being $4.12 and $4.17. A decisive continuation signal above $4.17, however, would show very strong bullish momentum and therefore increase the possibility of reaching an initial higher target zone relatively rapidly.
Measured Moves Show Higher Prices
It is interesting to note that the first measured move from the April swing low (AB, purple) was $0.98 (blue vertical). Given signs of aggressive buying seen this week, the current advance has the potential to match the first rally in the current short-term uptrend. Symmetry in price would be established at that point, and that makes it as a potential target. However, the similarity in the initial speed of this upswing relative to AB, is the clue that the market is providing.
Time Symmetry Potential
There is also the potential for symmetry in time to occur between the two swings. The initial AB advance completed in 12 days with only two instances of a one-day pullback. Notice that the current advance reaches 12 days on June 30. Whether the upside target is reached or not, a continuation of an aggressive rally is indicated and the results following the first one-day lower daily low will provide the next clue. An immediate recovery would validate the potential for a matching measured move.
For a look at all of today’s economic events, check out our economic calendar.
About the Author
Bruce Powerscontributor
Bruce has been involved in the financial markets for over 20 years, as an analyst, trader, educator, and writer.


Advertisement