
Advertisement
Advertisement
Gold (XAUUSD) Drops from $3400 Resistance While Silver (XAGUSD) Breaks Above $35
By:
Key Points:
- Gold (XAUUSD) drops following the Nonfarm Payrolls data and shows bearish price action.
- Silver (XAGUSD) breaks above $35 and continues to trend higher.
- US Dollar Index (DXY) consolidates within a broader downtrend and is approaching resistance.

Gold (XAUUSD) prices showed weakness during Monday’s Asian trading session, hovering around the $3,300 level. This weakness was driven by stronger-than-expected US jobs data, which supported the US dollar and limited gold’s upside potential. The chart below shows that Nonfarm Payrolls increased by 139,000 in May, surpassing expectations of 130,000. Meanwhile, the unemployment rate remained steady at 4.2%, further strengthening the US dollar.
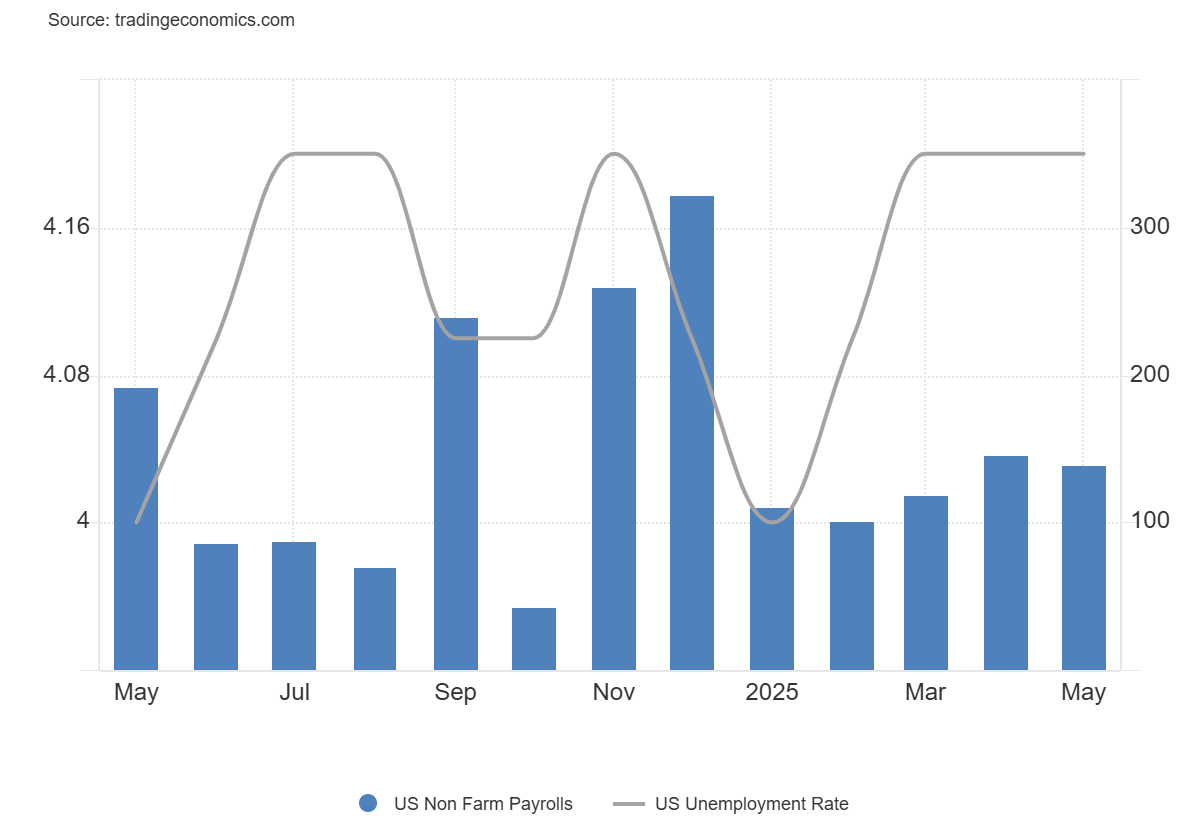
These solid labor figures have reduced market expectations for near-term Fed rate cuts. As a result, Federal Funds Futures now indicate that the Fed is likely to keep rates unchanged at its next two meetings. A stable interest rate outlook and a strong dollar typically pressure gold prices, as they increase the opportunity cost of holding the non-yielding asset.
However, ongoing trade uncertainty may provide near-term support for gold. Investors are awaiting the US-China trade talks scheduled in London on Monday. Any negative outcome or renewed tariff threats from President Trump could revive safe-haven demand and help limit downside risks for gold.
On the other hand, the silver (XAGUSD) has broken a key level, as the gold-to-silver (XAU/XAG) ratio has hit strong resistance at 102.50. The sharp correction in the ratio from that resistance level has pushed silver prices higher from the key resistance at $35.
Gold Technical Analysis
XAUUSD Daily Chart – Correction from $3400
The daily chart for spot gold shows that the price has encountered strong resistance near the $3,400 region. After forming this resistance, the price began to decline following the release of strong US jobs data.
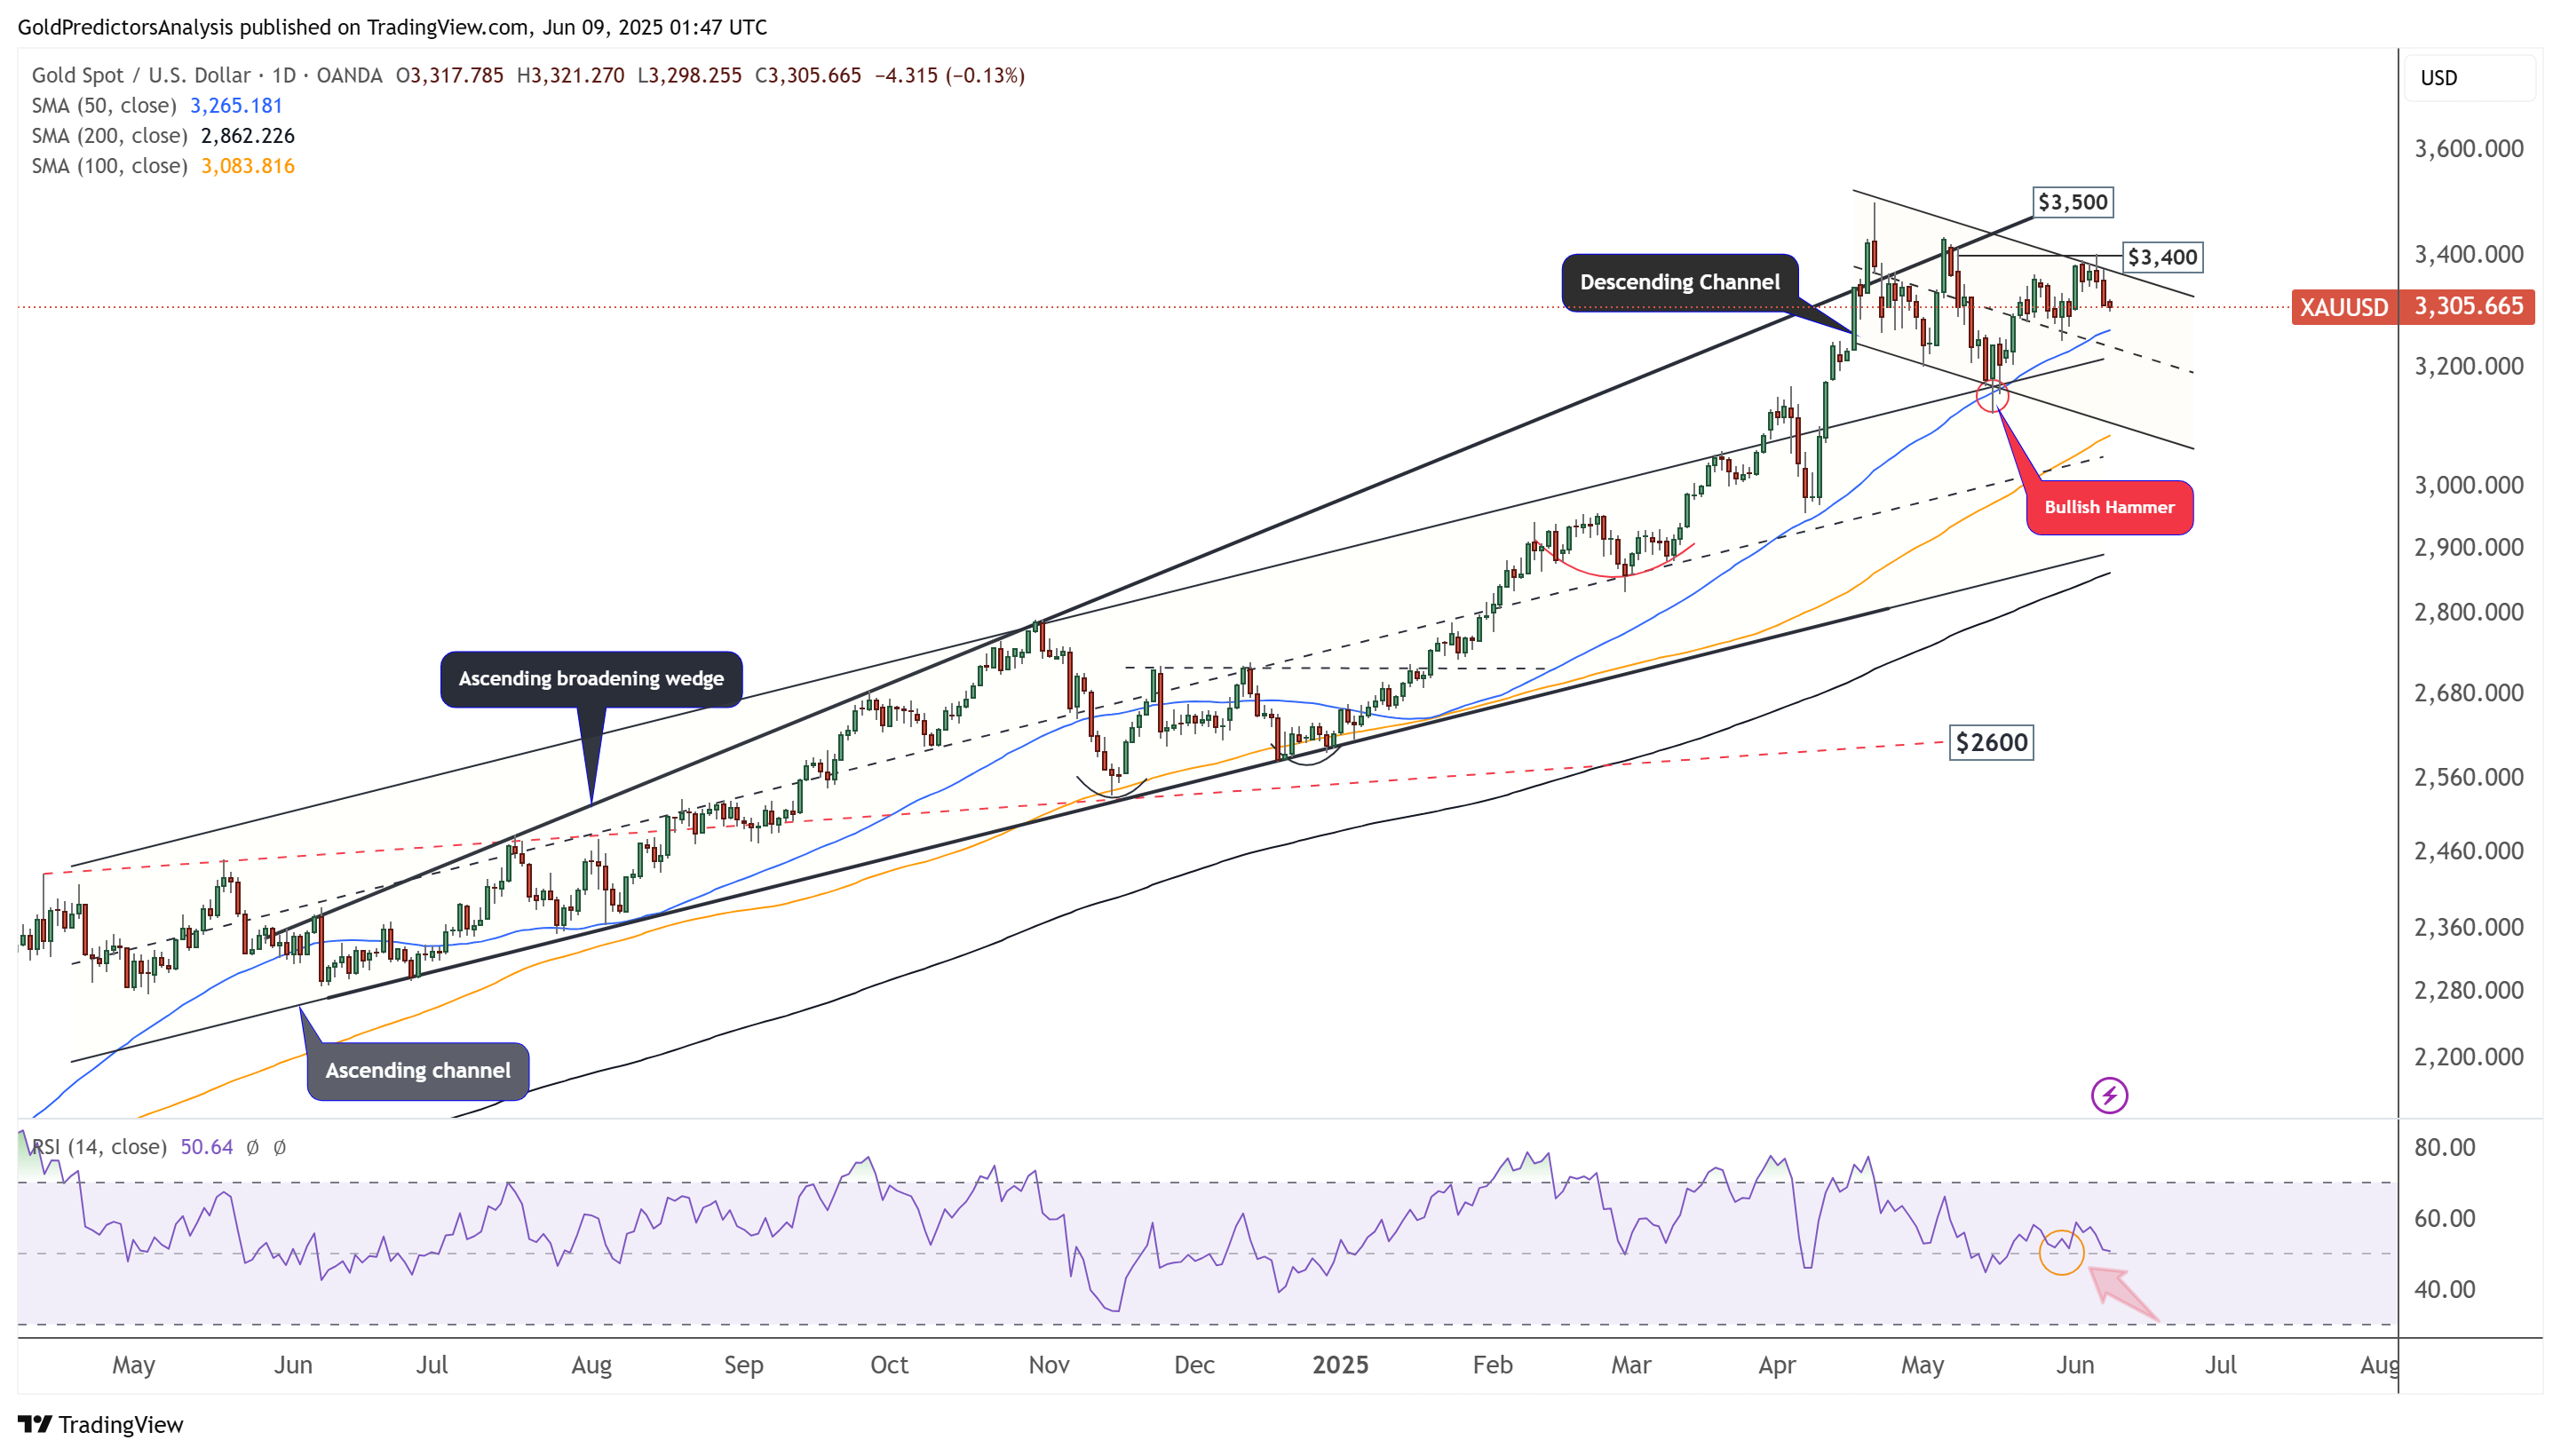
As gold pulled back from the $3,400 level, it formed another descending channel. A break above this region would likely trigger a strong move to the upside.
Despite the current weakness, the RSI remains above the mid-level, indicating indecision in the trend rather than clear bearish momentum.
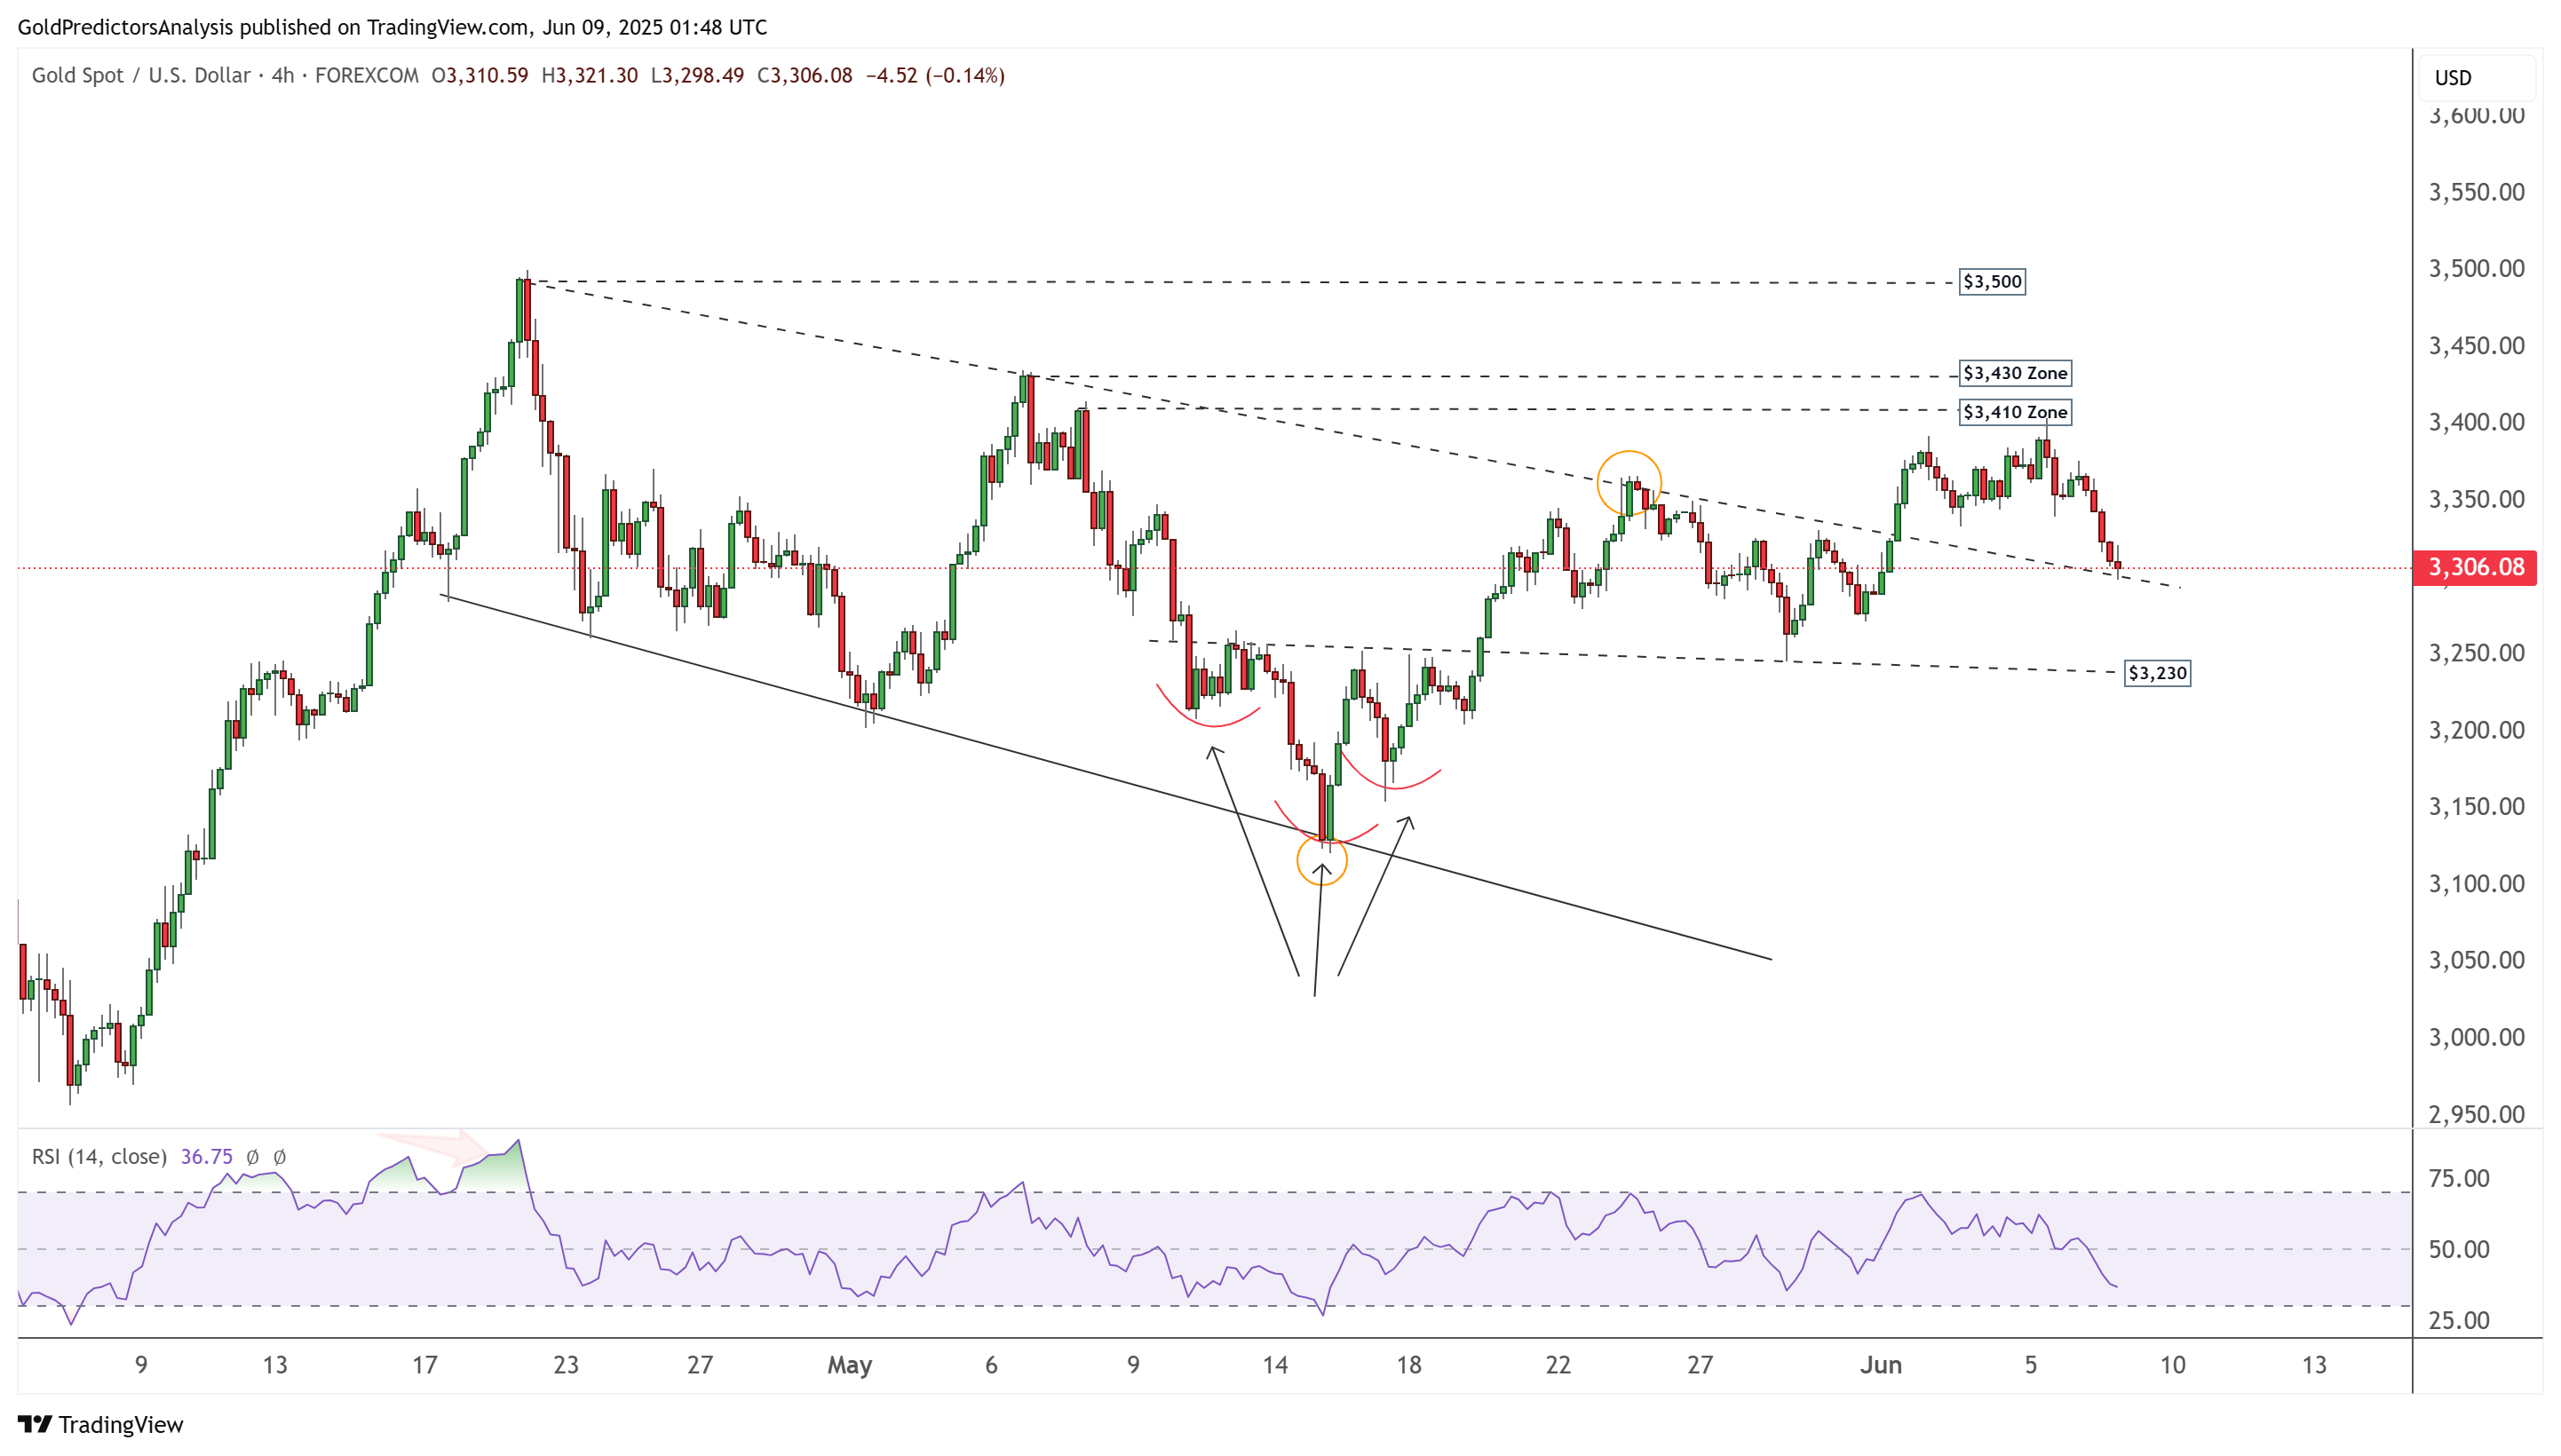
XAUUSD 4-Hour Chart – Correction
The 4-hour chart for spot gold shows that the price is breaching below the black dotted trendline, which had previously been broken to the upside. Strong support lies at the neckline of the inverted head and shoulders pattern, near $3,230. However, a break below $3,200 could trigger further downside toward the $3,150 level. To regain bullish momentum, a break above $3,430 is needed.
Silver Technical Analysis
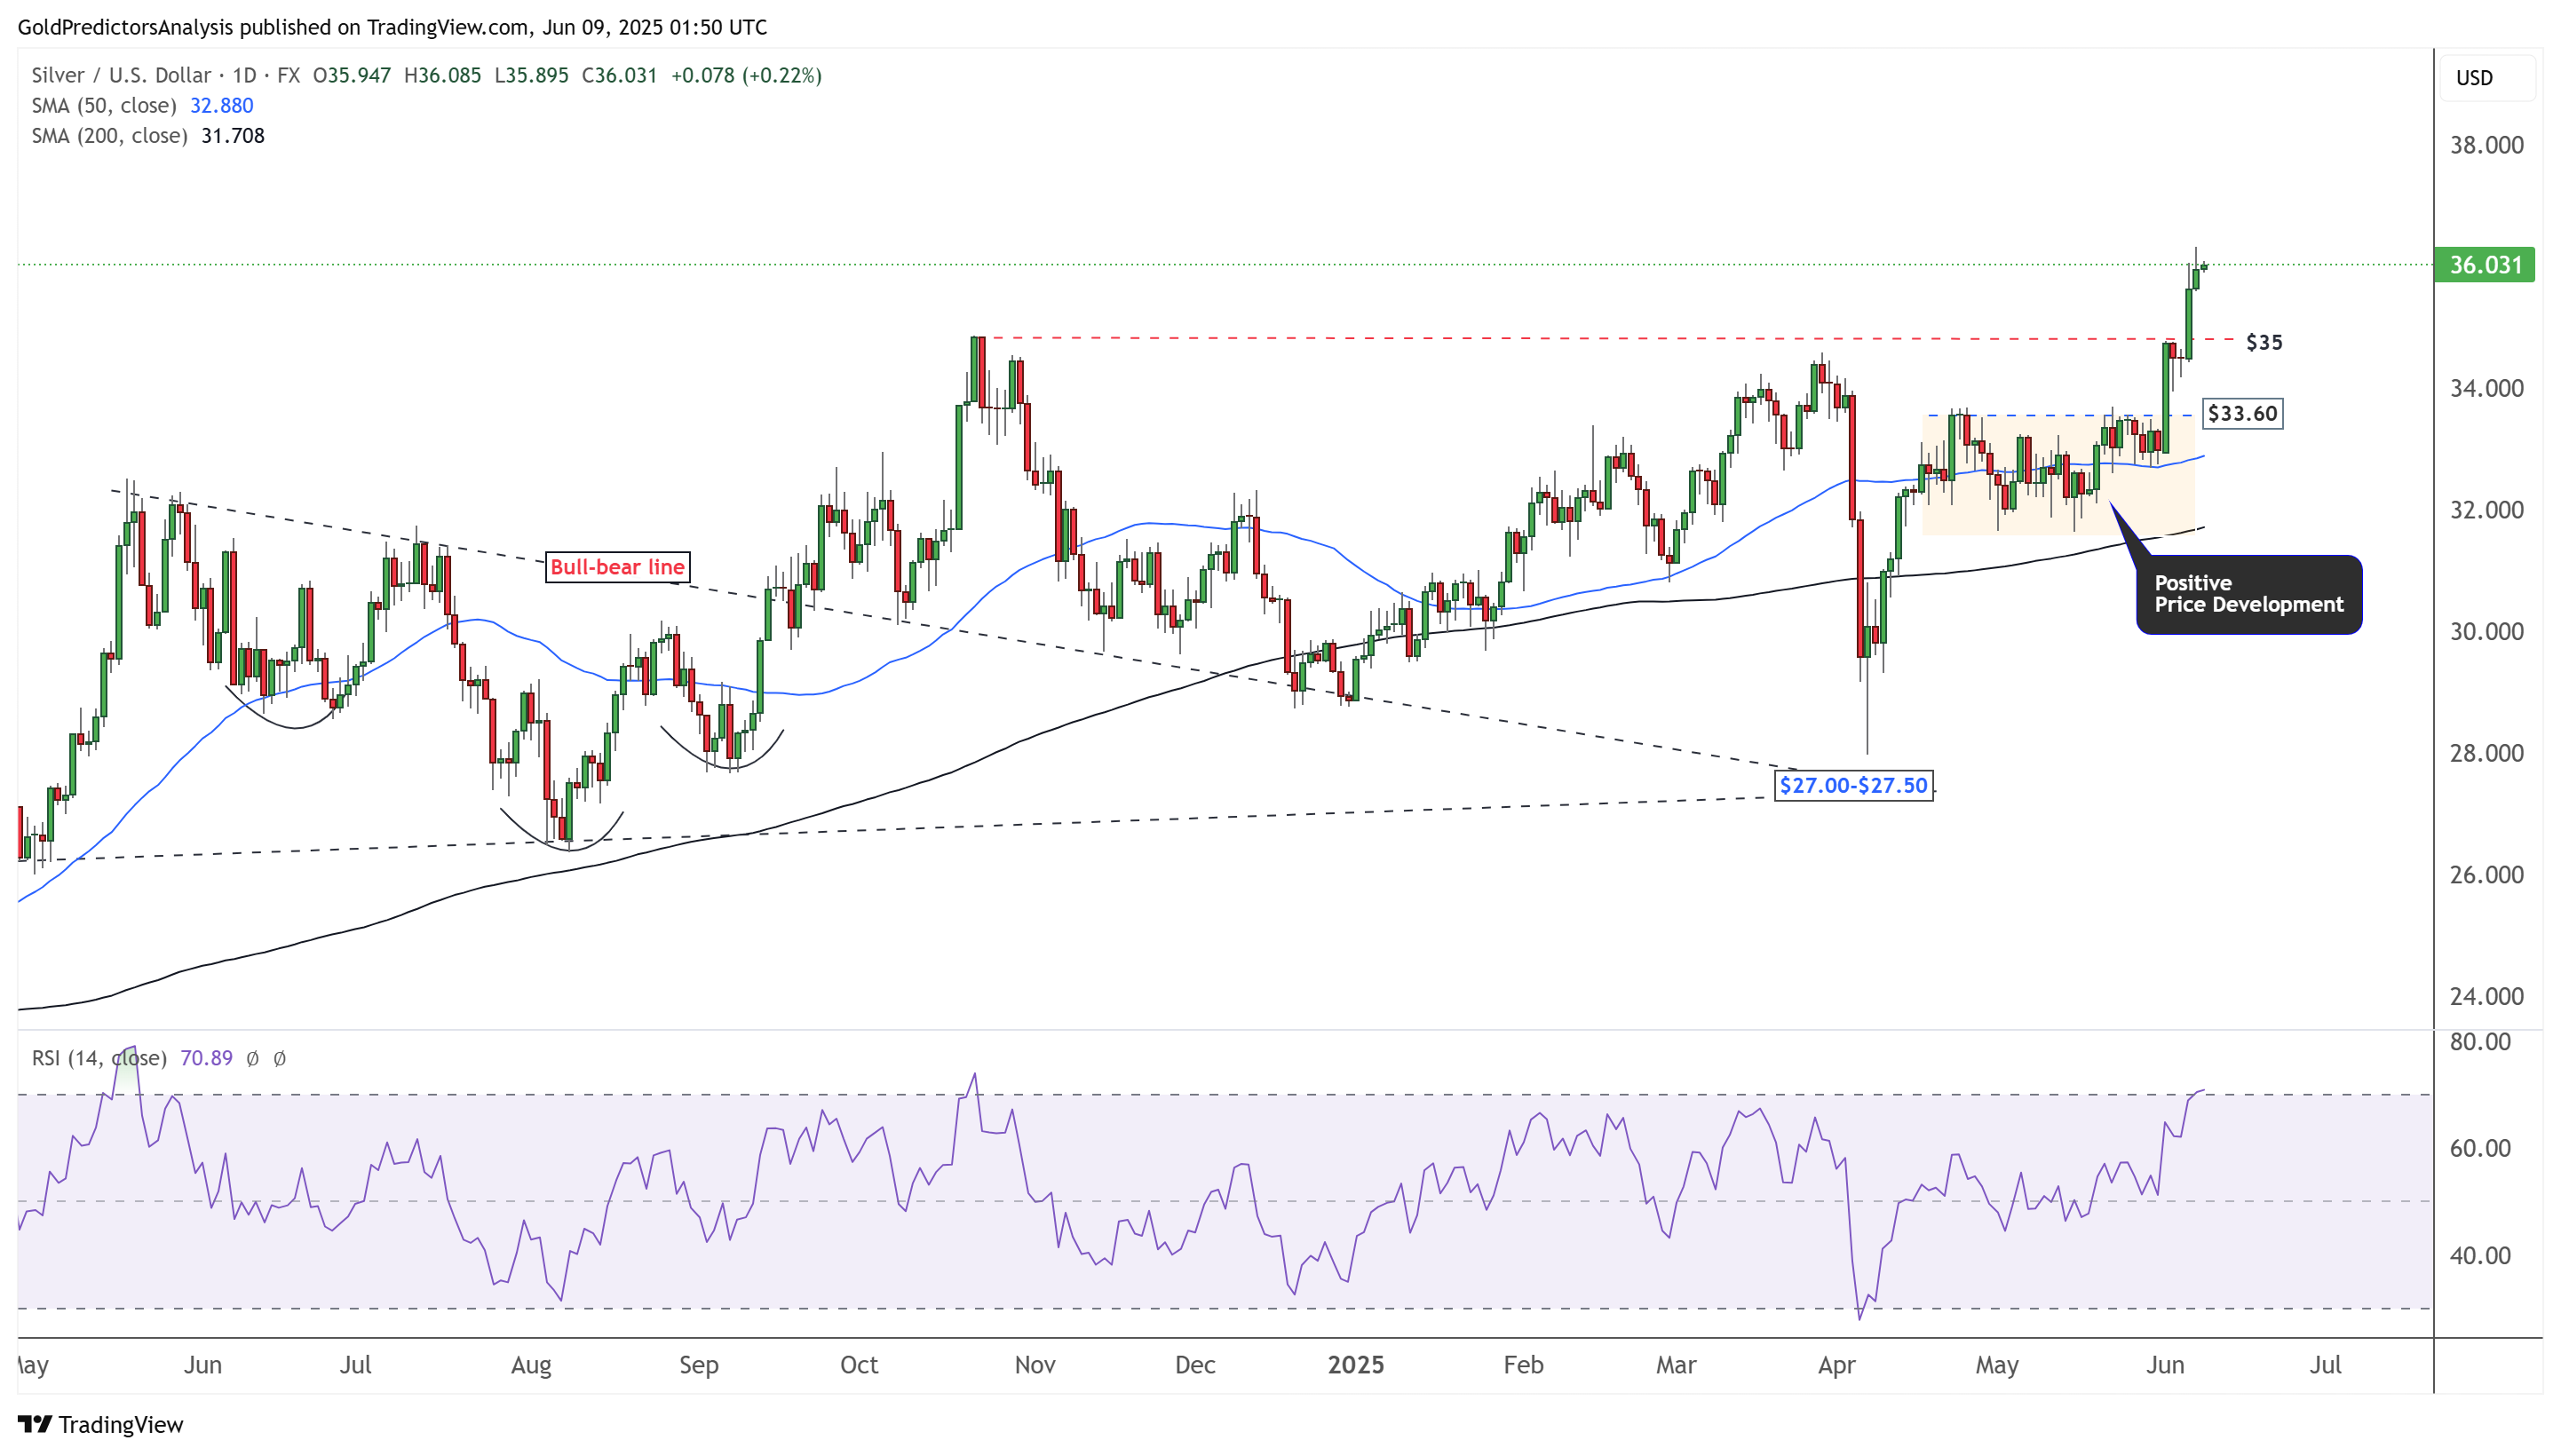
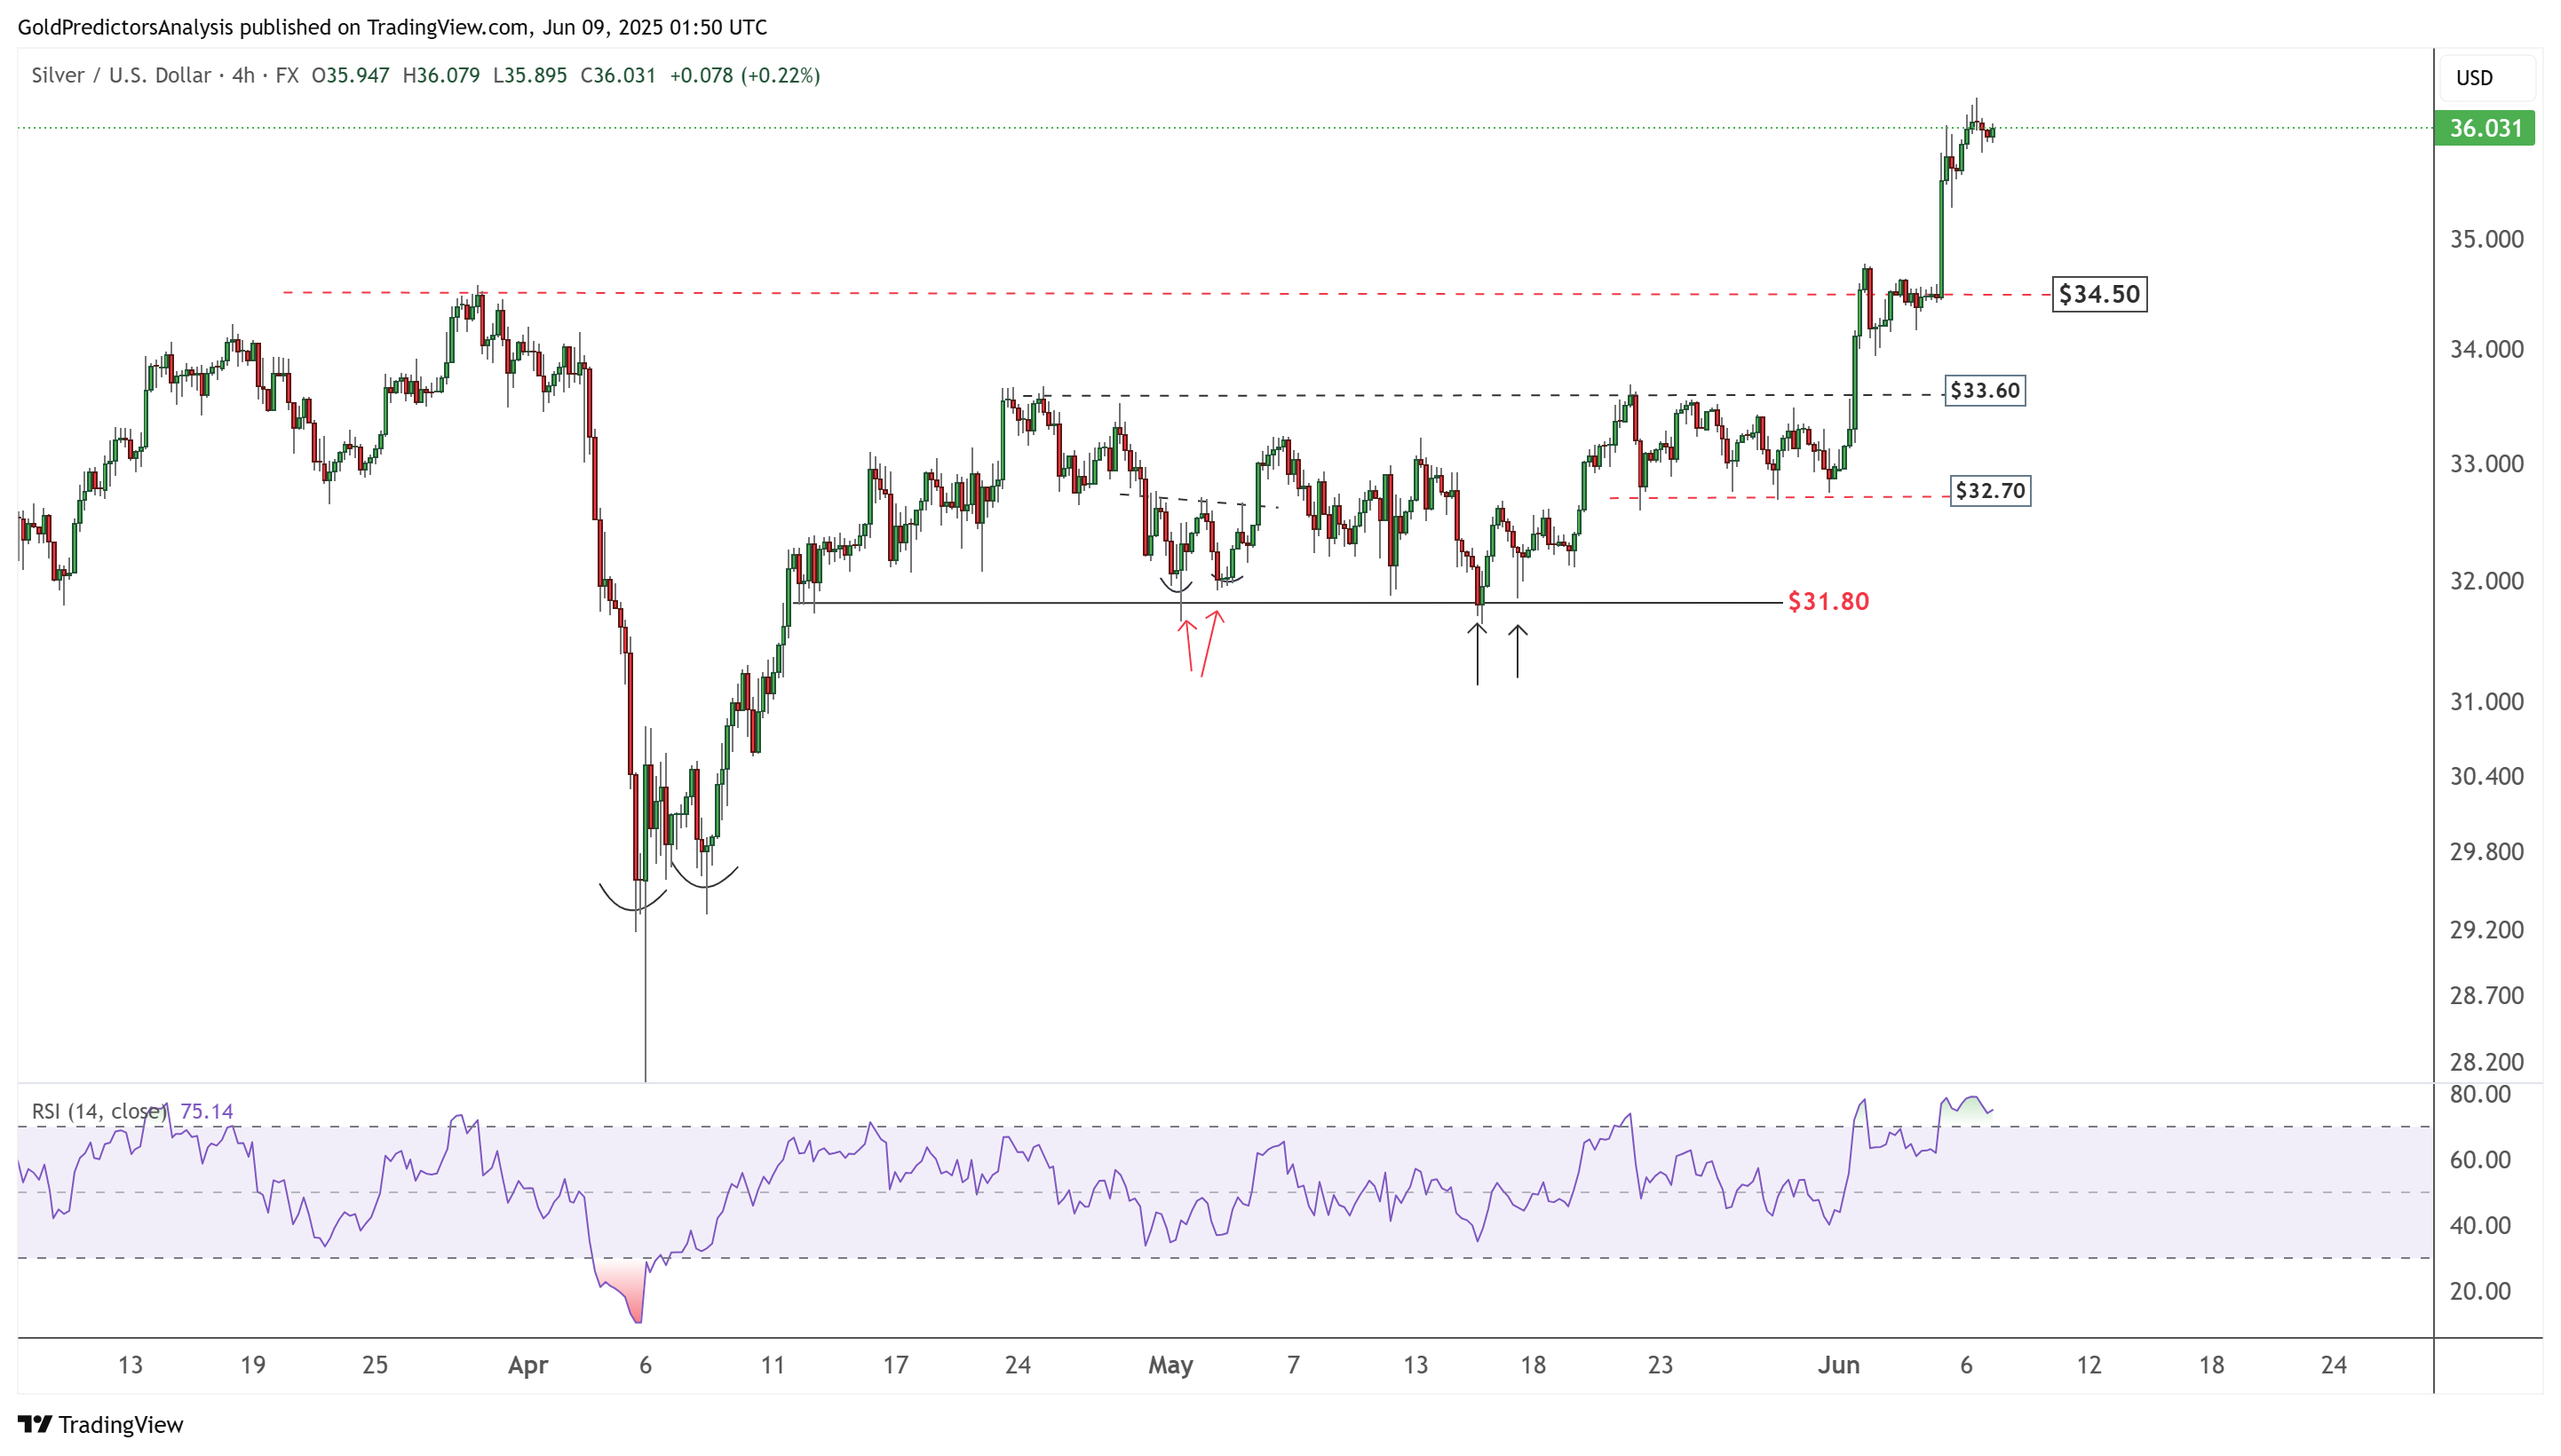
XAGUSD Daily Chart – Break above $35
The daily chart for spot silver shows that the price has broken out after a strong consolidation between $33.60 and $31.70. The tight consolidation within this congested zone, followed by a breakout above $35, has triggered a strong move to the upside. The $35 level acts as key support for any further bullish continuation.
XAGUSD 4-Hour Chart – Breakout
The 4-hour chart for Spot Silver also shows positive behavior. Multiple attempts to break below $31.80 failed, and prices reversed higher after testing this level. A breakout above $33.60, followed by consolidation, has opened the door for further upside.
However, the RSI now indicates that the price is at an extremely overbought level, suggesting a possible short-term correction. This correction would likely be viewed as a healthy pause and a potential setup for the next rally.
US Dollar Index Technical Analysis
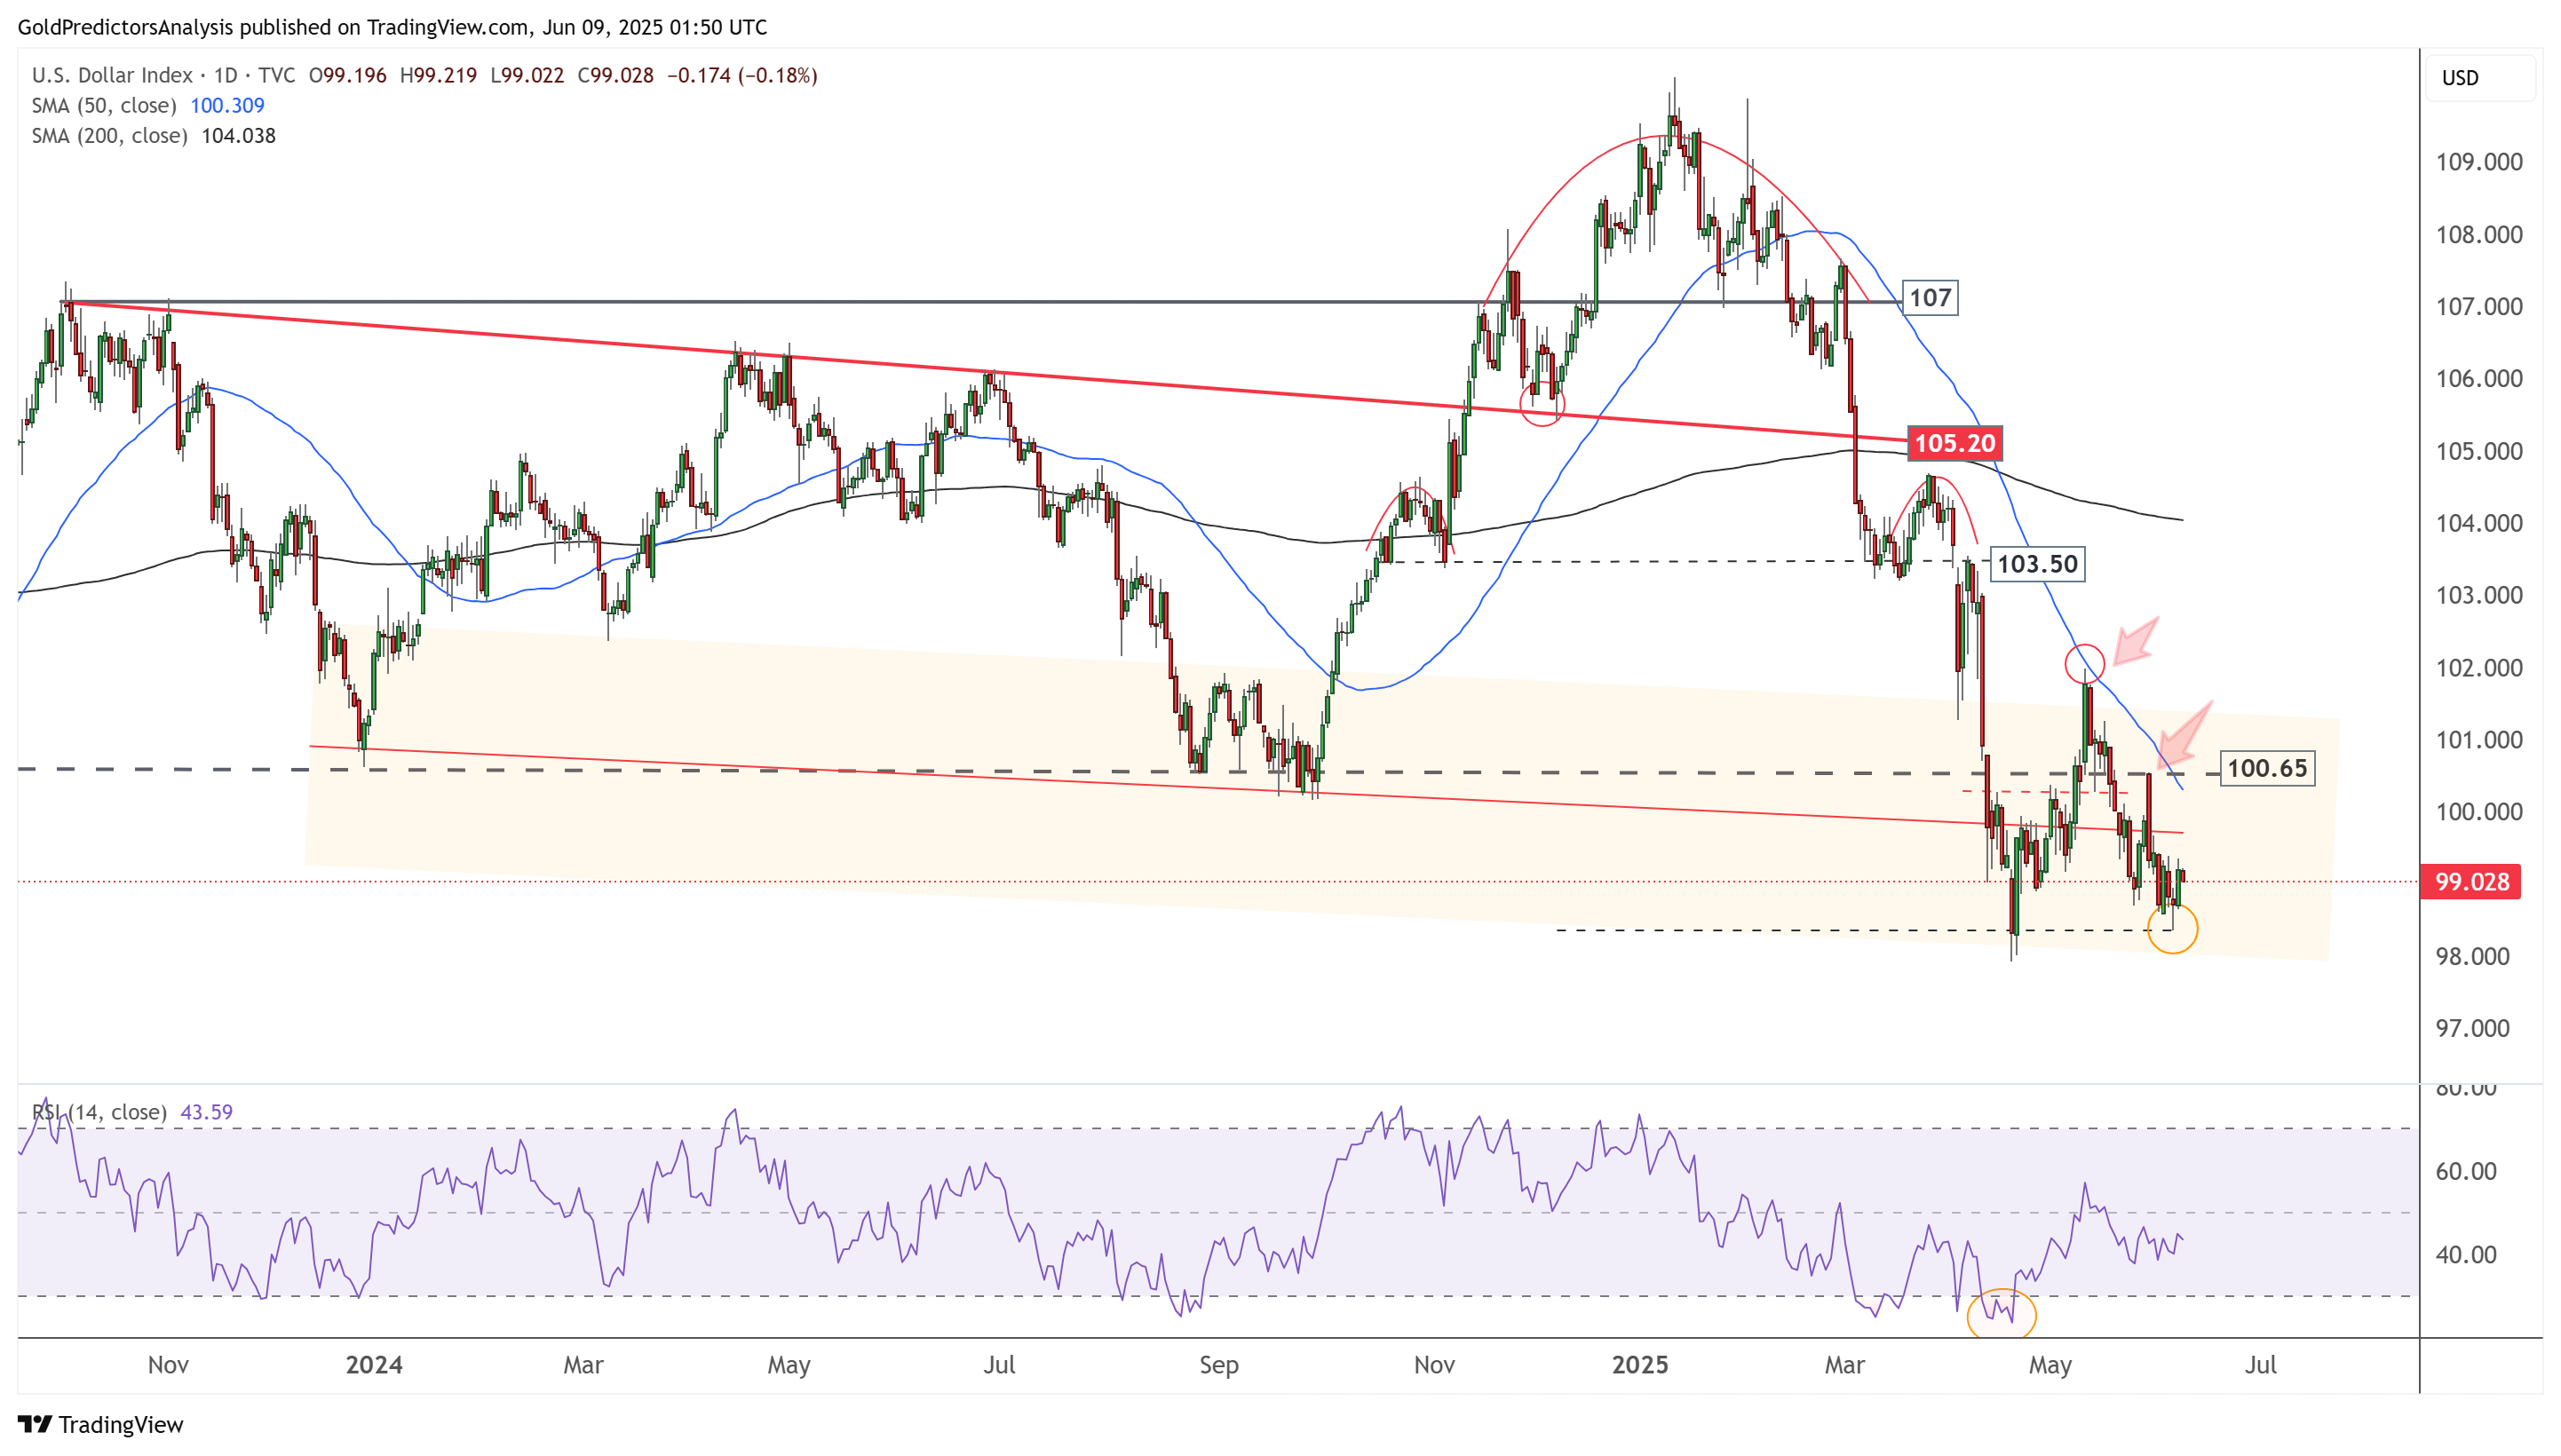
US Dollar Daily – Bearish Pressure
The daily chart for the US Dollar Index shows that it has been consolidating around the long-term support near the 98 level. The rebound from this area has triggered a corrective move in the gold market. However, the US Dollar Index remains under bearish pressure, signaling the potential for further downside. A clear break below 98 would likely initiate a strong decline.
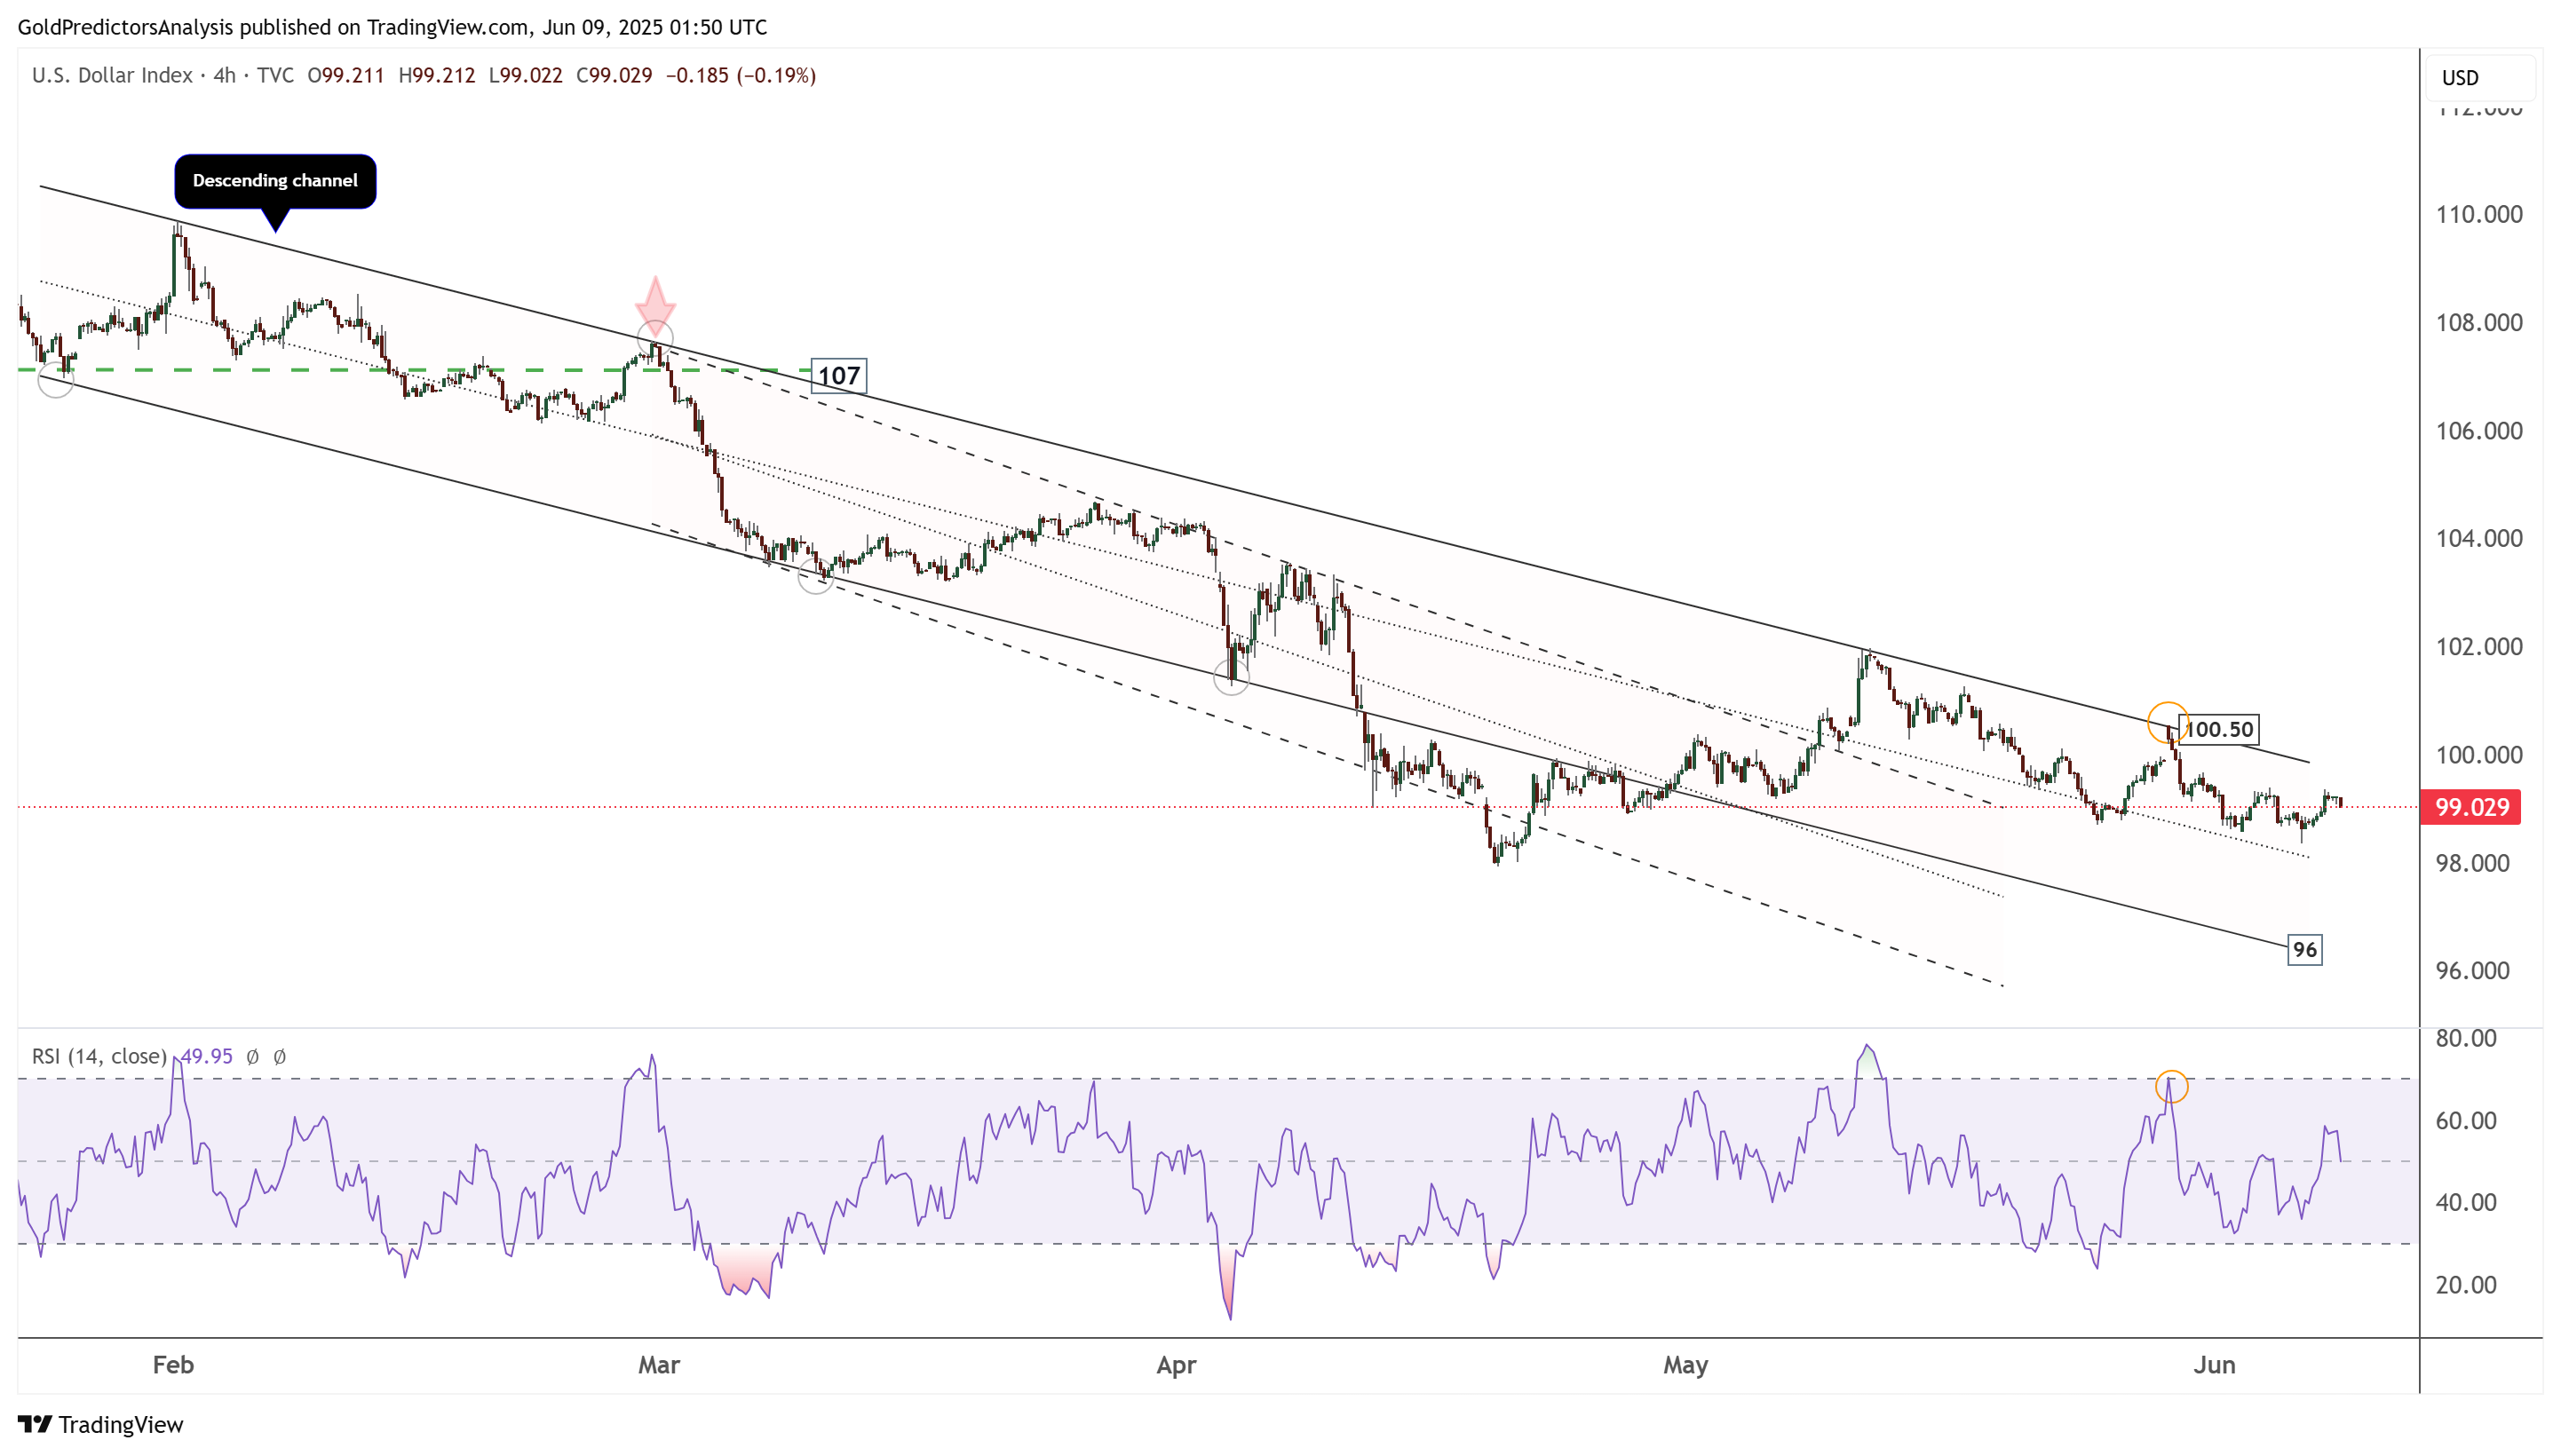
US Dollar 4-Hour Chart – Descending Channel
The 4-hour chart for the US Dollar Index shows that it is trading within a descending channel. The index is consolidating below 100.50, which suggests the potential for further downside. A break below 98 is required for the index to extend its decline toward the 96 level.
About the Author
Bob MasonChief Crypto Boss
123456789 30 He has written extensively for a broader audience and his current focus is on developments relating to the financial markets including, but not limited to currencies, commodities, alternative asset classes, and global equities.


Advertisement