
Advertisement
Advertisement
Grayscale’s Solana ETF Gains SEC Attention – What’s Next for SOL Price?
By:
Key Points:
- Descending channel nearing completion with a potential breakout.
- Key Fibonacci retracements acting as resistance at $216.90 and $231.72.
- RSI showing early signs of a bullish reversal.

Solana (SOL) is currently at a pivotal moment, with its price action aligning with the recent regulatory developments regarding Grayscale’s Solana ETF. The SEC’s acknowledgment of the ETF application has sparked renewed interest in SOL, as institutional adoption could drive significant market movements. However, technical indicators suggest that SOL remains within a corrective phase, awaiting confirmation of a breakout.
Grayscale Filles Solana ETF
The SEC’s acknowledgment of Grayscale’s Solana ETF filing has introduced a significant development that could influence SOL’s price dynamics. Historically, regulatory advancements in ETFs have driven institutional interest, leading to increased market volatility. While this announcement does not guarantee approval, it suggests a shifting stance toward crypto assets like Solana, which had previously been classified as securities in legal proceedings.
From a technical perspective, SOL has been trading within a consolidation range, with key resistance at $25.50 and major support at $20.30. The ETF news may provide the bullish catalyst needed to break above resistance, targeting higher Fibonacci extensions near $28.80. However, rejection at these levels could result in a retest of lower supports, potentially around $18.50.
SOL Price Analysis
SOL’s 4-hour chart illustrates a corrective structure following its previous five-wave impulse rally that peaked around $294.50. The subsequent decline has formed a descending channel, with wave counts suggesting a W-X-Y-Z corrective pattern. This multi-wave correction aligns with key Fibonacci retracement levels, where the 0.786 level at $195.81 is currently acting as support.
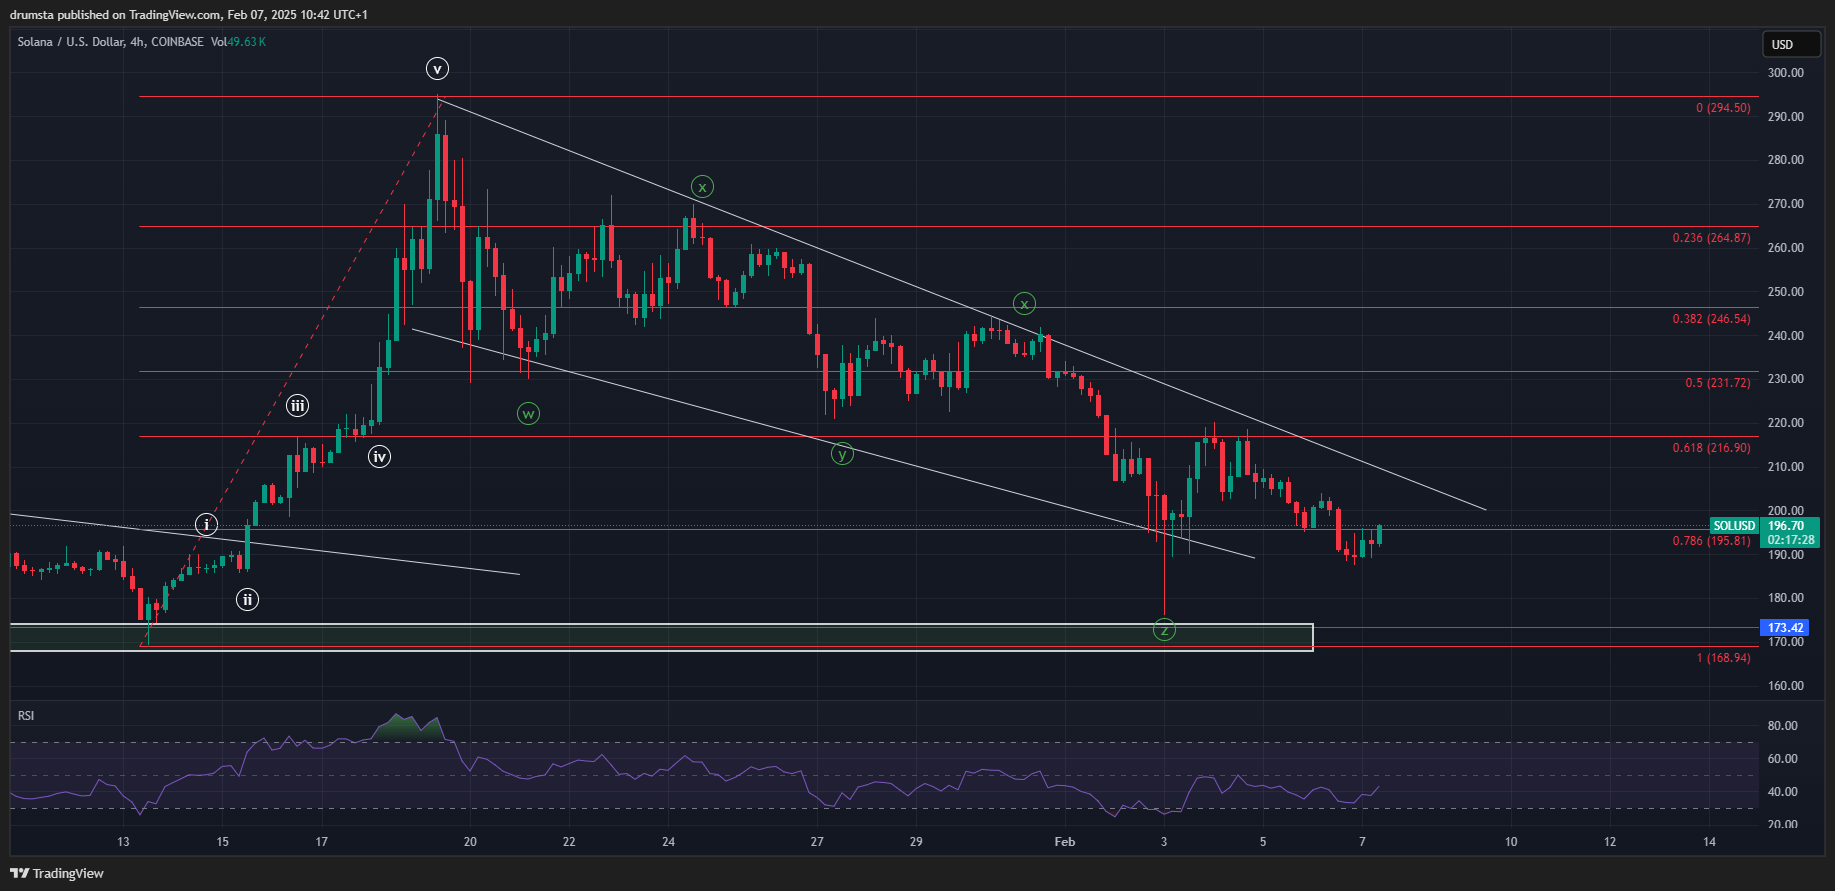
The price recently tested the lower boundary of the channel, near the $173.42 support zone, on a large 4h candle wick, but closed above it.. This level has held firmly, indicating potential demand accumulation. A break above the channel’s upper boundary, currently near $200, could confirm a bullish reversal, targeting the 0.618 Fibonacci level at $216.90, followed by the 0.5 retracement at $231.72.
The Relative Strength Index (RSI) is recovering from oversold conditions, currently hovering around 40, suggesting that downward momentum is weakening. However, for a confirmed trend shift, RSI must break above 50 with increasing bullish volume.
SOL Price Prediction
The 1-hour chart provides a more detailed view of the potential reversal setup. SOL appears to have completed a five-wave impulse structure retesting the channel’s resistance. A pullback followed but the price is still at a higher low than it was on Feb. 3 presenting two potential outlooks.
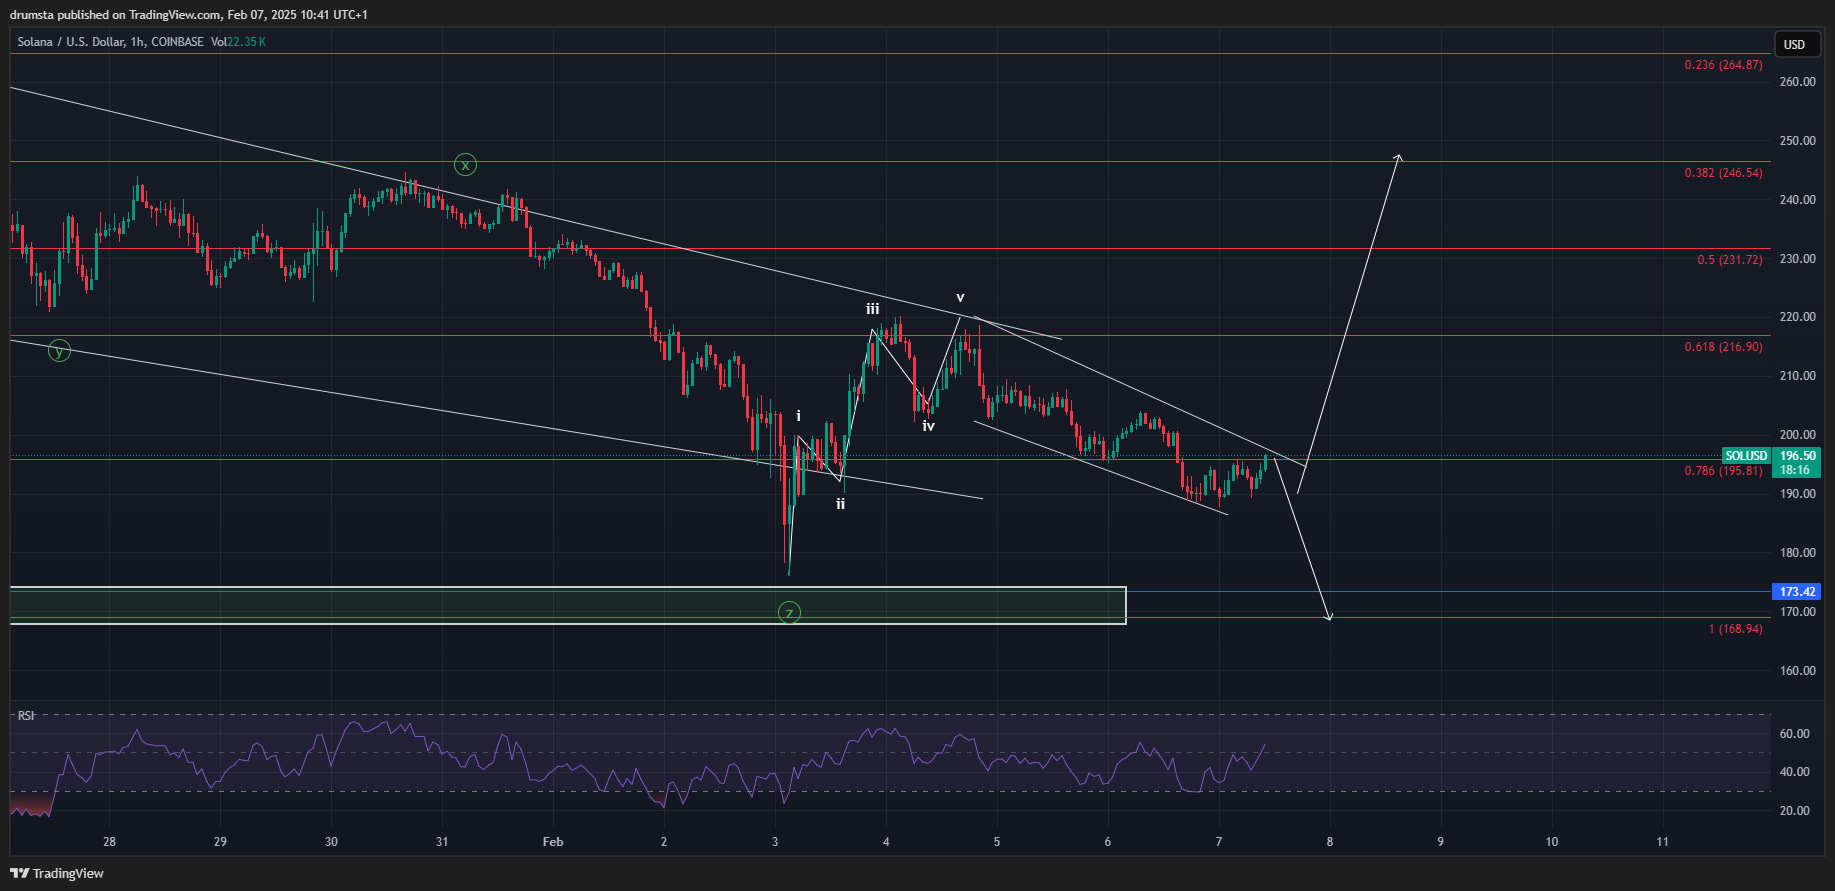
If SOL breaks above the $200 resistance and sustains momentum, the first major target lies at $216.90 (0.618 Fibonacci). A continuation beyond this level would confirm a breakout, aiming for $231.72 and potentially $246.54 (0.382 Fibonacci level).
If the breakout attempt fails, SOL could retest the $173.42 support zone, possibly dipping to $168.94. This would provide a stronger accumulation phase before an eventual breakout. The RSI’s uptrend suggests a higher probability of a bullish scenario, but confirmation is needed.
Key Levels to Watch
- Immediate Resistance: $200 (Descending Wedge Breakout Level)
- Key Resistance: $216.90 (0.618 Fibonacci), $231.72 (0.5 Fibonacci)
- Critical Support: $195.81 (0.786 Fibonacci), $173.42 (Major Demand Zone)
- Bearish Invalidation: Below $168.94 (1.0 Fibonacci Extension)
Traders should closely monitor volume spikes and momentum indicators such as RSI to gauge the strength of any breakout. ETF speculation may drive short-term price action, but sustained gains will depend on broader market sentiment.
About the Author
Bob MasonChief Crypto Boss
TEST 30 He has written extensively for a broader audience and his current focus is on developments relating to the financial markets including, but not limited to currencies, commodities, alternative asset classes, and global equities.
Latest news and analysis


Advertisement