
Advertisement
Advertisement
Natural Gas and Oil Forecast: Can Crude Prices Rebound Amid OPEC+ Production Shifts?
By:
Key Points:
- WTI crude hovers near multi-year lows as OPEC+ production shifts and demand concerns weigh on market sentiment.
- Brent crude faces resistance near $71.32, with bearish momentum intact unless prices reclaim key levels above $73.36.
- Natural gas holds above $4.26 support; traders eye $4.55 breakout for potential rally toward $4.78 amid volatile energy markets.

Market Overview
Oil prices rebounded Thursday following a steep decline, though gains remained capped by tariff uncertainties and rising supply expectations. Brent crude plunged 6.5% over four sessions, reaching levels not seen since December 2021, while WTI dropped 5.8% to a low last recorded in May 2023.
Market sentiment remains bearish, weighed down by trade restrictions and OPEC+ output hikes.
Meanwhile, U.S. crude inventories surged by 3.6 million barrels, surpassing expectations and signaling weakening demand. With refinery maintenance and shifting trade flows further complicating the outlook, energy markets remain under pressure, awaiting clarity on policy shifts and supply dynamics.
Natural Gas Price Forecast
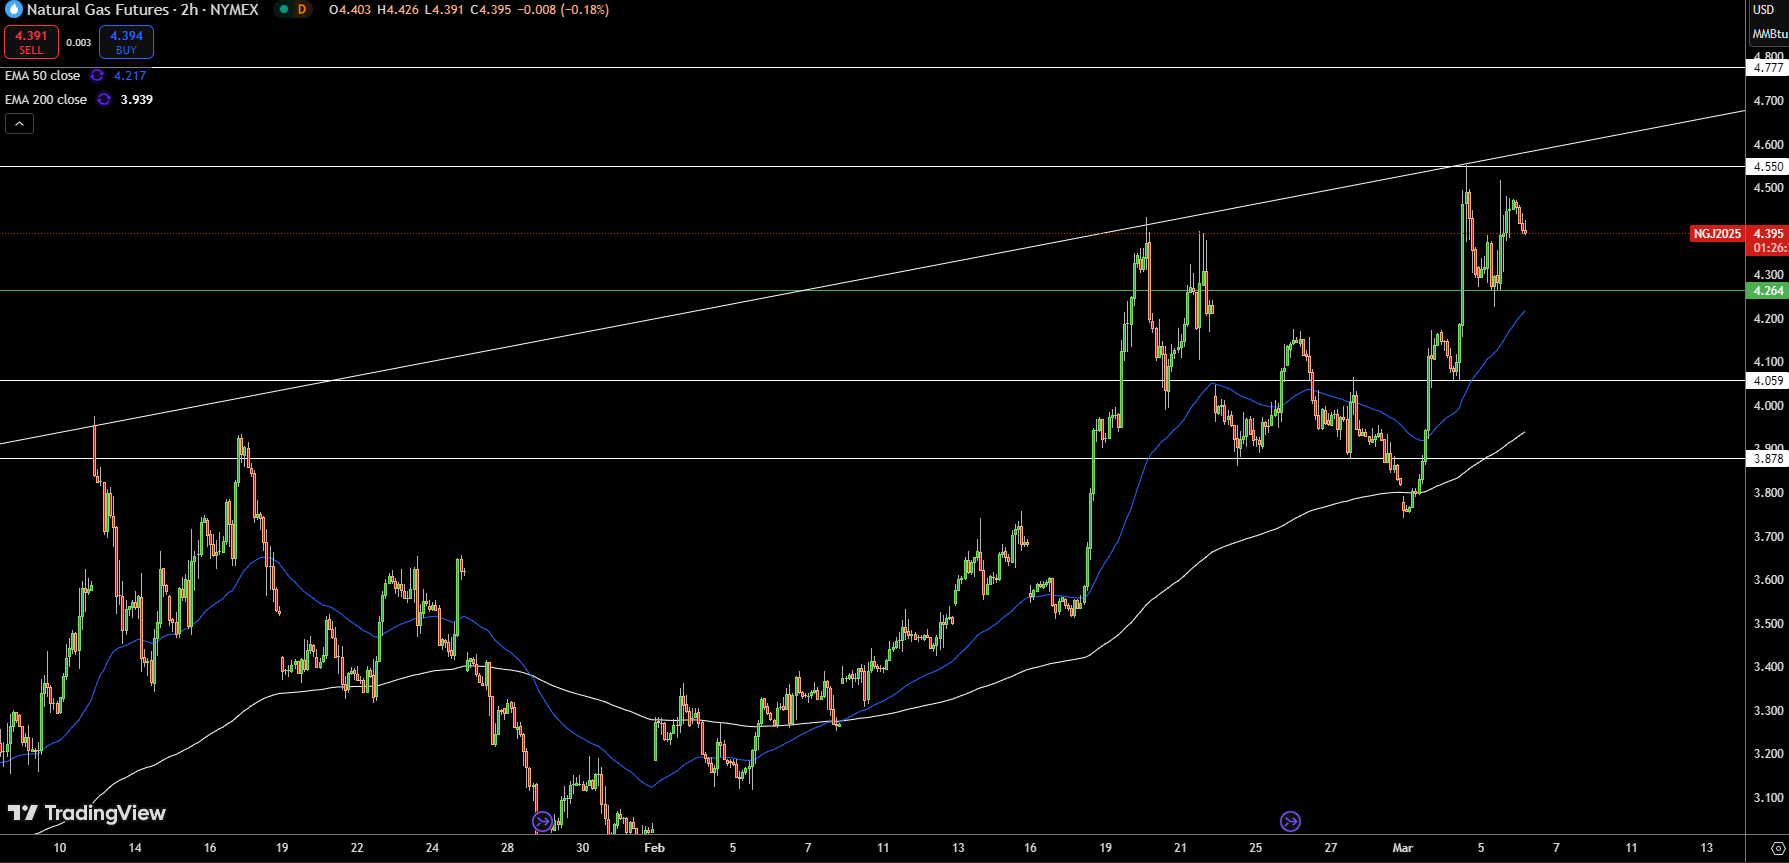
Natural Gas (NG) is trading at $4.38, slipping 0.07% as traders assess demand amid fluctuating energy market conditions. The price remains above its pivot point at $4.26, a key threshold for short-term sentiment. Holding this level could reinforce bullish momentum, with immediate resistance at $4.55 and a breakout potentially targeting $4.78.
Technical indicators paint a cautiously optimistic picture. The 50-day EMA at $4.22 is providing near-term support, while the 200-day EMA at $3.94 signals a broader uptrend. However, a drop below $4.26 could shift momentum, exposing support levels at $4.06 and $3.88.
With market sentiment hinging on economic data and weather patterns, traders should watch for volume confirmation above $4.55 to validate a sustained breakout. Conversely, a failure to hold $4.26 may trigger a sharper downside move.
WTI Oil Price Forecast
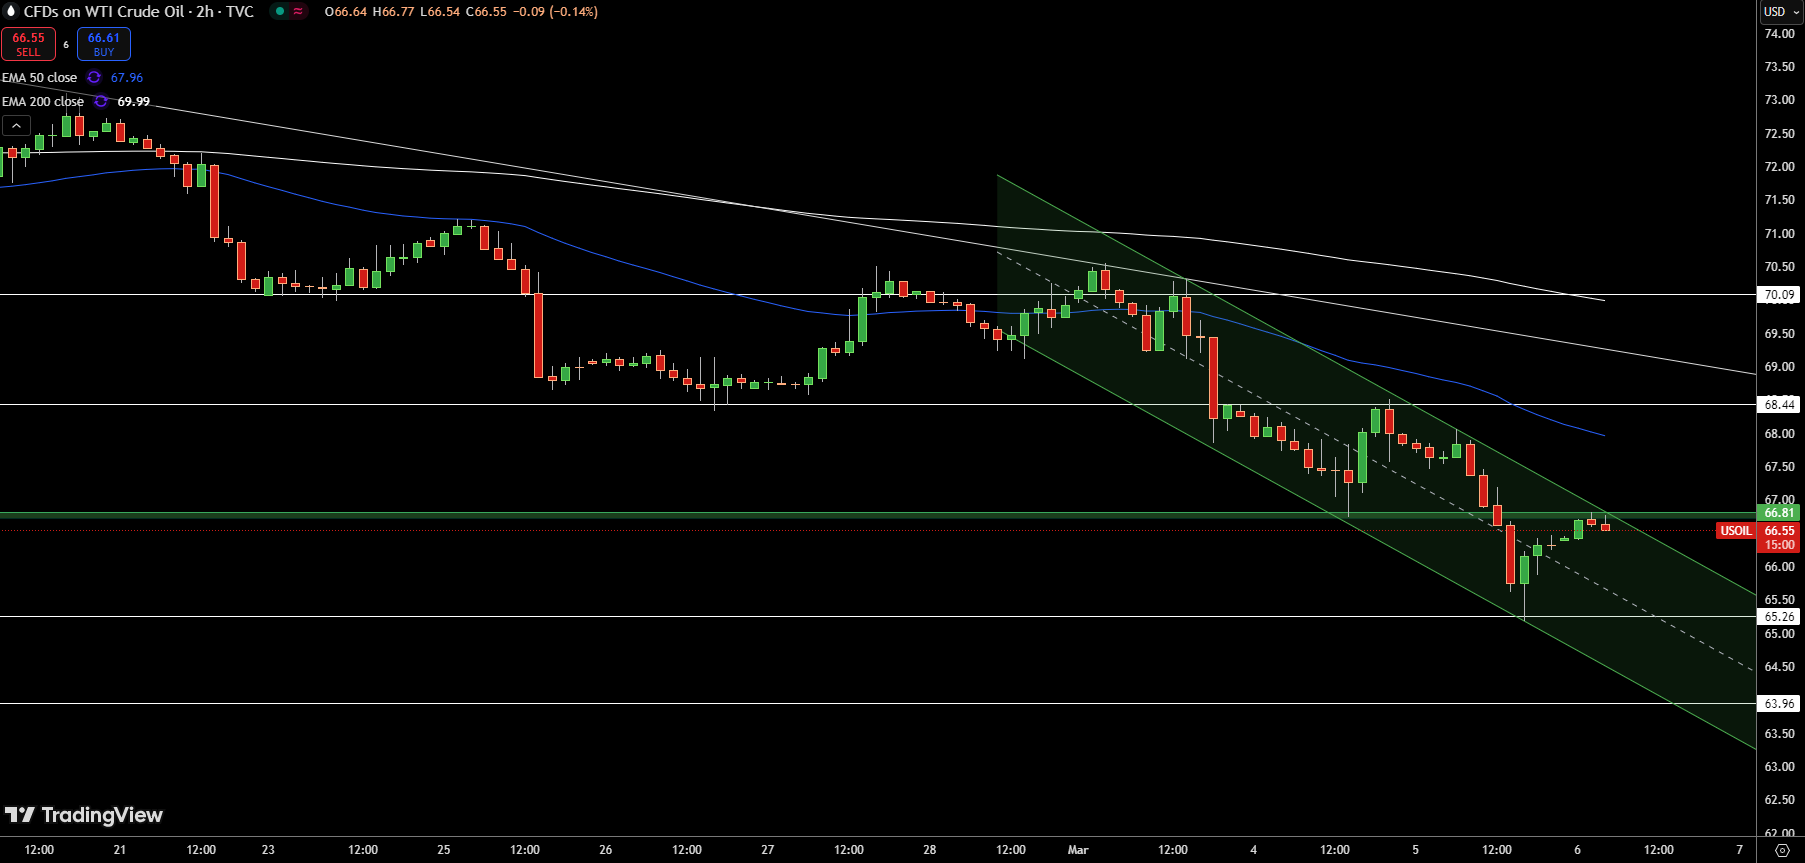
U.S. crude oil (USOIL) is trading at $66.51, down 0.08%, as it struggles to find direction amid weak demand signals and a strengthening dollar. The price remains below the pivot point at $66.81, reinforcing a bearish bias, with immediate support at $65.26 and a further decline potentially testing $63.96.
Technical indicators confirm the downside pressure. The 50-day EMA at $67.96 and 200-day EMA at $69.99 suggest a continued bearish trend. A descending channel on the 2-hour chart highlights sellers’ control, making a recovery difficult unless oil reclaims $66.81.
A break above $68.44 could shift sentiment, opening the door to $70.09, but unless volume picks up, the downtrend may persist, keeping pressure on crude prices.
Brent Oil Price Forecast
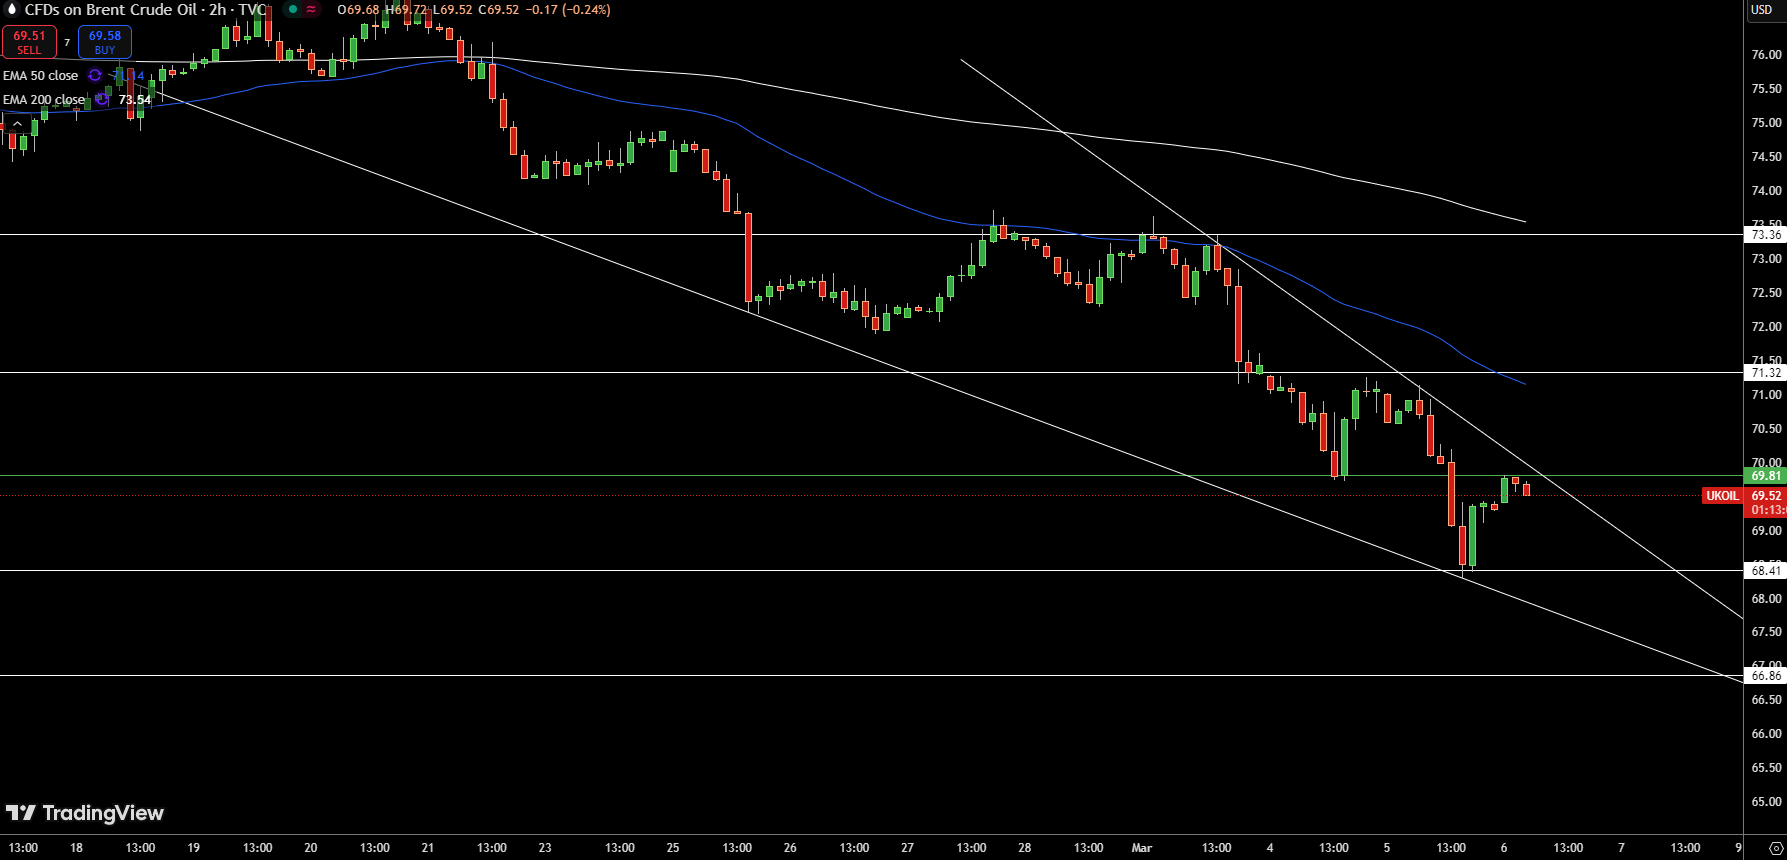
Brent crude (UKOIL) is trading at $69.51, hovering just below its pivot point at $69.81, signaling a cautious market tone. The price remains under pressure as the 50-day EMA at $71.14 and 200-day EMA at $73.54 suggest a broader bearish trend.
A downward channel on the 2-hour chart reinforces selling pressure, keeping Brent below key resistance at $71.32. If buyers regain momentum and push the price above $69.81, a test of $73.36 could follow.
However, failure to hold current levels may trigger a decline toward $68.41, with deeper support at $66.86.
About the Author
Bob MasonChief Crypto Boss
TEST 30 He has written extensively for a broader audience and his current focus is on developments relating to the financial markets including, but not limited to currencies, commodities, alternative asset classes, and global equities.
Latest news and analysis


Advertisement