
Advertisement
Advertisement
Natural Gas and Oil Forecast: Key Levels to Watch After 2% Price Drop
By:
Key Points:
- Oil prices dropped over 2% as easing geopolitical tensions raised hopes for fewer supply disruptions and higher exports.
- U.S. crude inventories surged by 4.1 million barrels, surpassing forecasts and adding downward pressure on oil prices.
- Natural gas holds above $3.58, but resistance at $3.79 may cap gains, signaling a cautiously bullish outlook.

Market Overview
Oil prices fell over 2% as geopolitical tensions eased, raising expectations that supply disruptions could decline. Markets reacted to potential diplomatic resolutions, which may lead to reduced sanctions and increased crude exports.
Meanwhile, U.S. crude inventories surged by 4.1 million barrels, surpassing forecasts, further weighing on oil prices. Analysts note that a prolonged period of supply tightening had previously supported prices, but the latest developments signal a possible shift.
Additionally, concerns over global trade policies and potential tariffs have heightened uncertainty, raising fears of an economic slowdown that could dampen oil and natural gas demand in the coming months.
Natural Gas Price Forecast
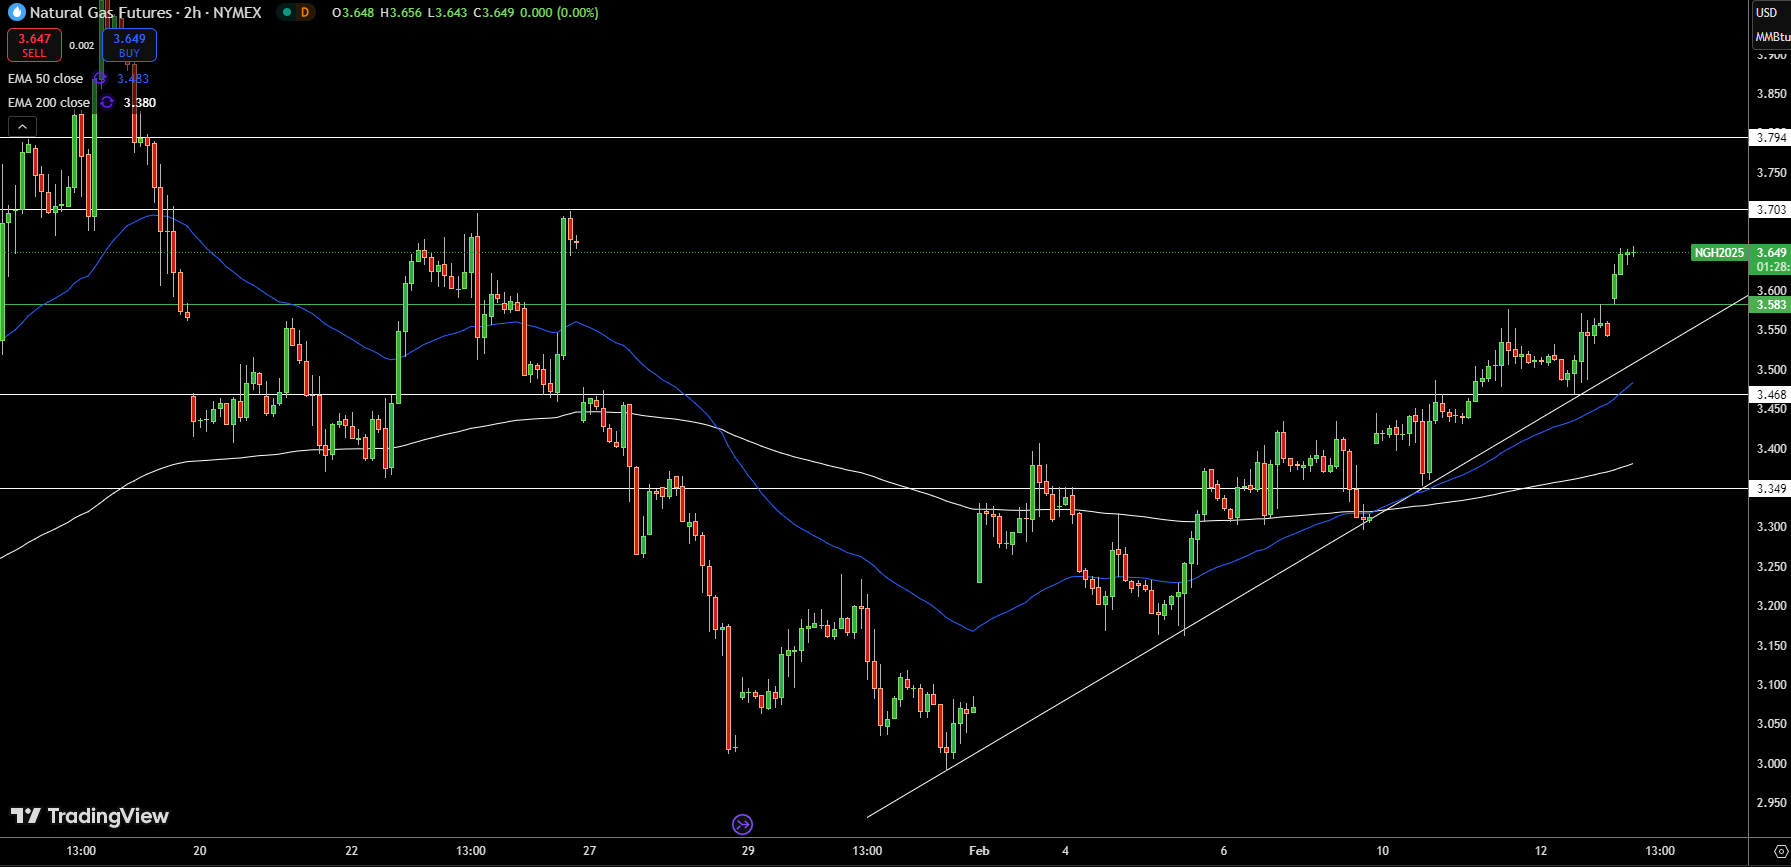
Natural Gas (NG) is trading at $3.65, holding above its pivot point at $3.58, signaling a cautiously bullish outlook. The 50-day EMA at $3.48 and 200-day EMA at $3.38 suggest strong support, reinforcing the upward trend. However, the double-top pattern near $3.79 could act as a strong resistance, potentially limiting gains.
A break above $3.70 could open the door for a move toward $3.79, but failure to sustain momentum might trigger a pullback to $3.47 or even $3.35. Traders should watch volume levels for confirmation, as a break below the pivot could accelerate selling pressure. Overall, bullish above $3.58, but resistance ahead could slow upside potential.
WTI Oil Price Forecast
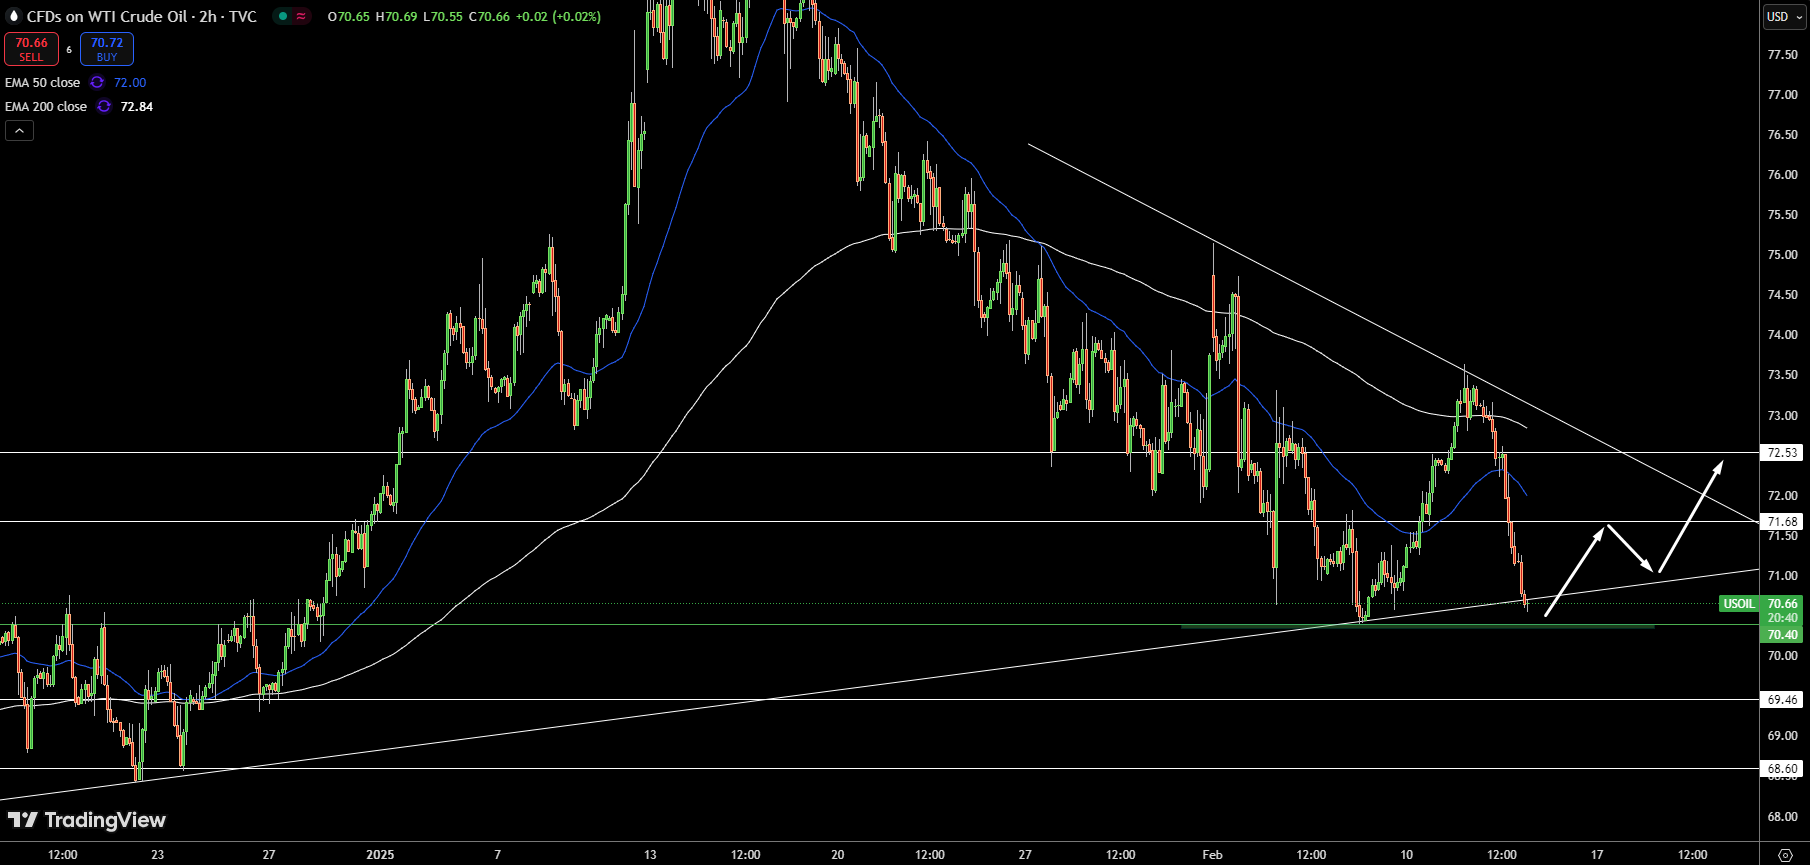
WTI crude oil (USOIL) is trading at $70.65, hovering near its pivot point at $70.66. The 50-day EMA at $72.00 and 200-day EMA at $72.84 indicate a broader downtrend, but a double-bottom pattern around $70.66 suggests potential for a rebound.
If buyers push prices above $71.68, momentum could accelerate toward $72.53, confirming bullish sentiment.
On the downside, a break below $70.66 could expose $69.46 and further declines toward $68.60. Traders should watch for volume confirmation near the pivot, as sustained buying above this level could shift sentiment. Bullish above $70.66, but failure to hold could trigger a selloff.
Brent Oil Price Forecast
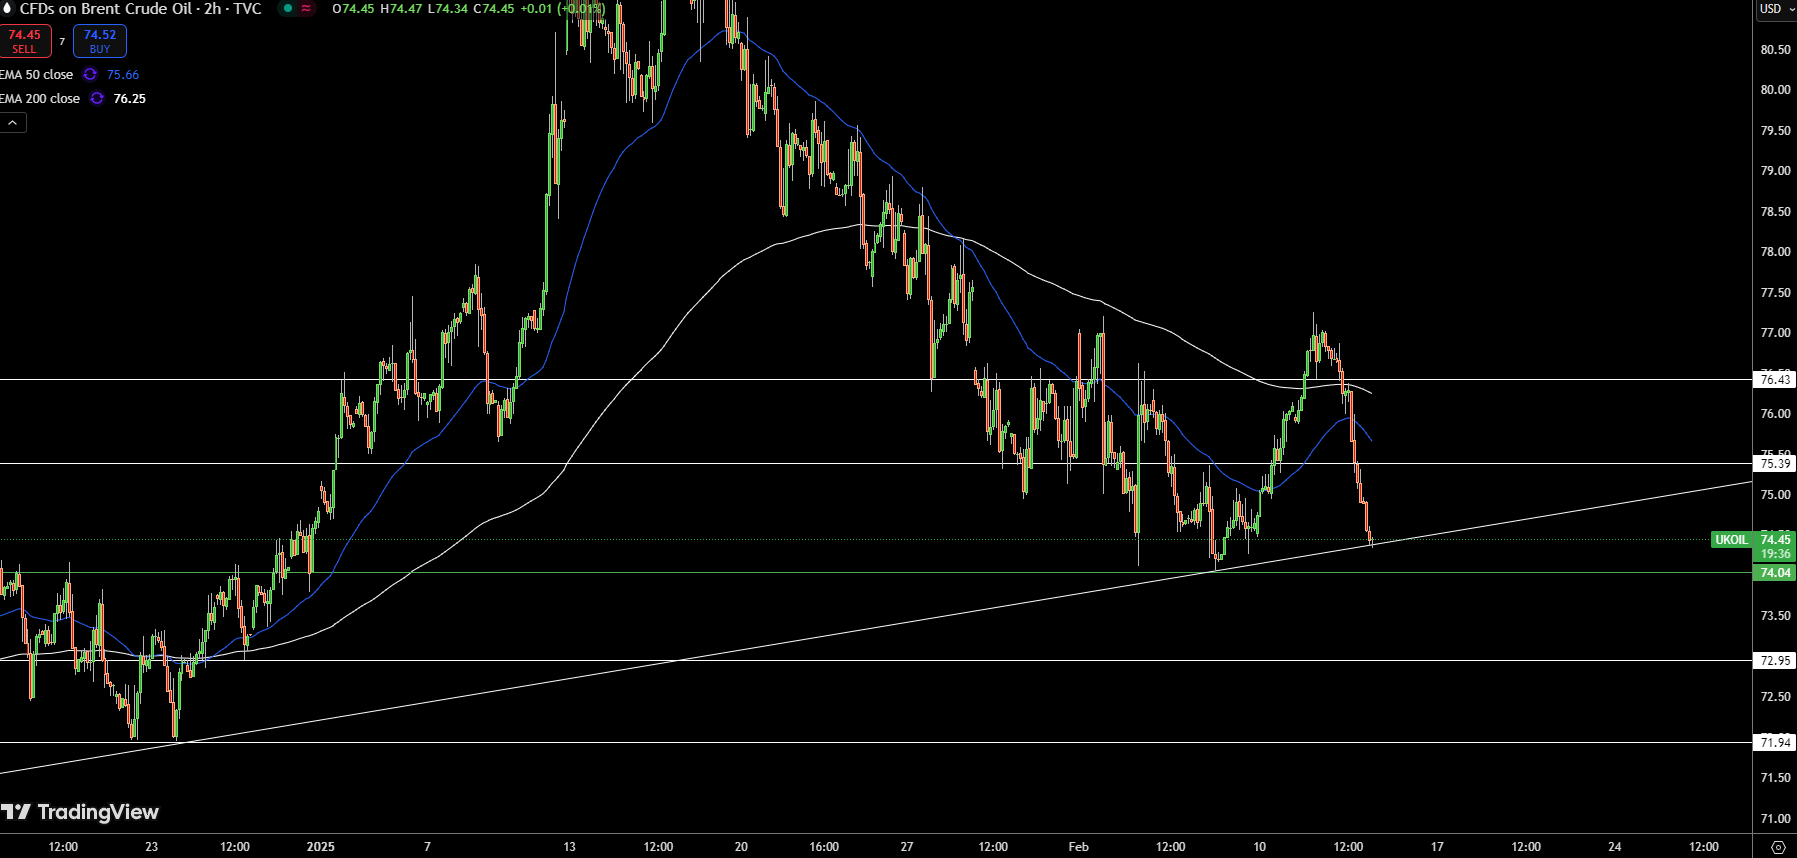
Brent crude (UKOIL) is trading at $74.44, holding just above the pivot point at $74.04. A double-bottom pattern suggests potential for a rebound, but upside momentum remains capped by the 50-day EMA at $75.66 and the 200-day EMA at $76.25. Immediate resistance stands at $75.39, with a breakout paving the way for a test of $76.43.
On the downside, if UKOIL falls below $74.04, it could trigger selling pressure toward $72.95 and possibly $71.94. The key to confirming a bullish trend lies in maintaining support above the pivot level while sustaining volume-driven buying pressure. Bullish above $74.04, but a breakdown risks further downside.
About the Author
Bob MasonChief Crypto Boss
TEST 30 He has written extensively for a broader audience and his current focus is on developments relating to the financial markets including, but not limited to currencies, commodities, alternative asset classes, and global equities.
Latest news and analysis


Advertisement