
Advertisement
Advertisement
US CPI Disappoints Bitcoin, Ethereum Bulls But A Key “Stealth QE” Could Boost Prices
By:
Key Points:
- Bitcoin's ascending triangle breakout could push its price toward $133,000 if it clears the $108,000 resistance.
- A Treasury General Account (TGA) drawdown is injecting liquidity into markets, acting as "stealth QE" and potentially boosting Bitcoin and Ethereum.
- The altcoin market cap (TOTAL2) faces key resistance at $1.28 trillion, with a breakout needed to confirm further upside.

Bitcoin (BTC), Ethereum (ETH), and the broader crypto market stayed choppy in the past 24 hours, especially after the release of the US Consumer Price Index (CPI) report. However, things are looking brighter if one focuses on the ongoing “stealth QE” in the US.
Crypto Market Choppy After US CPI Print — BNB Rallies
As of Feb. 12, BTC’s price was wobbling around $96,000 after jumping between intraday losses and profits. Ethereum, on the other hand, was holding its circa 1.25% gains to trade around $2,660, albeit eyeing a decisive close above $3,000 resistance level.
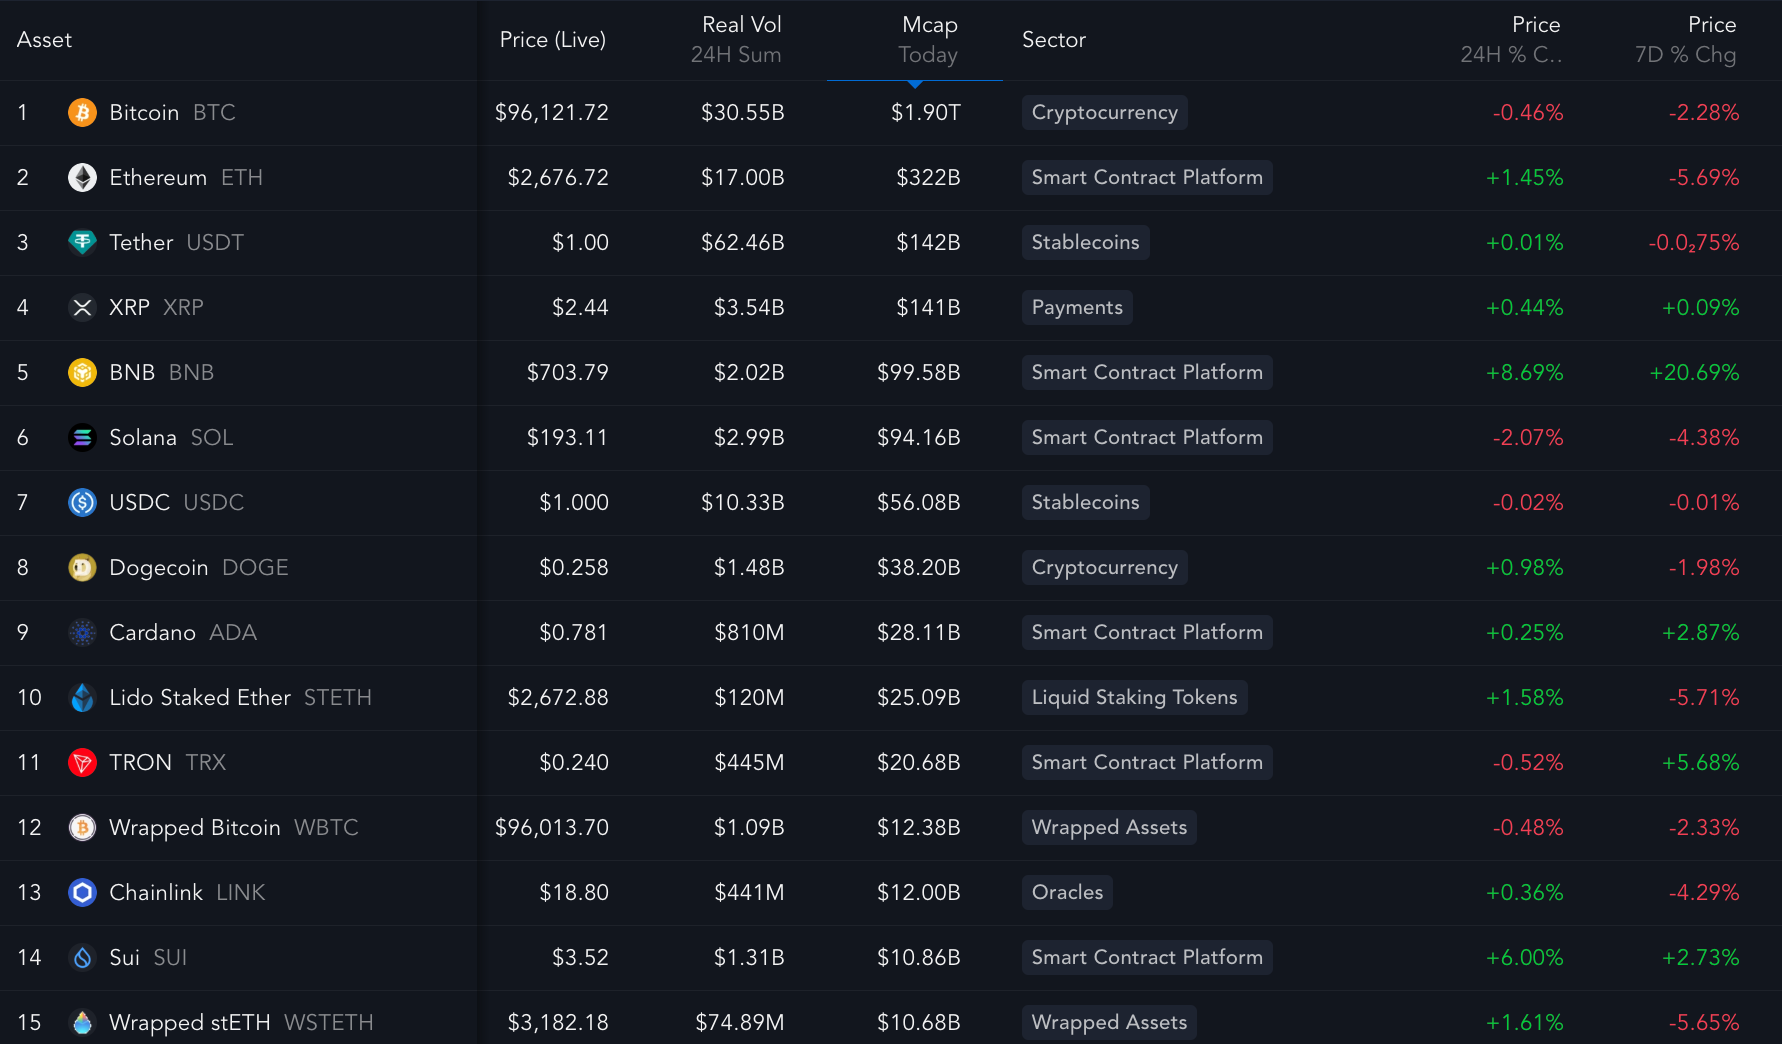
BNB (BNB) is one of the best-performing tokens, meanwhile, rising by over 8.50% due to the growing memecoin frenzy across its parent blockchain BNB Chain.
The U.S. Bureau of Labor Statistics released the January 2025 CPI report on Feb. 12, revealing a higher-than-expected annual inflation rate of 3.0%, up from 2.9% in December 2024. Rising costs in shelter, food, and gasoline drove the increase.
Financial markets reacted with notable volatility. U.S. stock futures fell, with the S&P 500 and Nasdaq dropping nearly 1%. The U.S. dollar strengthened against various currencies as U.S. Treasury yields climbed.
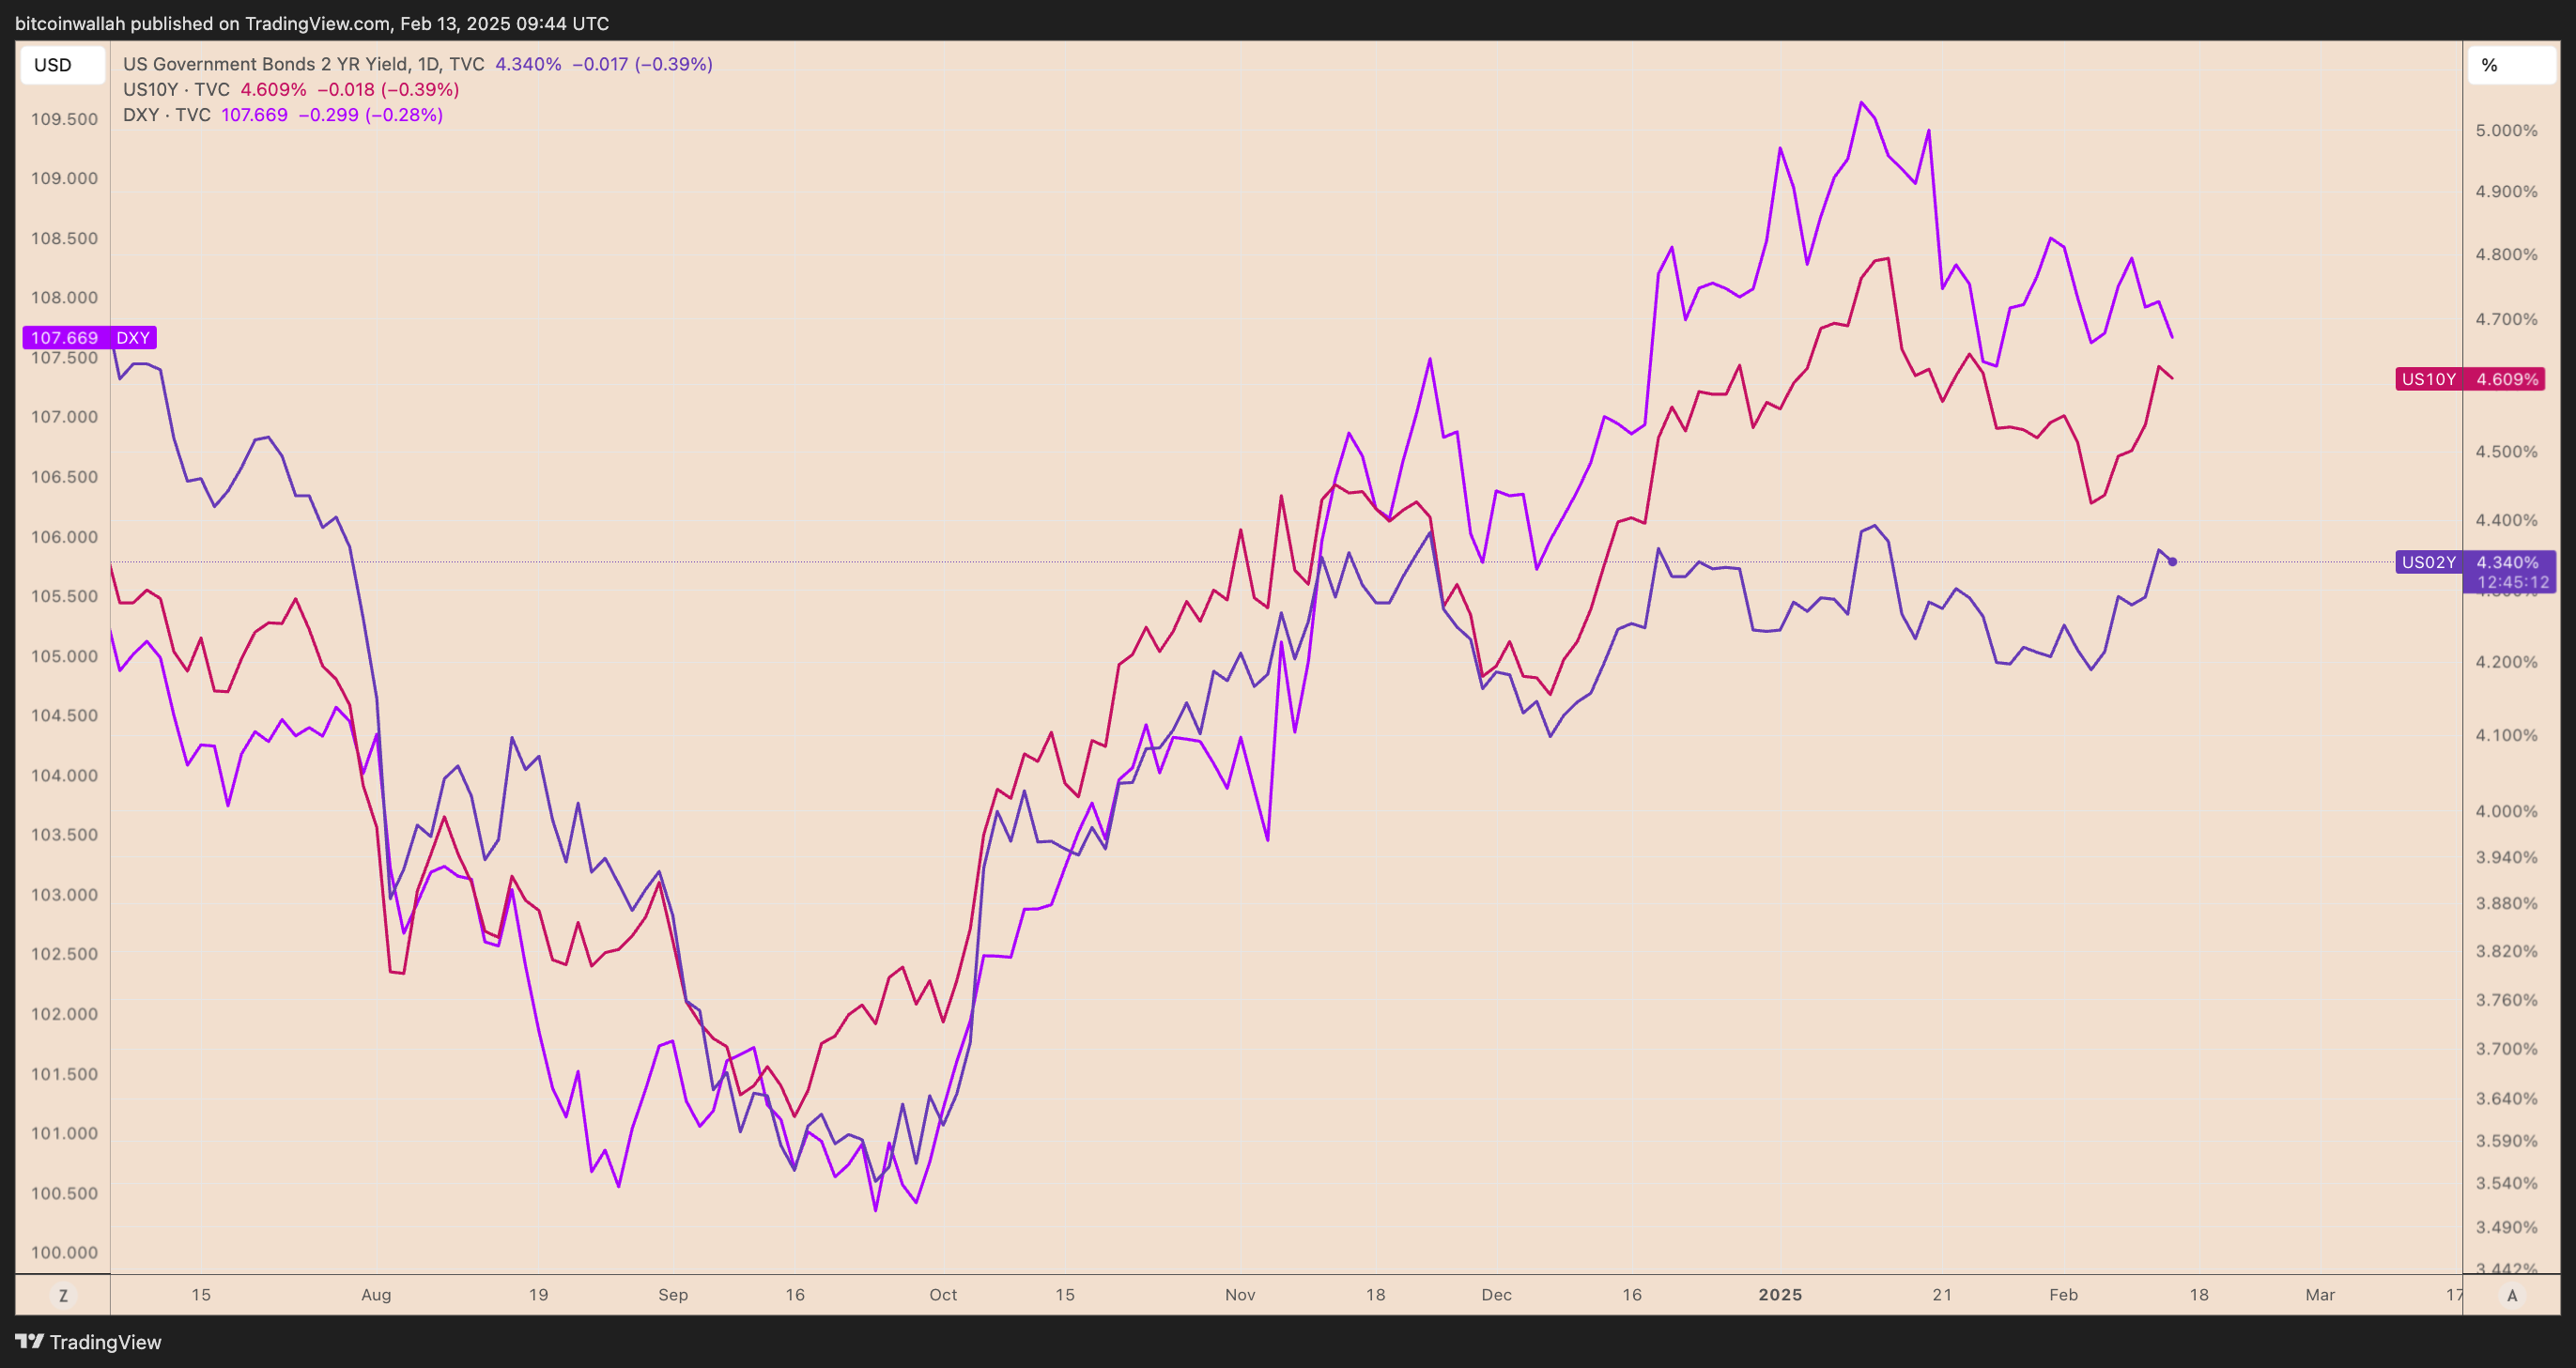
The rising U.S. Treasury yields and stronger dollar tightened liquidity and risk appetite, leading to increased volatility in the crypto market.
Furthermore, the unexpected inflation increase has fueled speculation about the Federal Reserve’s next moves. Fed Chair Jerome Powell signaled no rush to cut interest rates, stressing a cautious approach in response to the data.
Bitcoin, Ethereum Could Boom Nonetheless Due to “Stealth QE”
The crypto market might not get an official Quantitative Easing (QE) policy anytime soon, but a Treasury General Account (TGA) drawdown could inject liquidity into the system, creating a similar effect, noted market analyst Miles Deutscher.
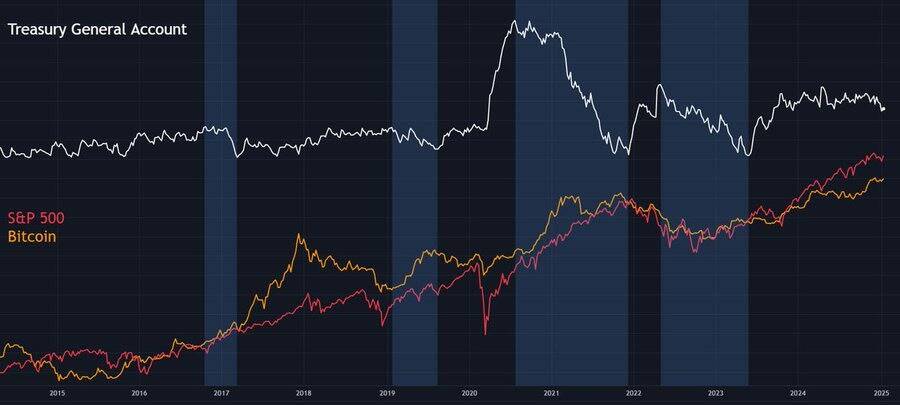
The Treasury General Account (TGA) is like the U.S. government’s checking account held at the Federal Reserve. When the government spends money from this account, it injects liquidity into the economy. Conversely, when it builds up reserves in the TGA, it drains liquidity from the financial system.
- TGA Drawdown = More Money in the System → Markets Pump
- TGA Buildup = Less Money in the System → Markets Struggle
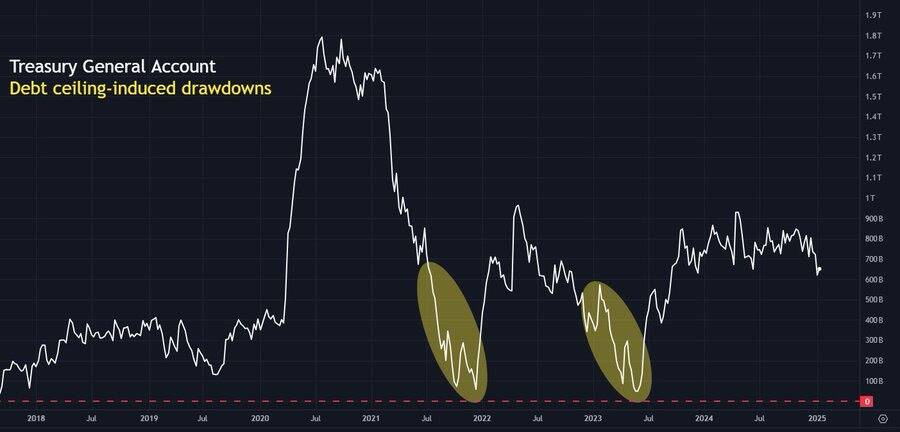
The U.S. government is set to spend down its TGA reserves due to the debt ceiling situation, meaning liquidity will flow into the market—a phenomenon sometimes called “stealth QE.”
Looking at the two most recent TGA drawdowns (highlighted in yellow in the first chart), Bitcoin saw significant price gains:
- December 2022 Drawdown → Bitcoin +84%
- June 2023 Drawdown → Bitcoin +23%
Why Does TGA Drawdown Pump Bitcoin?
- More Liquidity in the System – The government’s spending injects cash into banks and markets, boosting risk-on assets like Bitcoin and stocks.
- Weaker Dollar Effect – As liquidity increases, the dollar often weakens, making BTC (a non-sovereign asset) more attractive.
- Institutional Buying Power – Hedge funds and institutional investors have more capital to allocate to crypto when excess liquidity exists.
That said, even without an official Federal Reserve QE program, a TGA drawdown acts as stealth QE, increasing liquidity. Bitcoin and Ethereum could see another strong rally if history repeats itself.
How Higher Can Bitcoin, Altcoin Market Can Go?
Bitcoin is forming a classic ascending triangle pattern, signaling a potential breakout toward $133,000 in the coming weeks.
The ascending triangle, a bullish continuation pattern, shows BTC consolidating within a tightening range. The price has consistently found support along an upward-sloping trendline, while facing resistance around $108,000.
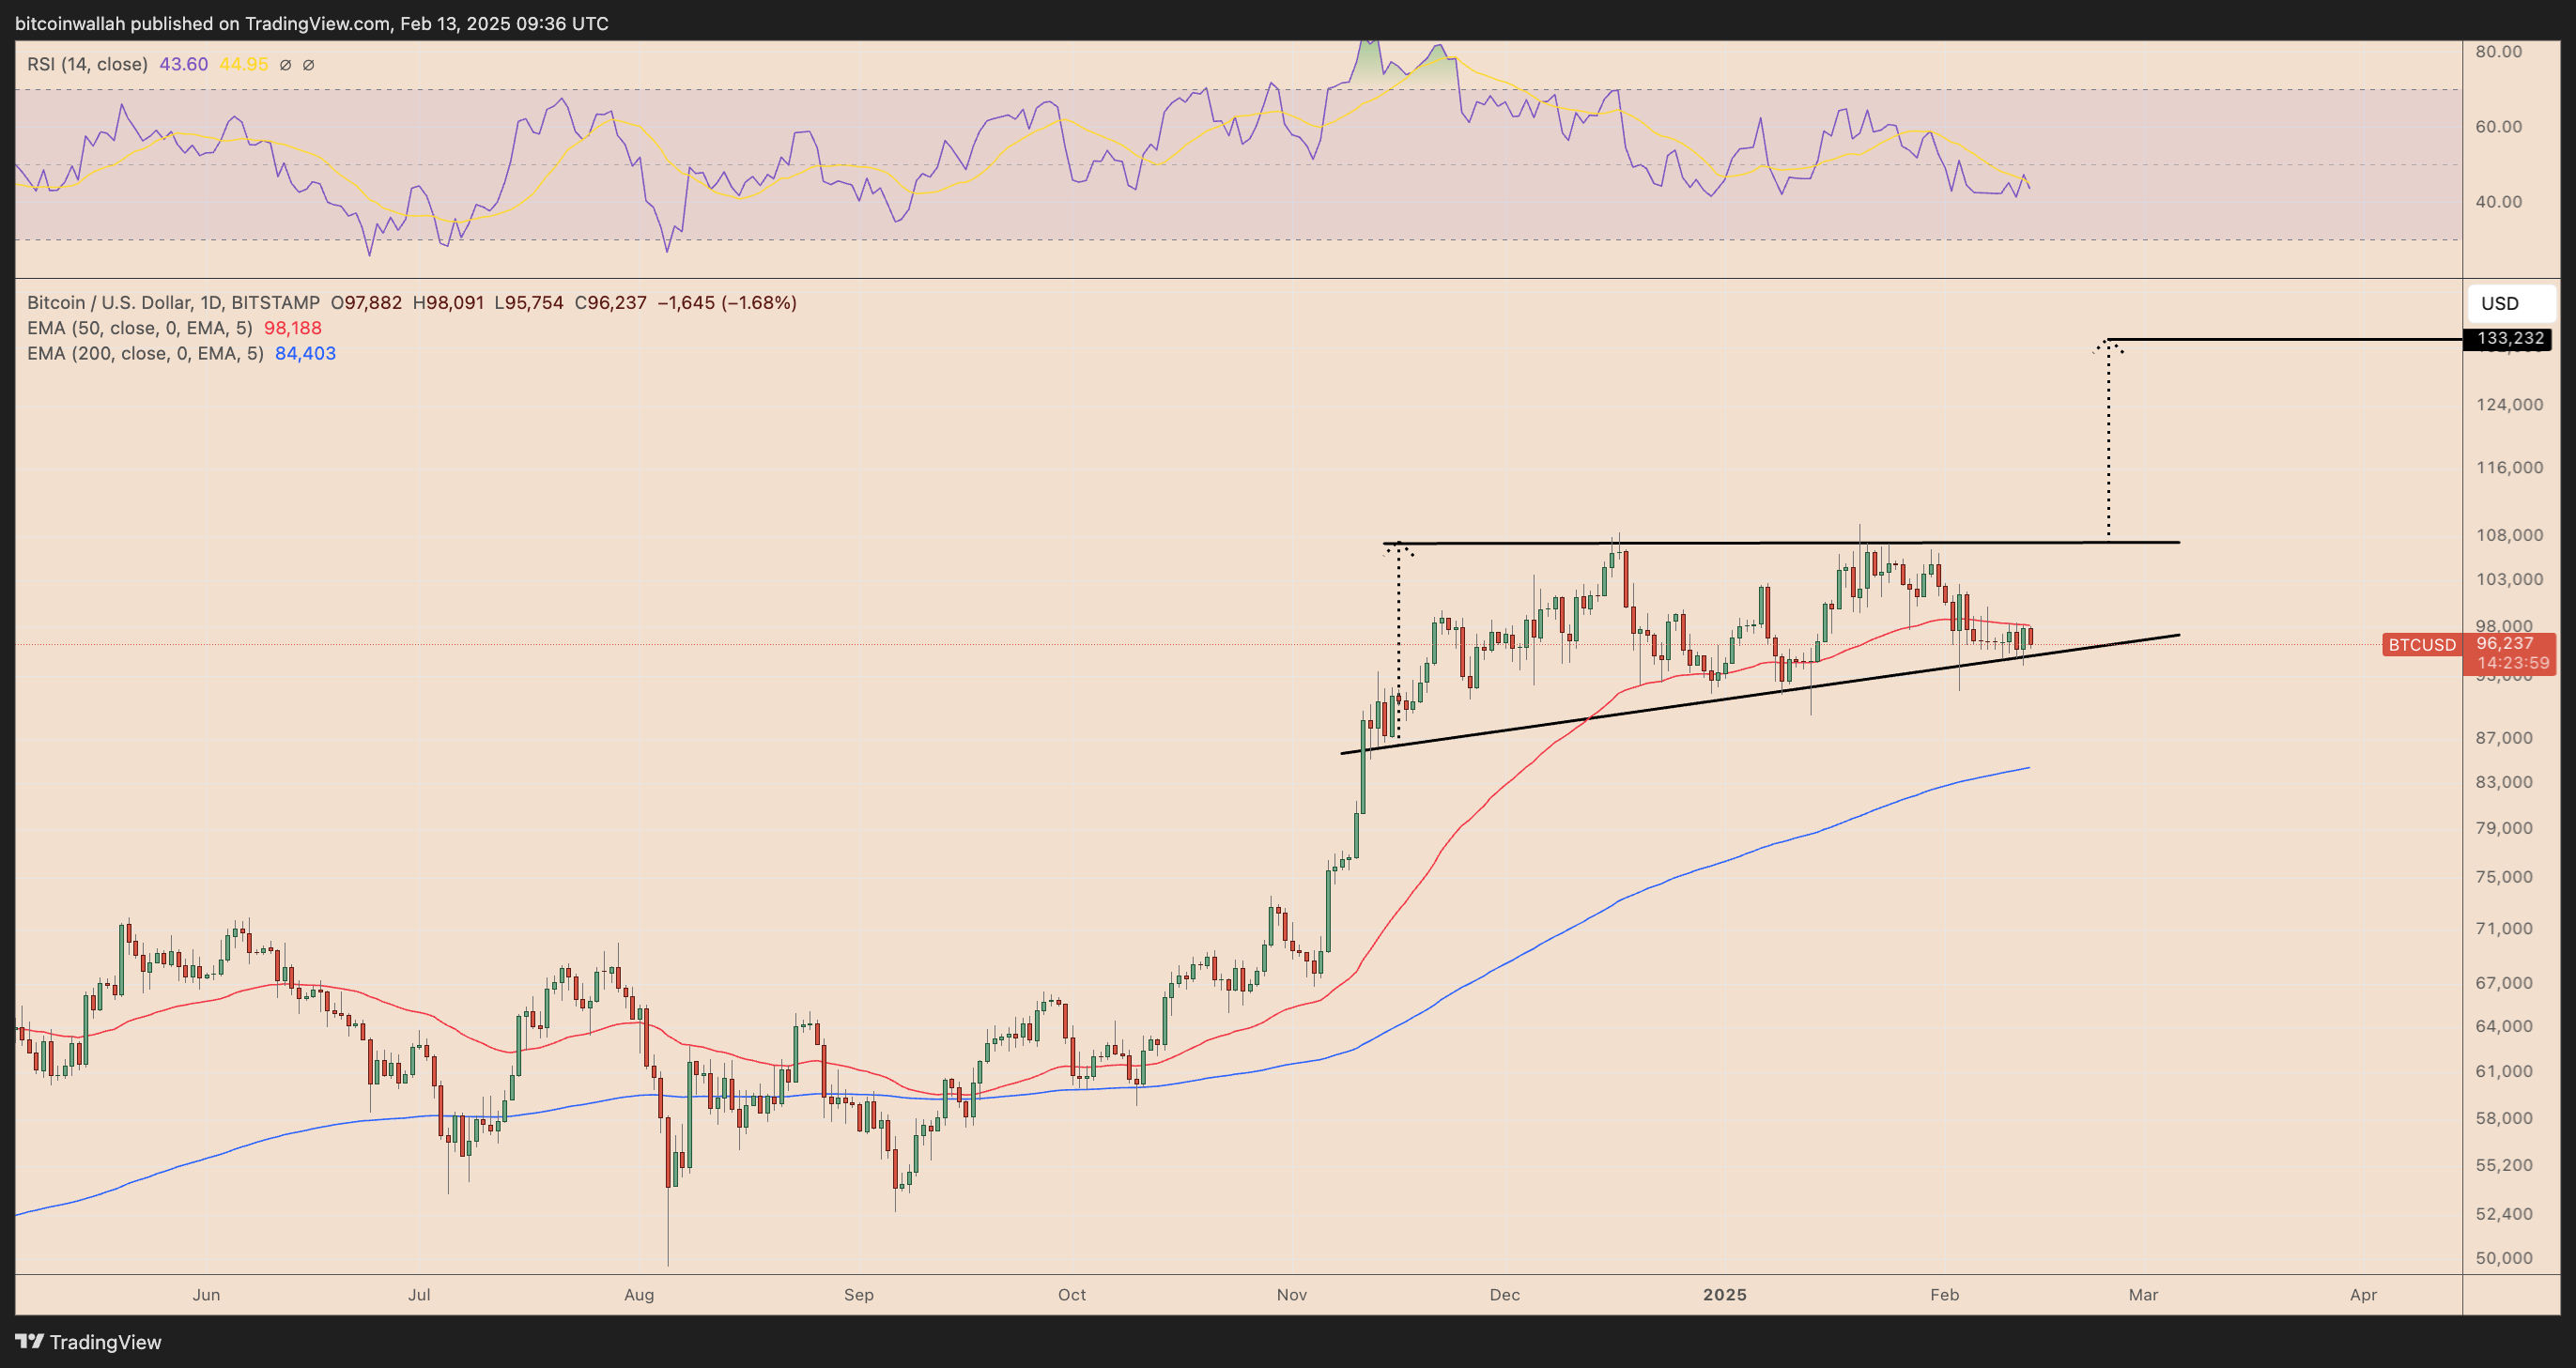
A breakout above this key resistance could ignite a rally matching the triangle’s height, which projects a target near $133,000.
Technical indicators support this bullish outlook. The 50-day EMA at $98,188 is acting as dynamic resistance, while the 200-day EMA at $84,403 provides long-term support.
Meanwhile, the Relative Strength Index (RSI) is hovering around 44.95, suggesting that BTC has room to climb before reaching overbought conditions.
If Bitcoin successfully breaks out, the move could trigger a fresh wave of bullish momentum, potentially sending BTC to new all-time highs above $130,000.
However, failure to break resistance could lead to a retest of the lower trendline around $95,000-$96,000 before another breakout attempt.
Altcoin Season Next?
The altcoin market cap (TOTAL2) is recovering from its recent downtrend, but it remains within a descending channel pattern, limiting its upside potential in the near term.
TOTAL2 recently rebounded after testing support near $1.2 trillion, showing early signs of a potential breakout attempt. However, the $1.28 trillion level remains a significant resistance, as it previously acted as strong support between November 2024 and January 2025.
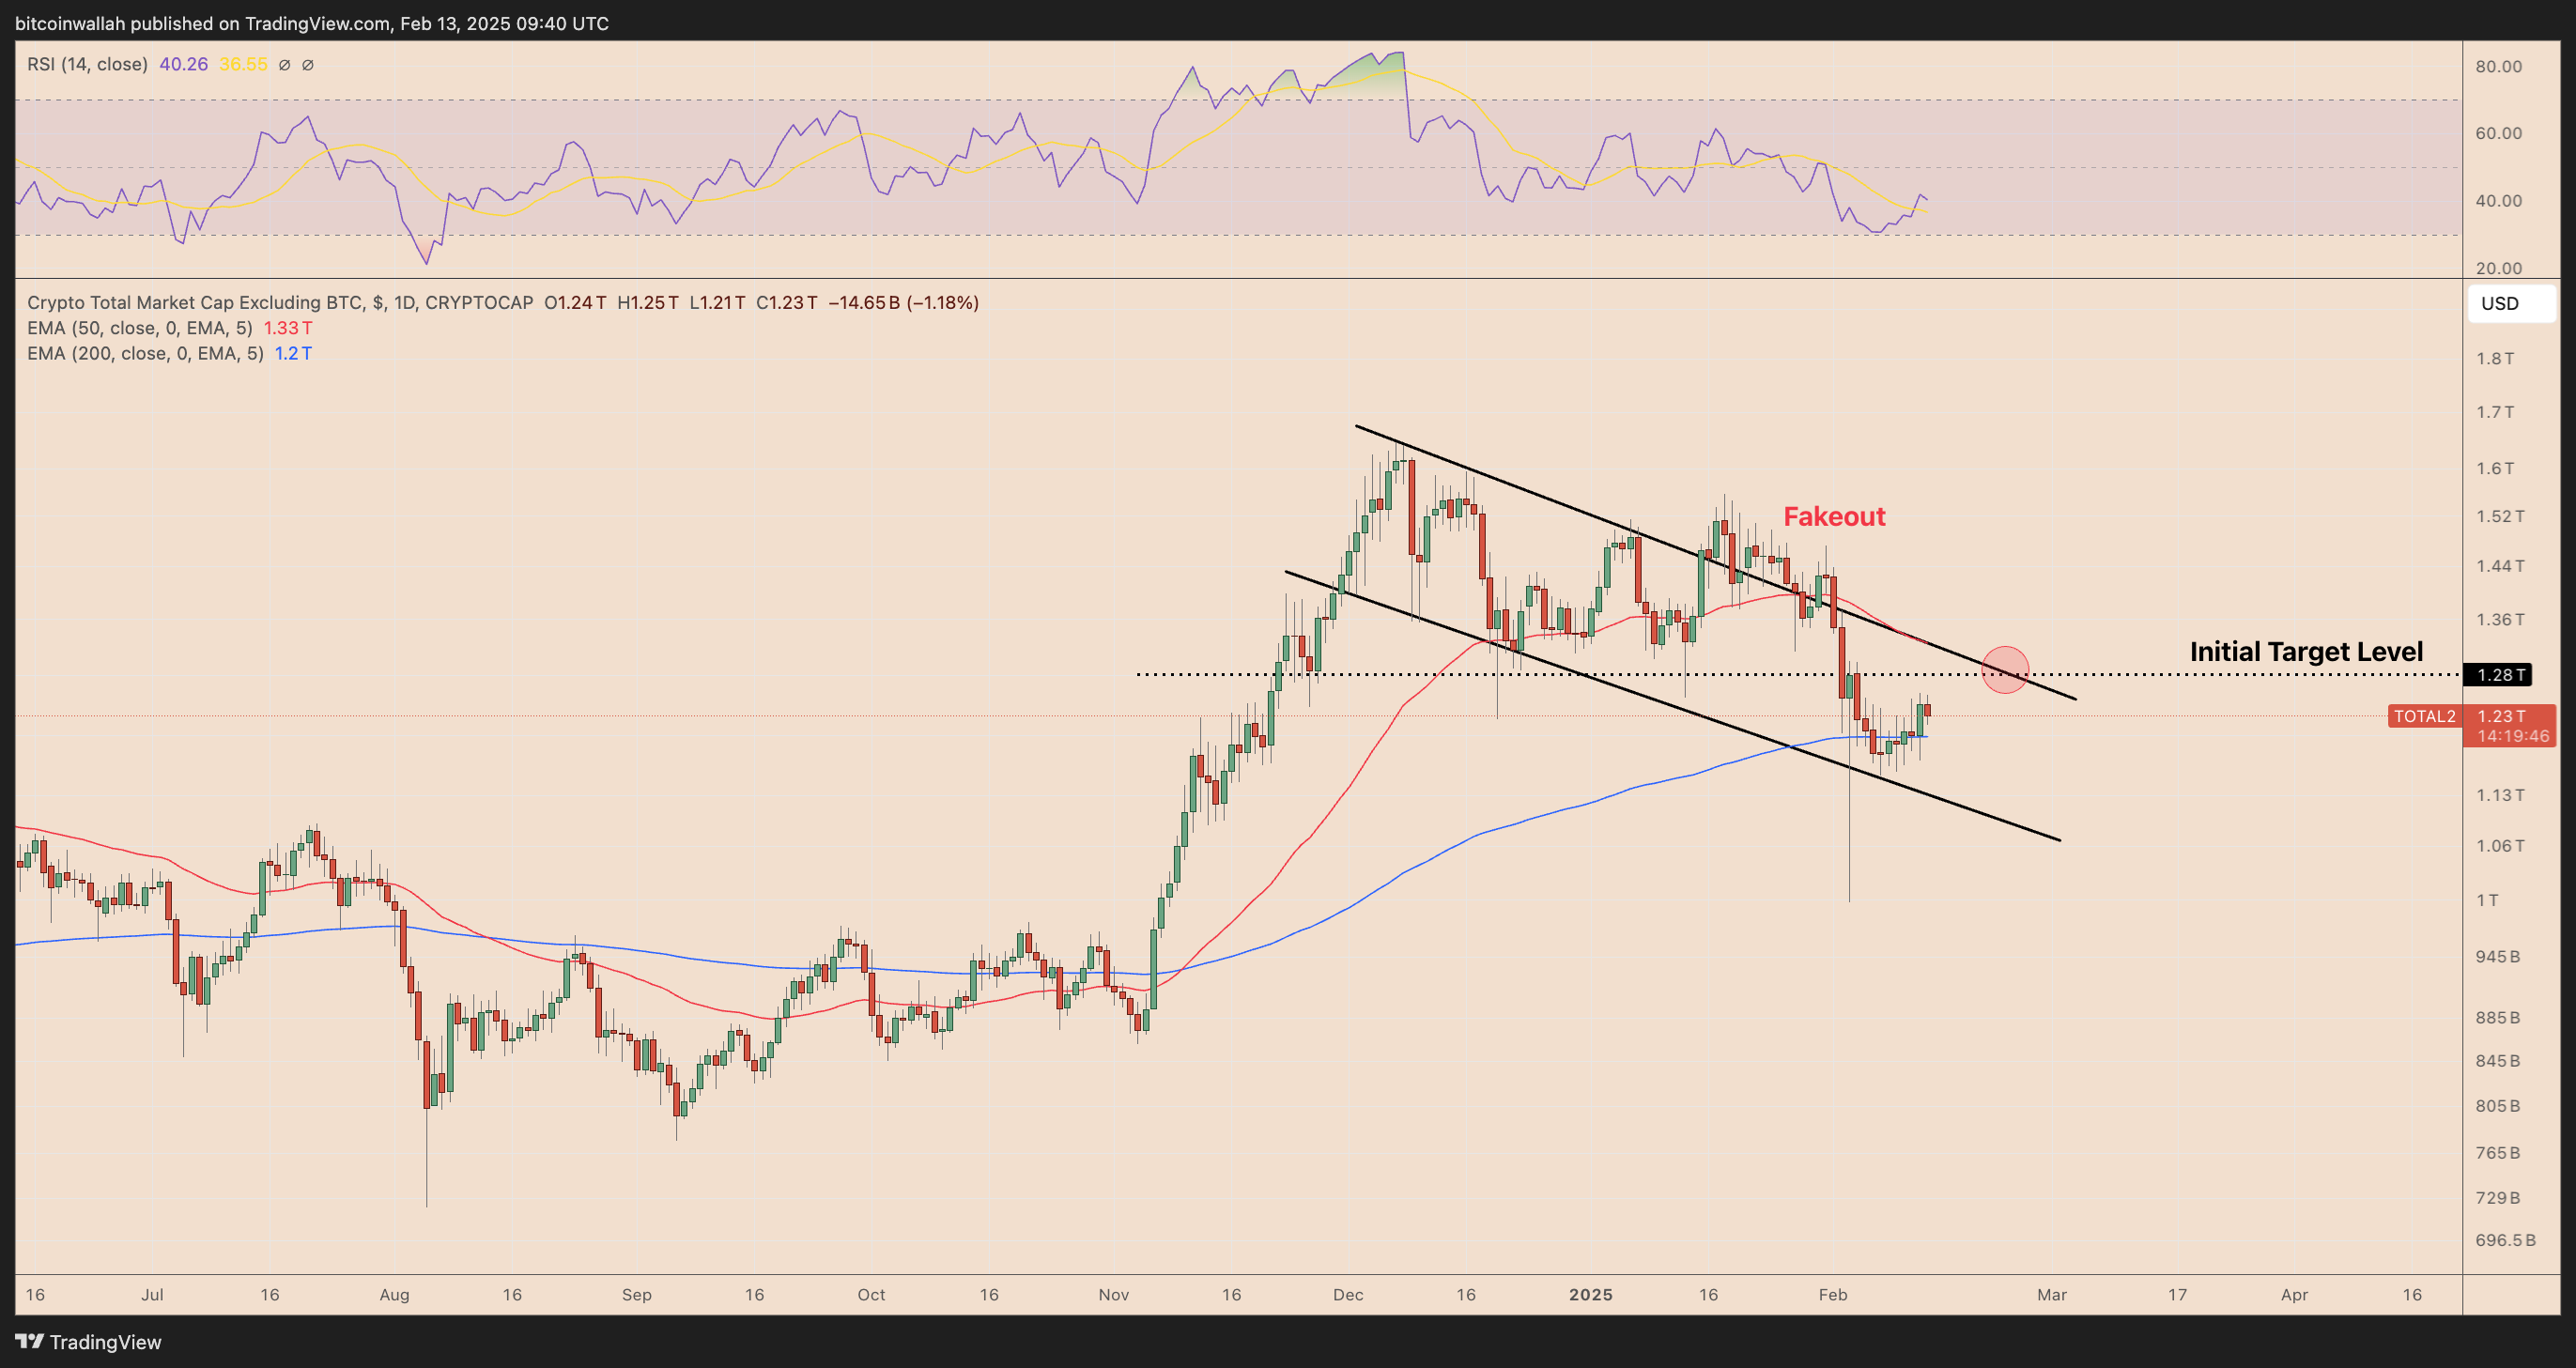
Additionally, it aligns with the upper boundary of the descending channel, reinforcing its relevance as an interim target.
The 50-day EMA at $1.33 trillion also looms overhead, making the $1.28T-$1.33T zone a key decision point for altcoins. A breakout above $1.28T could open the door for further gains, but rejection at this level could trigger another retest of the lower channel support.
While the pattern resembles a potential bull flag, the recent 40% correction from the market top prevents a clear confirmation. Altcoin traders should watch for volume confirmation and Bitcoin’s price action before assuming a decisive breakout.
About the Author
Bob MasonChief Crypto Boss
TEST 30 He has written extensively for a broader audience and his current focus is on developments relating to the financial markets including, but not limited to currencies, commodities, alternative asset classes, and global equities.
Latest news and analysis


Advertisement