
Advertisement
Advertisement
US Dollar Price Forecast: CPI Surprise and Powell’s Remarks Shake Markets – GBP/USD and EUR/USD Outlook
By:
Key Points:
- US CPI rose 0.4% m/m and 3% y/y, exceeding forecasts and raising concerns about persistent inflationary pressures.
- Fed Chair Powell cautioned against overreacting to CPI data, emphasizing the importance of PCE inflation readings.
- The 10-year Treasury yield hit 4.63%, reflecting investor demand for safe-haven assets amid rising uncertainties.

Market Overview
The US dollar gained ground after the latest inflation data revealed stronger-than-expected price increases, signaling potential challenges for the Federal Reserve’s monetary policy. Core CPI rose 0.4% month-over-month, exceeding the 0.3% forecast, while the annual CPI reached 3.0%, slightly above the expected 2.9%. This data suggests inflationary pressures persist, potentially delaying any anticipated rate cuts.
During his testimony, Fed Chair Jerome Powell acknowledged the elevated CPI reading but cautioned against reacting to a single report, emphasizing that the Fed targets PCE inflation as a better gauge. Powell highlighted progress in reducing housing services inflation but noted that the labor market remains tight, with recent reports indicating strong job creation.
Meanwhile, crude oil inventories surged by 4.1M barrels, exceeding the 2.4M forecast, potentially adding to inflationary pressures given oil’s influence on energy costs.
Adding to market uncertainty, President Trump’s remarks about potential reciprocal tariffs have raised concerns over global trade dynamics. This uncertainty is reflected in the bond market, where the 10-year Treasury auction saw a yield of 4.63%, suggesting strong demand for safe-haven assets.
Looking ahead, Thursday’s Producer Price Index (PPI) and unemployment claims will provide further insight into inflation trends and labor market conditions. A higher-than-expected PPI could reinforce inflation concerns, while lower-than-expected unemployment claims might signal ongoing labor market strength.
US Dollar Index (DXY) – Technical Analysis
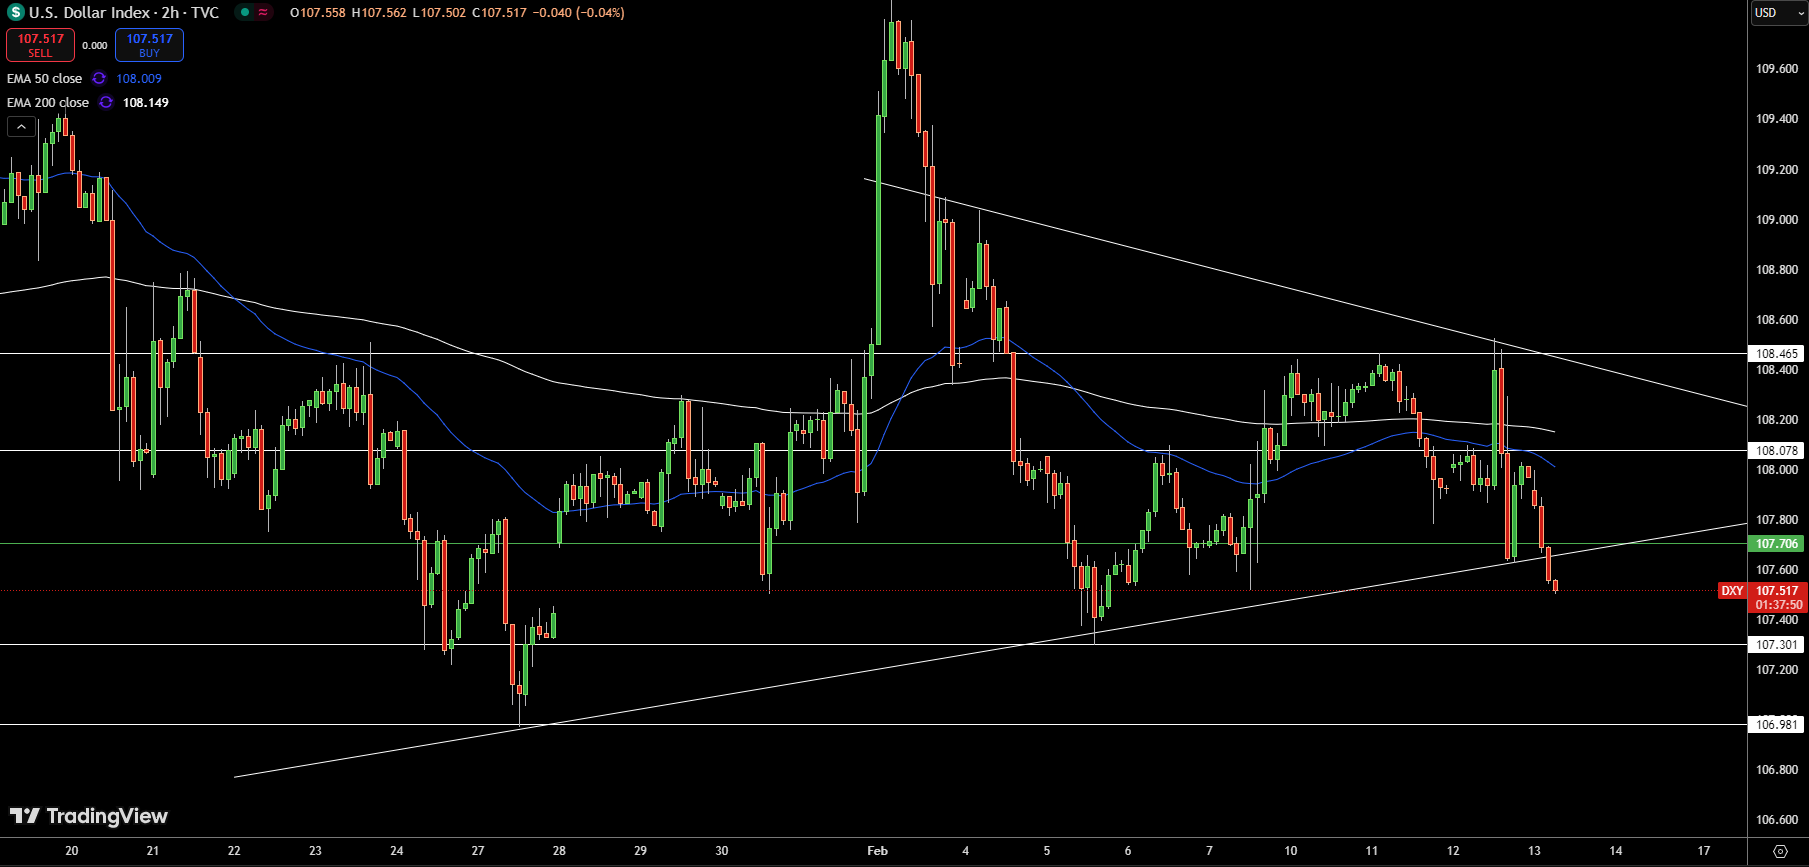
The Dollar Index (DXY) is trading at 107.519, slipping below its pivot point at 107.706, suggesting potential downside momentum. A three black crows candlestick pattern has emerged, indicating increased bearish sentiment. Immediate support lies at 107.301, and a break below this level could accelerate losses toward 106.981.
On the upside, resistance is seen at 108.078, with a move above this level potentially reversing the current bearish bias. The 50-day EMA at 108.009 and 200-day EMA at 108.149 signal ongoing pressure on the index, with sellers maintaining control.
As long as the DXY remains below 107.706, the bearish trend persists. Traders should monitor volume activity for confirmation of a continued decline.
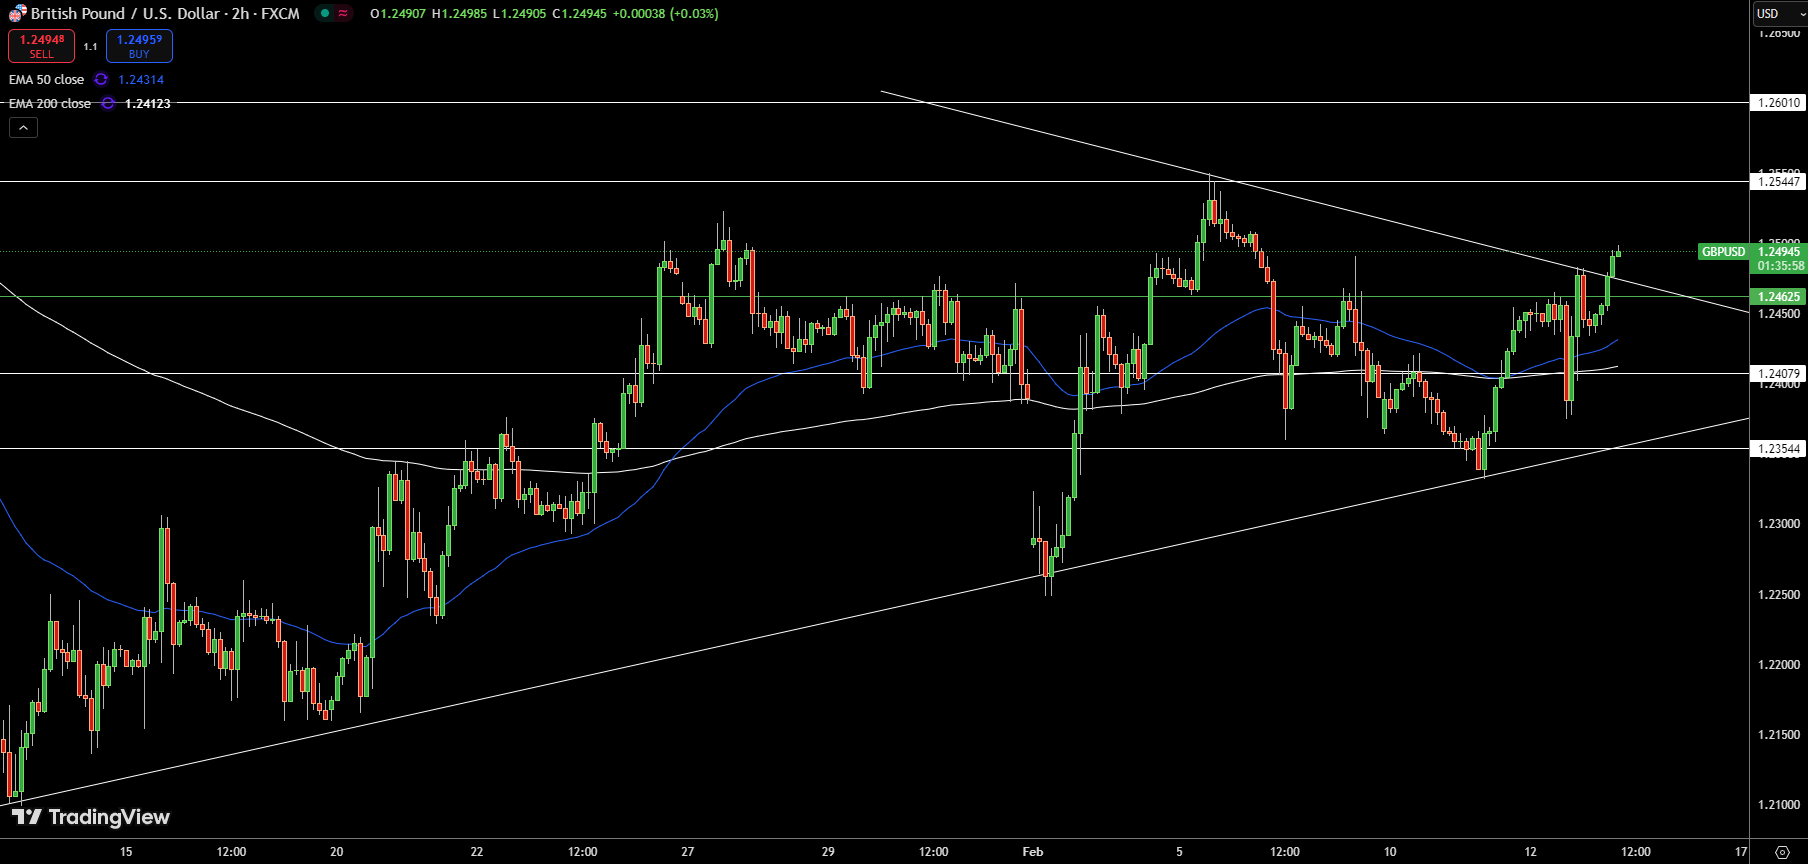
GBP/USD Technical Analysis

GBP/USD is trading at 1.24962, maintaining a bullish stance above its pivot point at 1.24625. The pair recently broke above a downward trendline, signaling a potential continuation of the uptrend. Immediate resistance is seen at 1.25447, and a break above this level could push prices toward 1.26010, reinforcing buying momentum.
On the downside, 1.24079 serves as key support, with a drop below this level potentially accelerating selling pressure toward 1.23544. The 50-day EMA at 1.24314 and 200-day EMA at 1.24123 indicate a strengthening bullish outlook.
As long as GBP/USD holds above 1.24625, the buying trend remains intact, but failure to sustain this level could lead to a deeper pullback.
EUR/USD Technical Forecast
EUR/USD is trading at 1.04377, showing slight weakness but holding above its pivot point at 1.04180. The pair is attempting to build momentum after breaking a downward trendline, signaling a potential bullish move. However, immediate resistance at 1.04790 needs to be cleared before a stronger rally toward 1.05325 can materialize.
On the downside, 1.03790 serves as key support, with a break below this level potentially driving the pair toward 1.03256, where further selling pressure could emerge. The 50-day EMA at 1.03643 and 200-day EMA at 1.03673 indicate a neutral bias, suggesting the next decisive move hinges on price action around the pivot.
Traders may look for buying opportunities above 1.04180, but a drop below this level could invite sharp selling pressure.
About the Author
Bob MasonChief Crypto Boss
TEST 30 He has written extensively for a broader audience and his current focus is on developments relating to the financial markets including, but not limited to currencies, commodities, alternative asset classes, and global equities.
Latest news and analysis


Advertisement