
Advertisement
Advertisement
ADA, XRP, SOL Soar After Trump’s Crypto Reserve Push — How High Can They Go Next?
By:
Key Points:
- Cardano (ADA) faces a short-term correction after surging 50%, but holding $0.823 support could propel it toward $1.63.
- Solana (SOL) is testing $180 resistance—a breakout could lead to $260, while rejection may push it to $140.
- XRP (XRP) struggles at $2.95 resistance; a breakout targets $4.26, while failure could send it to $2.50 support.

The cryptocurrency market has experienced a massive surge—particularly among altcoins—following President Donald Trump’s announcement of a U.S. Crypto Strategic Reserve.
Bitcoin (BTC) has rebounded strongly, surpassing the $90,000 psychological threshold to trade at approximately $93,500, marking a 9% increase over the last 24 hours.
Altcoins have outperformed Bitcoin during this rally:
- Cardano (ADA): The price of ADA has surged by over 50% to $1 in the past 24 hours.
- XRP (XRP): This token has experienced a 20% increase, reaching $2.69.
- Solana (SOL): SOL has risen by over 16.50% to $165.
Let’s examine how high these altcoins can go amid the Trump-led euphoria.
Cardano (ADA) Technical Analysis
Cardano’s ADA token has achieved its falling wedge breakout target, surging nearly 50% in a rapid rally that saw it peak at $1.17.
However, the sharp rise has triggered a wave of profit-taking, with ADA already down over 15% intraday as of March 3. The decline follows the Relative Strength Index (RSI) surpassing 70, signaling overbought conditions and a likely short-term correction.
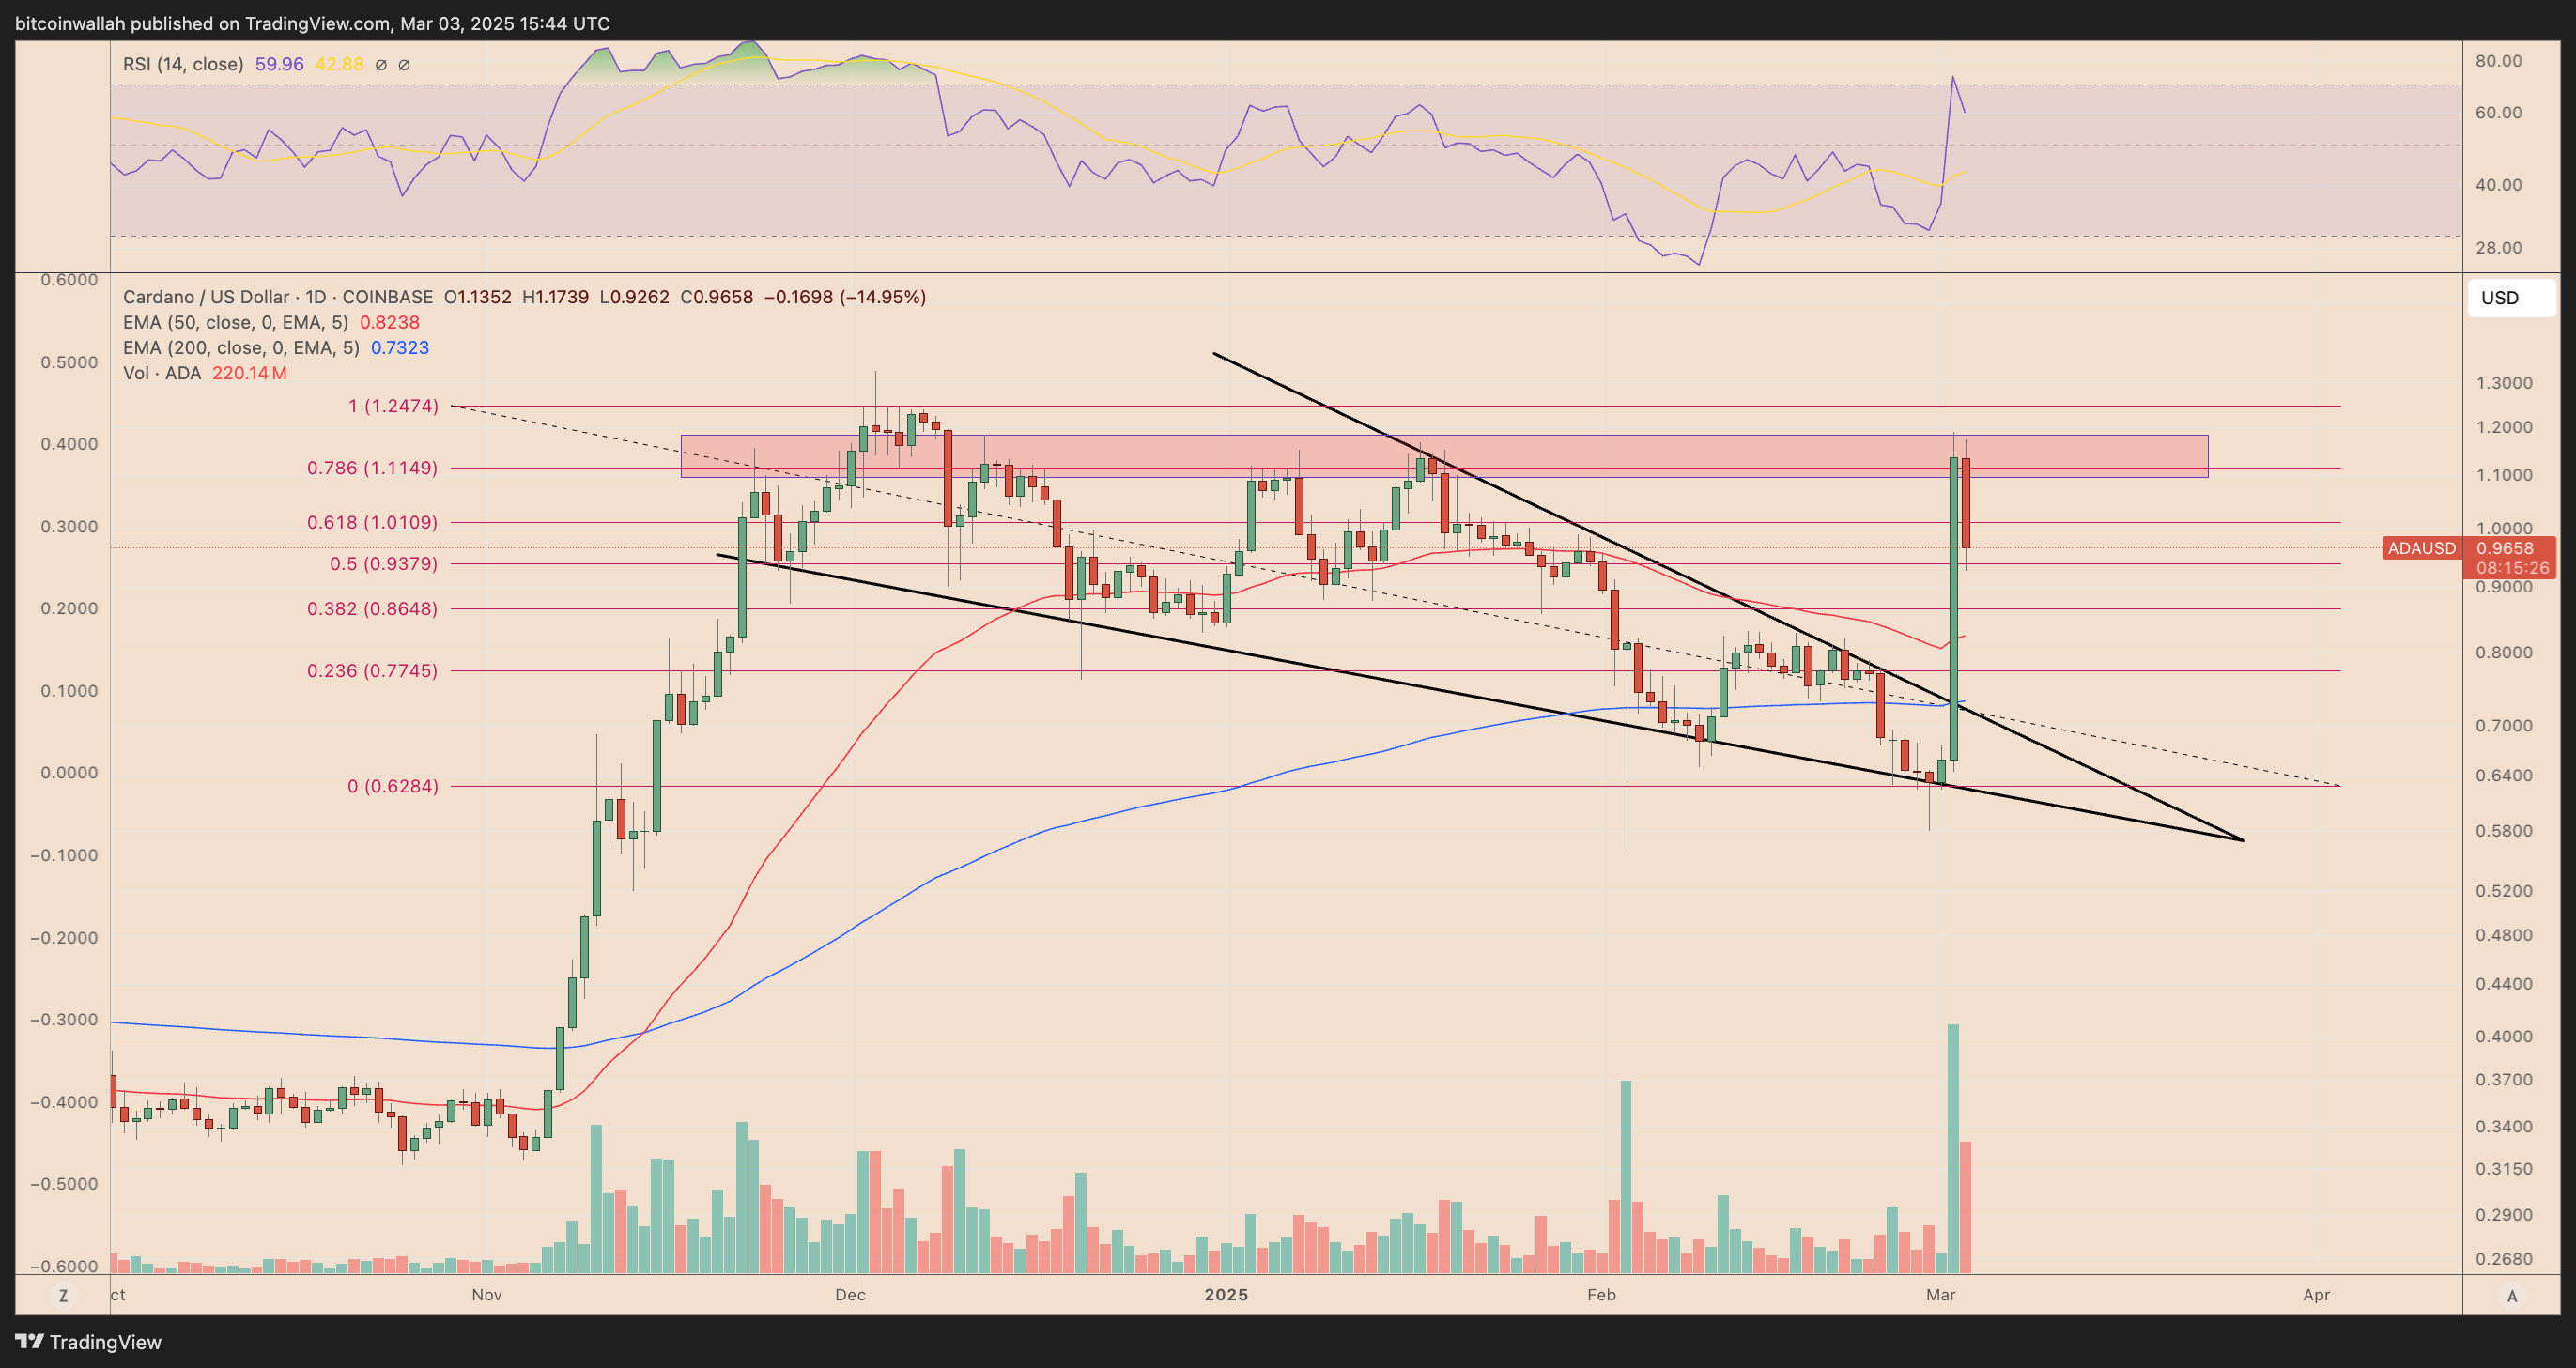
Technical indicators suggest that ADA could extend its pullback toward the 50-day Exponential Moving Average (EMA) at $0.823, a critical support level.
Holding above this mark may provide bulls with enough momentum for another attempt at breaking resistance around the $1.25 level, which aligns with the 1.0 Fibonacci retracement line.
A successful reclaim of this resistance could open the doors for a larger uptrend, particularly if speculation around a potential Cardano ETF gains traction. Such a development could fuel further upside, pushing ADA toward the 1.618 Fib retracement target of $1.63 in the near future.
Solana (SOL) Technical Analysis
SOL is currently testing a critical support-turned-resistance zone around $180, a level that could determine its short-term trajectory. The cryptocurrency has already slipped by over 11% intraday, reflecting increased selling pressure near this key price point.
A continued rejection at this level could reinforce bearish momentum, potentially leading to a death cross scenario, where the 50-day Exponential Moving Average (EMA) crosses below the 200-day EMA.
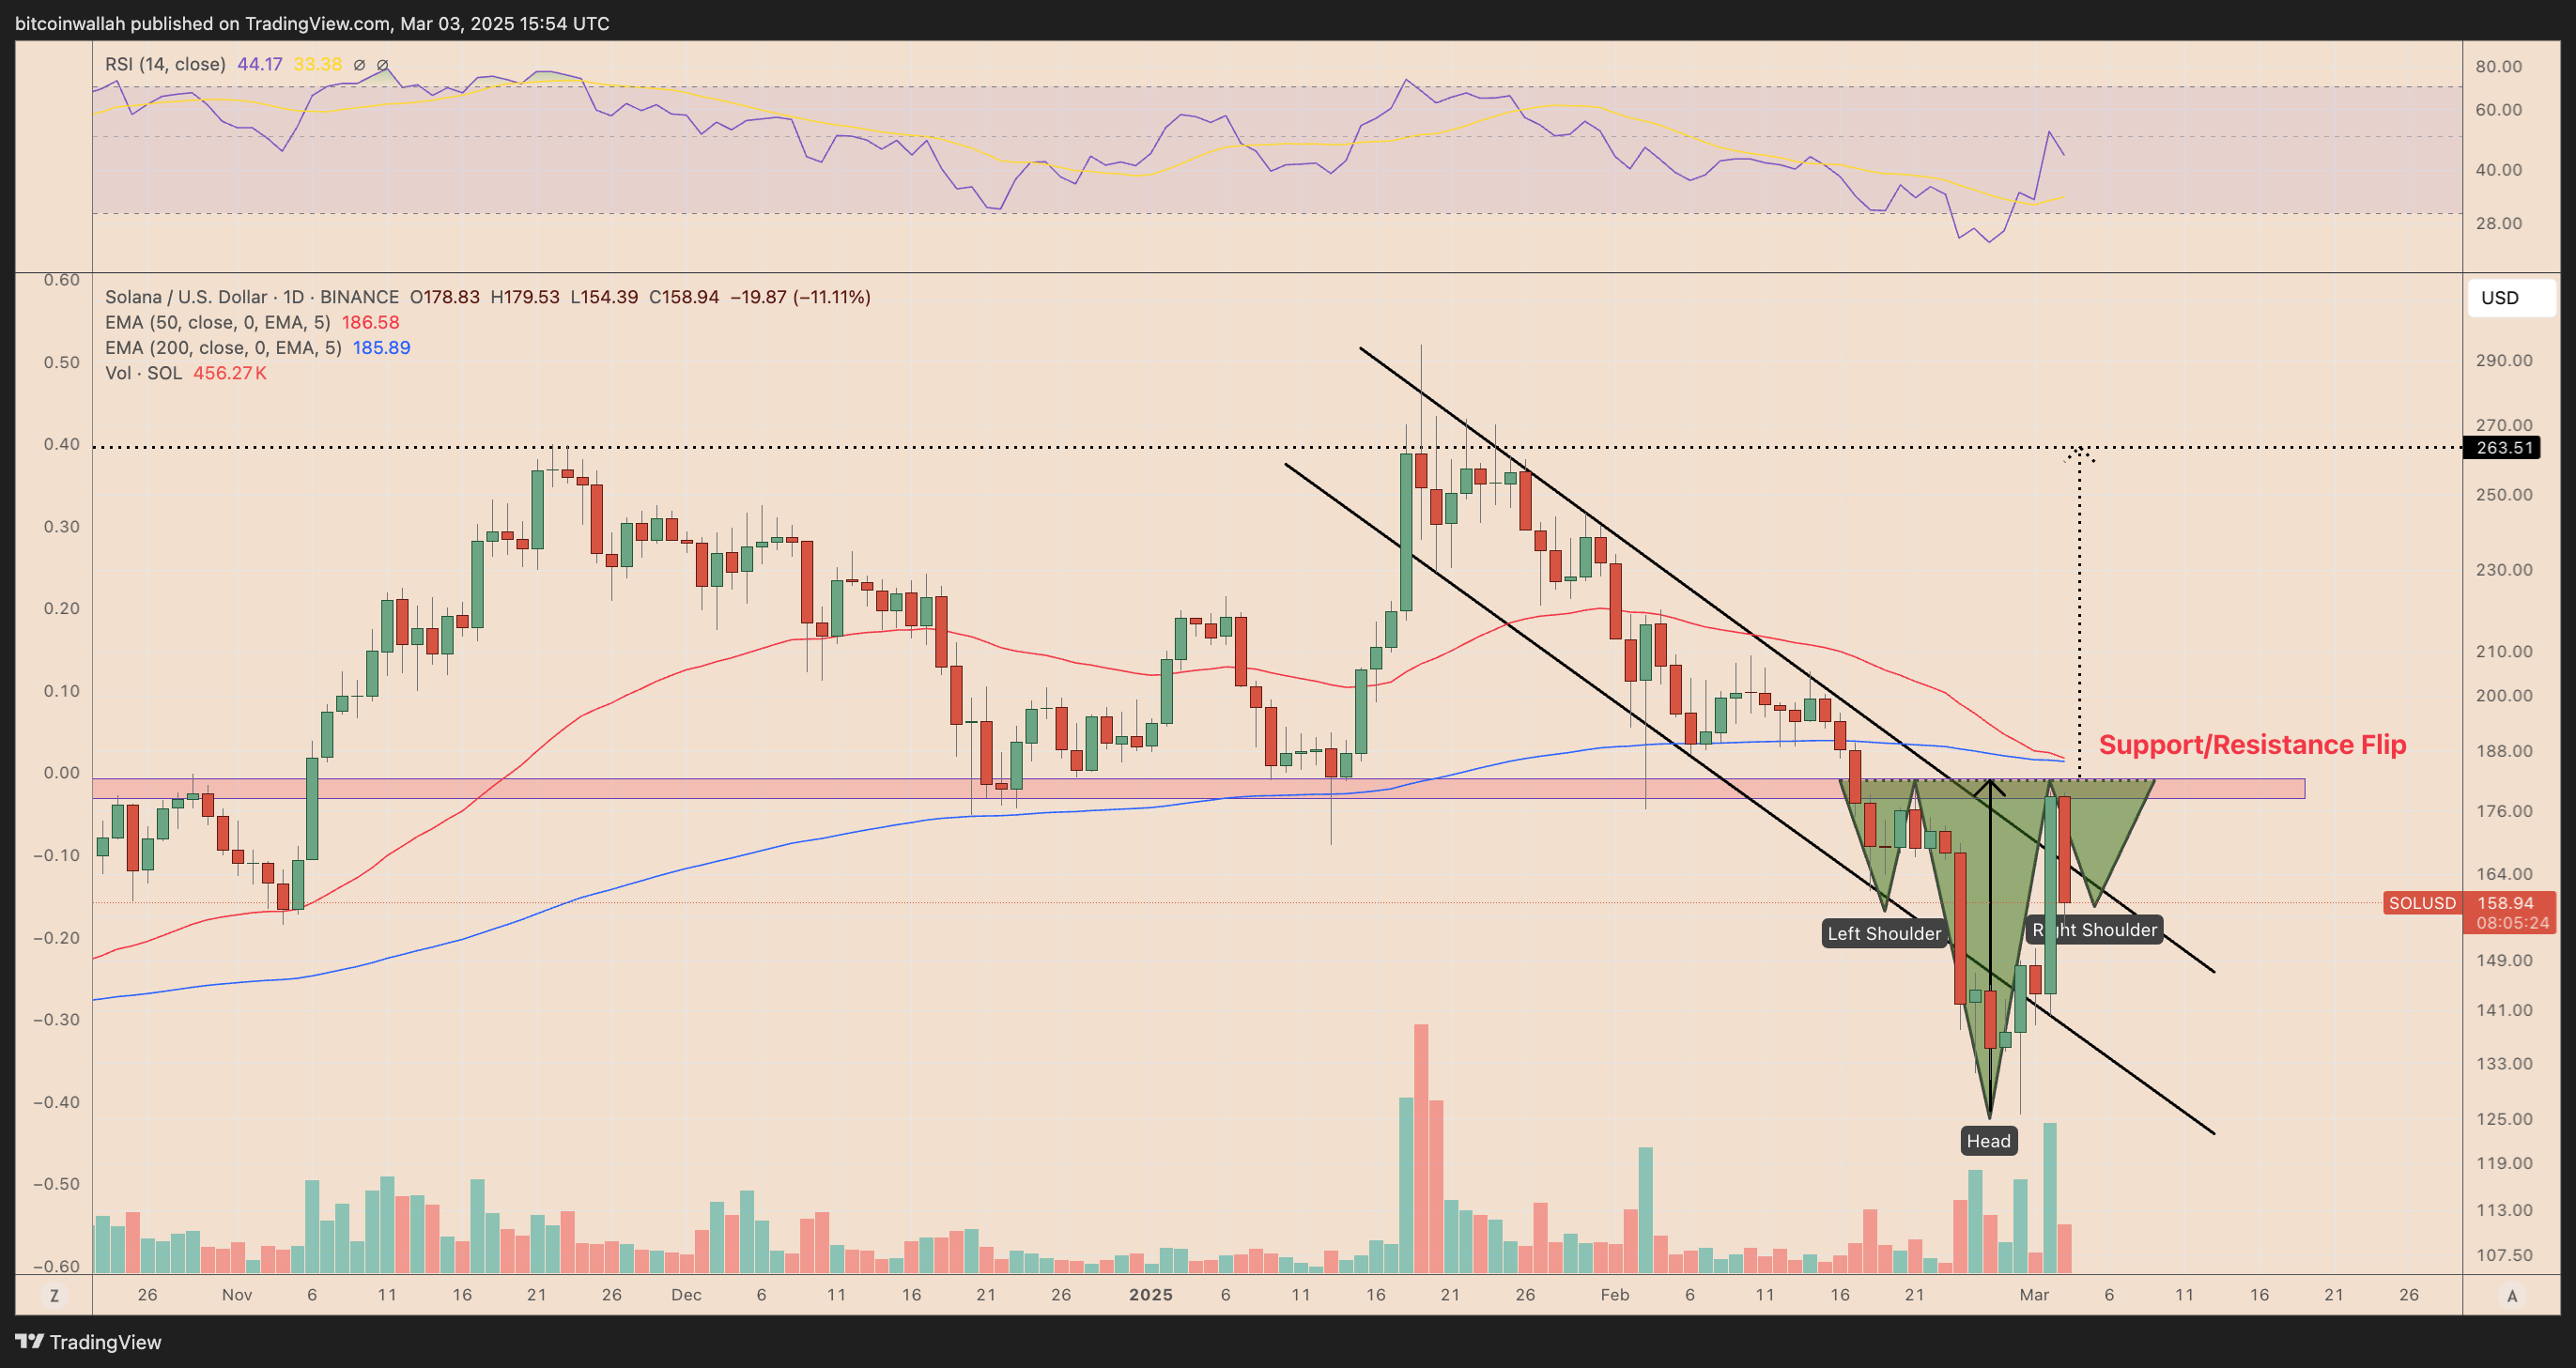
If confirmed, this crossover could drive SOL’s price toward the lower boundary of its descending channel pattern, located around $140.
However, there is a growing case for a bullish reversal. If Solana manages to bounce off the channel’s upper trendline, it could complete the formation of an inverse head and shoulders (H&S) pattern—a classic bullish setup.
In this scenario, a decisive breakout above the H&S neckline resistance at $180 could propel SOL toward a measured target of $260, aligning with its previous highs.
XRP (XRP) Technical Outlook
XRP has once again failed to break out of its ascending triangle pattern, facing rejection near the upper trendline and slipping over 11% intraday. This pullback suggests a potential retest of the triangle’s lower boundary, currently hovering around $2.50, as traders take profits after the latest breakout attempt.
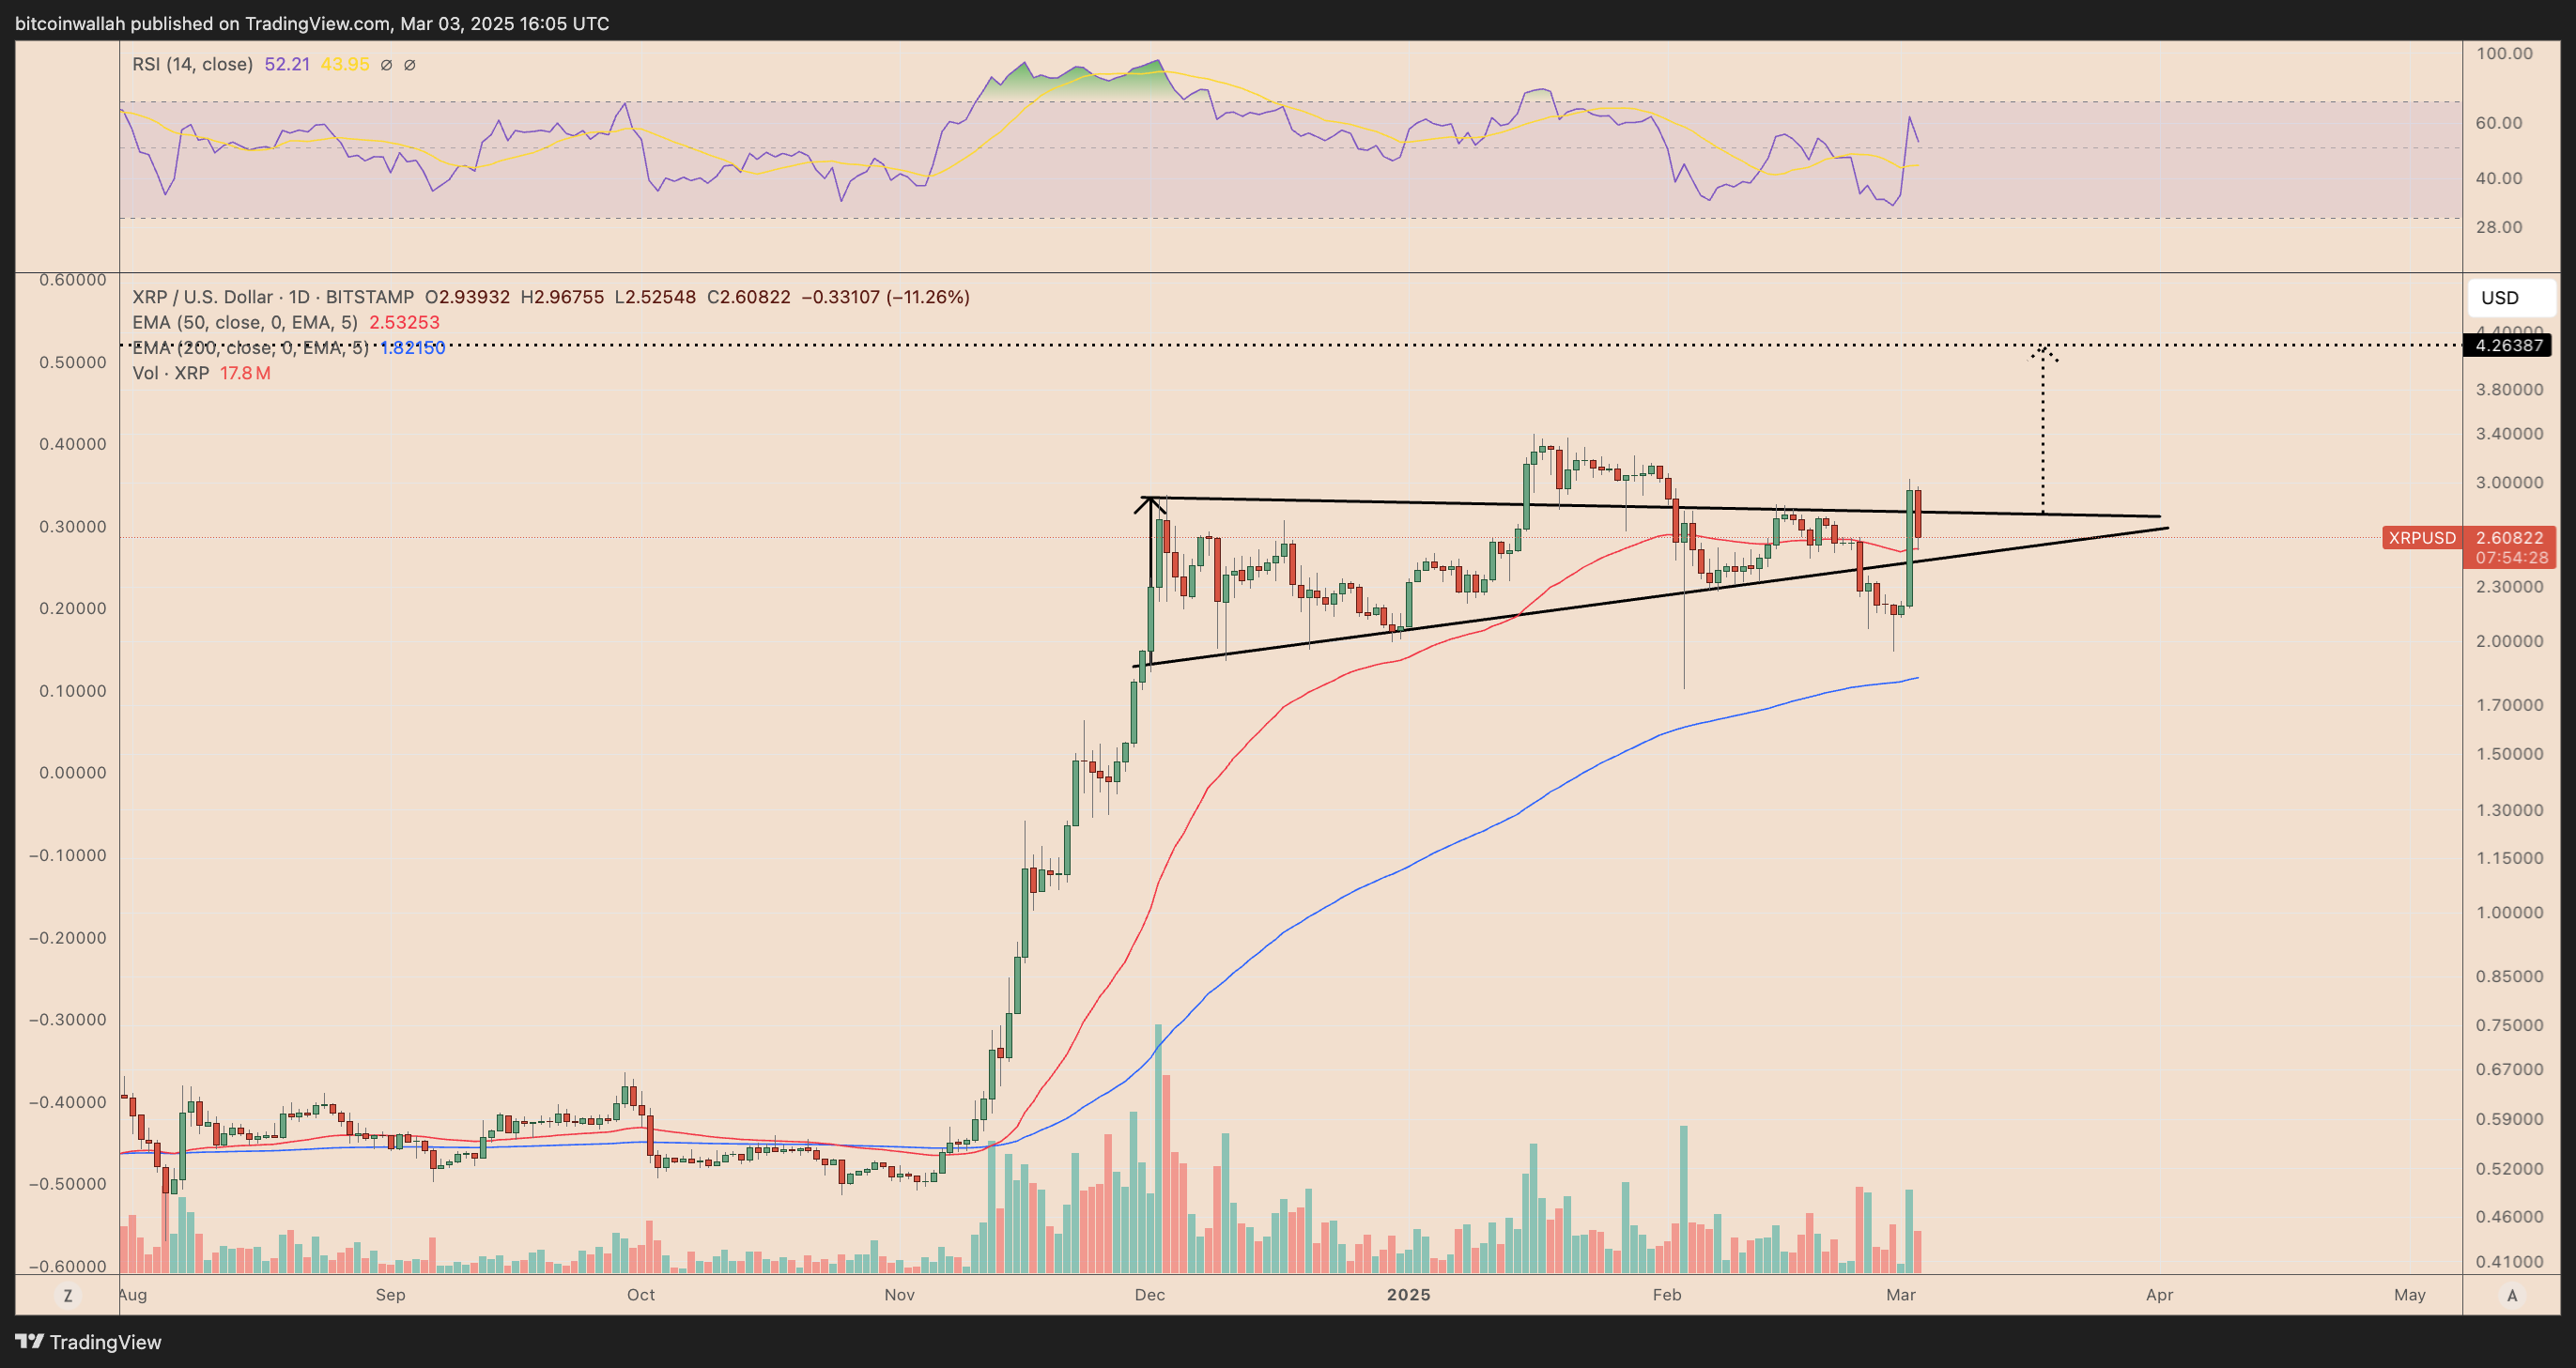
The ascending triangle remains a key technical formation for XRP. If buyers step in near $2.50, the structure remains intact, increasing the likelihood of another breakout attempt in the coming days. However, a decisive breakdown below this level could invalidate the bullish setup and trigger a deeper correction.
On the upside, a successful breakout above the $2.95 resistance level could fuel a strong rally, with a measured move target near $4.26. This aligns with XRP’s previous highs and could mark a continuation of its longer-term uptrend.
About the Author
Bob MasonChief Crypto Boss
TEST 30 He has written extensively for a broader audience and his current focus is on developments relating to the financial markets including, but not limited to currencies, commodities, alternative asset classes, and global equities.
Latest news and analysis


Advertisement