
Advertisement
Advertisement
Gold Price Forecast: Bearish Reversal Triggered as Sellers Take Control
By:
Gold broke below key support at $2,893, signaling bearish momentum. Further downside targets include $2,813 and $2,764, while resistance looms at $2,892 and $2,888.
Gold triggered a bearish reversal on Thursday as it fell through the 20-Day MA at $2,893 and a prior weekly low at $2,853. This is the first lower weekly low in eight weeks and when combined with the moving average breakdown shows sellers in control.
A reversal week is indicated if this week ends with gold below last week’s low of $2,878. The low for the day was $2,868 and gold continues to trade near the lows of the day, at the time of this writing. It looks likely to end today’s session in a bearish position, below the 20-Day MA and in the lower third of the day’s trading range.
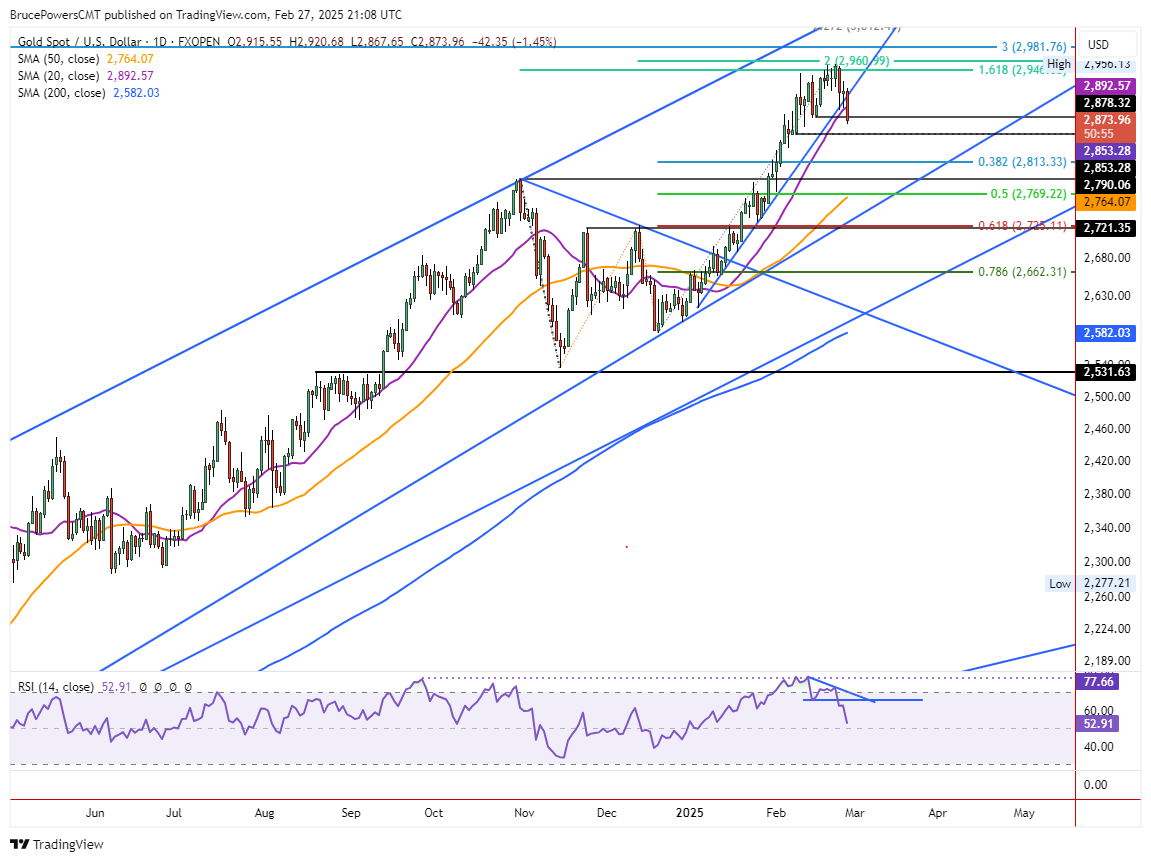
Next Lower Target is $2,813
The next downside target is the three-week low at $2,813. However, given today’s bearish momentum and decline below key price levels, it looks likely that the three-week low will also fail as support. Further down is the minimum anticipated 38.2% Fibonacci retracement at $2,813, which may show signs of support.
Nevertheless, once one key moving average is broken the next higher moving average becomes a potential target. Therefore, the 50-Day MA is a maximum lower target for the correction. It is currently at $2,764 and rising, therefore close to converging with the 50% retracement level at $2,769.
Lower Potential Targets
A long-term bull trend continuation signal was generated in late-January on a breakout above the prior trend high at $2,790. That price level was resistance for the uptrend for approximately 13 weeks before it was surpassed. Therefore, it could easily be tested as support during a bearish retracement. Furthermore, since the 50-Day line is rising, it could converge with the former $2,790 high before it is reached.
Or certainly be in the vicinity of that price level. Nonetheless, it can also be considered the top of a potential support range going down to the 50% retracement at $2,769. This is assuming that the 50-Day line matches or exceeds the 50% retracement in the coming days or weeks.
Signs of Strength to Face Downward Pressure
Rallies will likely be used by investors to exit long positions and enter shorts. The 20-Day MA at $2,892 is an obvious potential resistance along with the lows of the previous couple of days at $2,888. Finally, since the month of February ends tomorrow, gold is at risk of ending the month in a relatively weak position in the lower half of the month’s trading range.
For a look at all of today’s economic events, check out our economic calendar.
About the Author
Bruce Powerscontributor
Bruce has been involved in the financial markets for over 20 years, as an analyst, trader, educator, and writer.
Latest news and analysis


Advertisement