
Advertisement
Advertisement
Natural Gas Price Forecast: Faces Deeper Pullback Amid Trendline Breakdown
By:
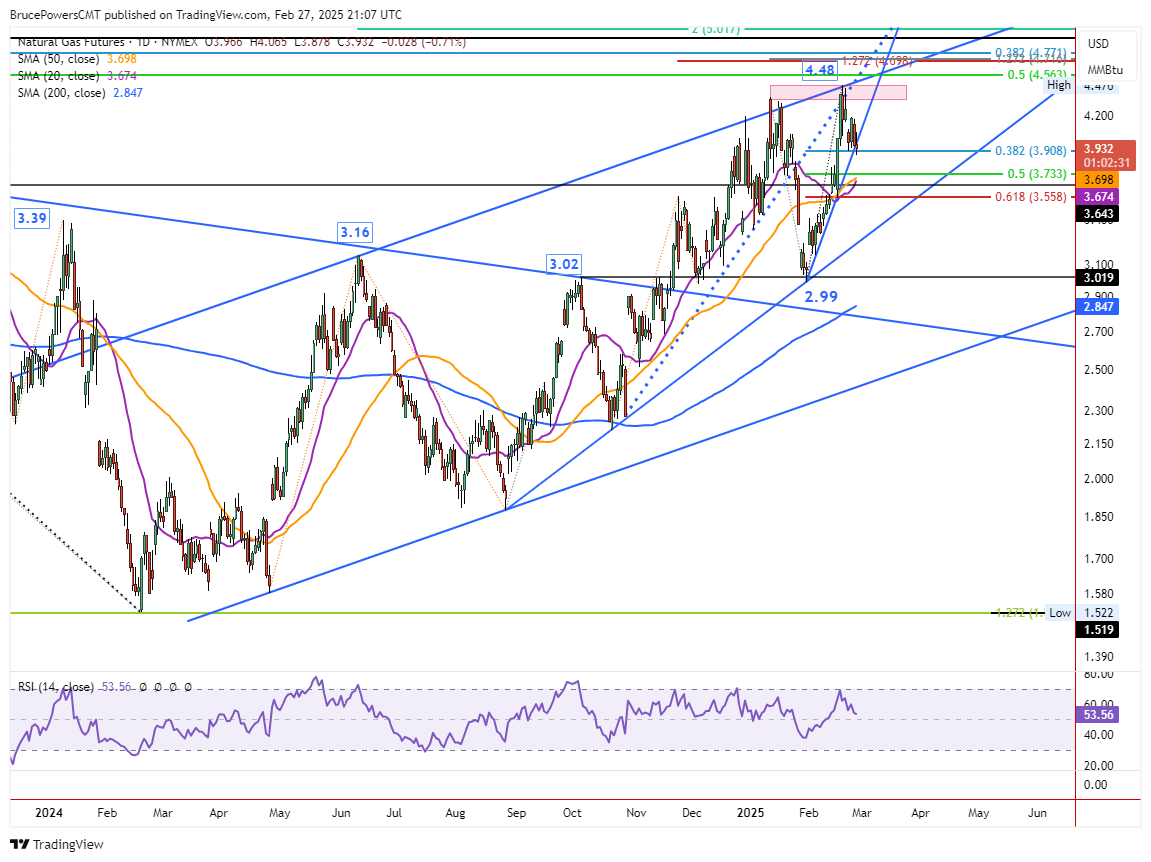
Natural gas broke key support at $3.91, triggering a bearish continuation. A deeper pullback is likely unless prices reclaim $4.07 and surpass $4.19 resistance.
Natural gas triggered a continuation of a bearish retracement on Thursday as it fell through support from Monday at $3.91. Moreover, today’s decline triggered a breakdown from a rising trendline marking dynamic support for the recent advance. The low of the day at the time of this writing was $3.88 and the day’s high was $4.065, leaving natural gas with a lower daily high and lower daily low for the day. Despite the bearish signal, follow-through is key.
An intraday bounce followed the $3.88 low with natural gas rising above the trendline and into a recent three-day consolidation zone. If today’s session ends above the trendline it will indicate stronger demand that what might be anticipated following a breakdown through key near-term support. Wednesday’s low of $3.94 can be used as a rough proxy for the trendline. Moreover, a daily closing price below the trendline will show sellers remaining in control.
Failed Breakdown on Rally Above $4.07
It is possible that today’s breakdown fails and instead support is retained, leading a rally. A decisive breakout above today’s high of $4.07 would provide a sign of strength that could lead to higher prices. Subsequently, Tuesday’s high at $4.19 would need to be exceeded for additional bullish confirmation. There is a price range of potentially significant resistance around the two most recent swing highs from $4.37 to $4.48.
Deeper Retracement More Likely
Nonetheless, given today’s bearish signal, the more likely scenario to play out is a deeper bearish pullback. Although there is an interim potential support zone around the 50% retracement at $3.73, it also begins a range of potential support going down to a weekly low at $3.55. Both the 20-Day and 50-Day MAs are rising and may converge with the 50% zone prior to it being tested as support.
If that happens it may provide a more significant support area given the convergence of several indicators. Further, the 20-Day MA is poised to cross above the 50-Day line, providing another sign of strength. Since the 50-Day MA covers a larger trend than the 20-Day line, it is given priority.
It is also interesting to note that on the weekly chart (not shown) support for this week is around the 200-Week MA, now at $3.92. The low for the week is today’s low at $3.88.
For a look at all of today’s economic events, check out our economic calendar.
About the Author
Bruce Powerscontributor
Bruce has been involved in the financial markets for over 20 years, as an analyst, trader, educator, and writer.
Latest news and analysis


Advertisement