
Advertisement
Advertisement
Gold Price Forecast: Retreats After Hitting $2,882 Record High
By:
Gold retreated after reaching $2,882, signaling a potential pullback as it nears resistance, with $2,790 identified as key support in case of further weakness.
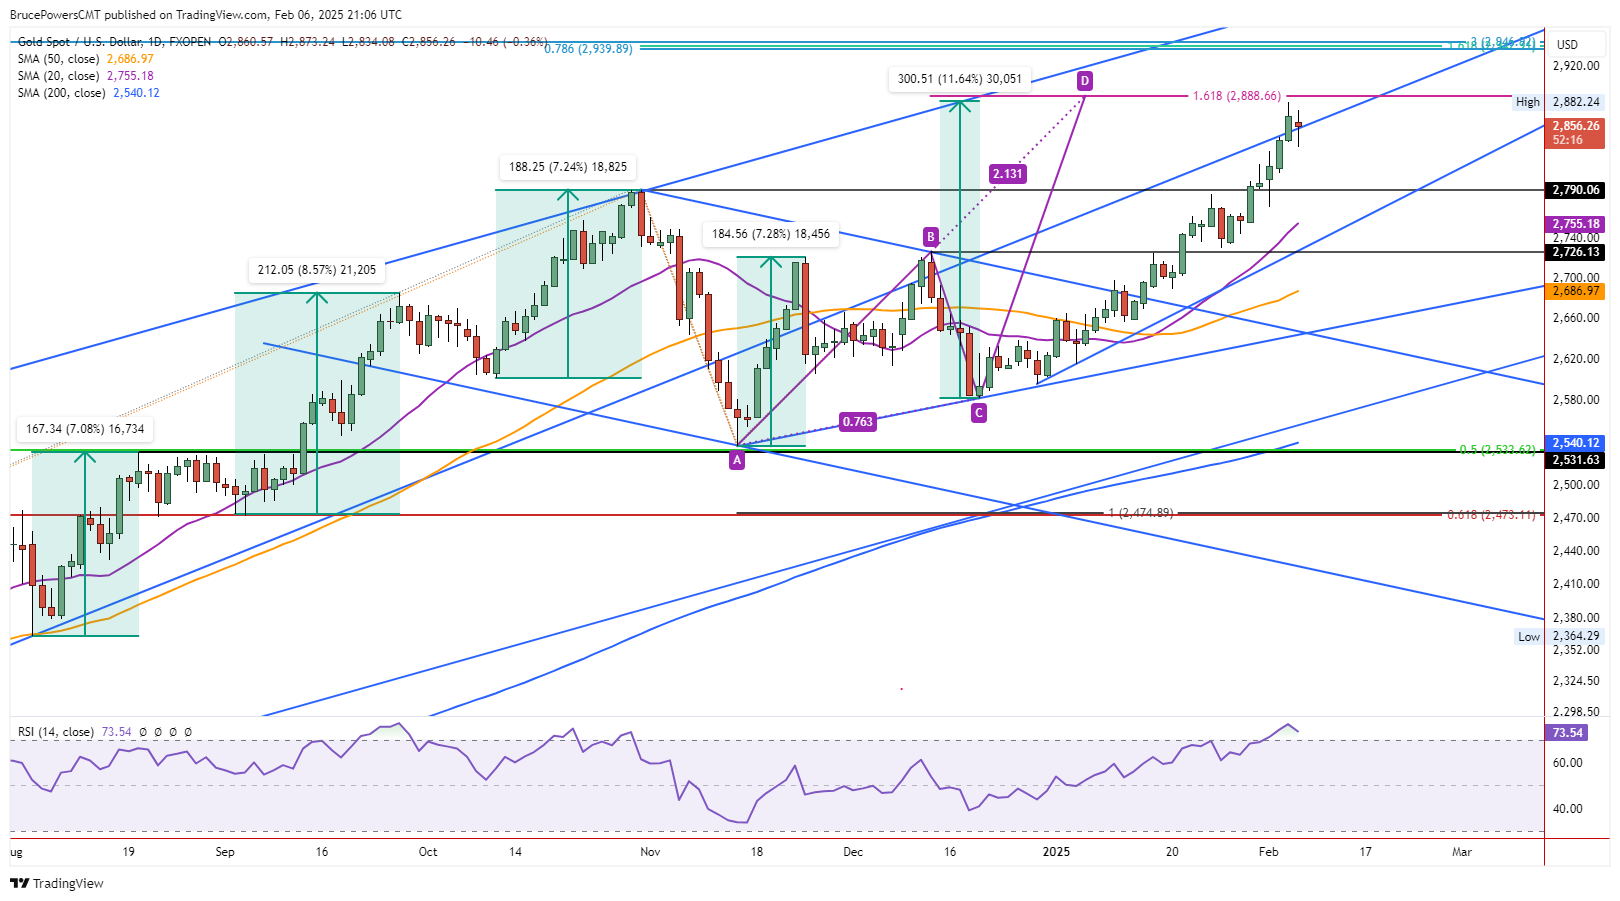
Following a new record high of $2,882 hit during Wednesday session, gold pulled back on Thursday and will likely leave a lower daily high and lower daily low for the day. Yesterday’s high follows the completion of an extended upside target from a rising ABCD pattern where the CD leg of the advance was 161.8% (golden ratio) of the first leg up, labeled AB.
Therefore, the advance in the price of gold during the second leg up has a harmonic relationship with the price change seen in the first leg. Once that happens, a potential pivot level has been identified. Given the subsequent bearish reaction following the $2, 882, it looks like the market recognized the area around the price target. Although it was not a direct hit, as the target was at $2,889, it was close enough given the bearish reaction.
Consolidation or Pullback May be Next
Moreover, the next potential resistance level on the chart is $2,940. That leaves a bit of a gap above the $2,889 price level to the next target. Gold will be in a better position to fill that gap and make a run for the next higher target price once there is a rest of some degree, either taking the form of a deeper pullback or consolidation. Gold has had a strong run rising as much as $300 or 11.6% since completing a swing low at $2,582 (C) in December.
On a relative performance basis, that is the strongest upswing of the prior eight and reflects strong underlying momentum. But it also indicates that at least a temporary high may have been reached, for now. The full upswing, beginning from the November swing low at $2,537 (A), had a gain of as much as $345 or 13.6%.
Further Weakness Indicated Below $2,834
A drop below today’s low of $2,834 will signal further weakness and increase the chance for a deeper pullback. The recent breakout level and prior trend high at 2,790 becomes a potential support area and has a good chance of being tested, at a minimum if a pullback deepens. If support is tested around that price level and it is followed by a bullish reversal, that will be a sign of strength and could end the correction, if it comes.
For a look at all of today’s economic events, check out our economic calendar.
About the Author
Bruce Powerscontributor
Bruce has been involved in the financial markets for over 20 years, as an analyst, trader, educator, and writer.
Latest news and analysis


Advertisement