
Advertisement
Advertisement
Gold, Silver and US Dollar Technical Analysis: Nonfarm Payroll Report Could Drive Next Move
By:
Key Points:
- Gold (XAU) finds support before the release of nonfarm payroll data.
- Silver (XAG) consolidations indicate positive price development.
- The US Dollar Index (DXY) remains highly volatile due to economic uncertainties.

Donald Trump’s recent tariff threats and reversals on Canada and Mexico have weakened the US Dollar. This volatility highlights growing uncertainty surrounding US trade and monetary policies. Despite the short-term weakness, the US Dollar’s long-term trend remains upward.
Moreover, the 10-year Treasury yield fell below 4.5%, reducing inflation concerns. This decline and the Fed’s pause on rate hikes have eased pressure on long-term interest rates. As a result, lower yields have made gold (XAU) more attractive by reducing the opportunity cost of holding non-yielding assets. Gold has surged to record levels above $2,795 and aims for $3,000. Geopolitical and economic uncertainties are fueling safe-haven demand, supporting this upward move. In contrast, silver (XAG) lags due to its heavy reliance on industrial demand, which lacks strong growth catalysts.
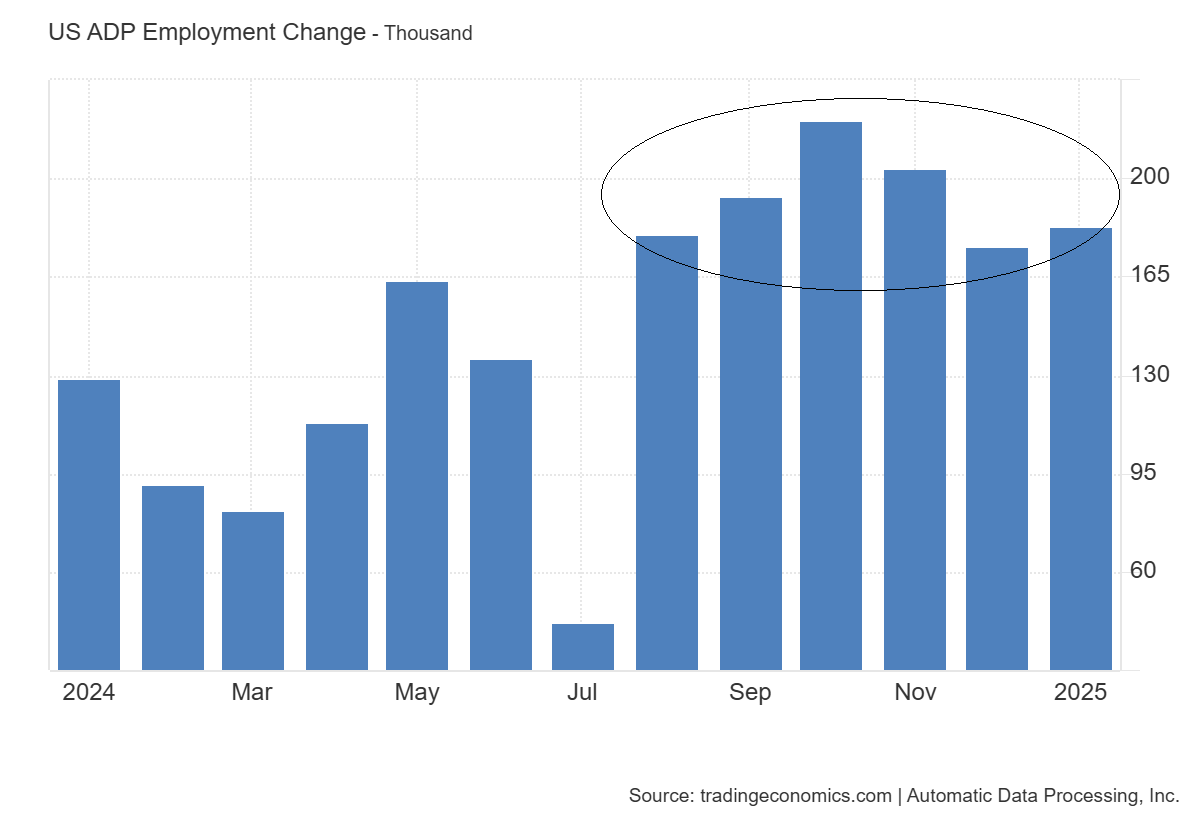
The chart below shows the change in US ADP employment. Private businesses added 183,000 workers in the US, surpassing the revised 176,000 jobs in December 2024 and the forecast of 150,000. Nela Richardson, ADP’s Chief Economist, said consumer-facing industries led job growth while business services and production lagged.
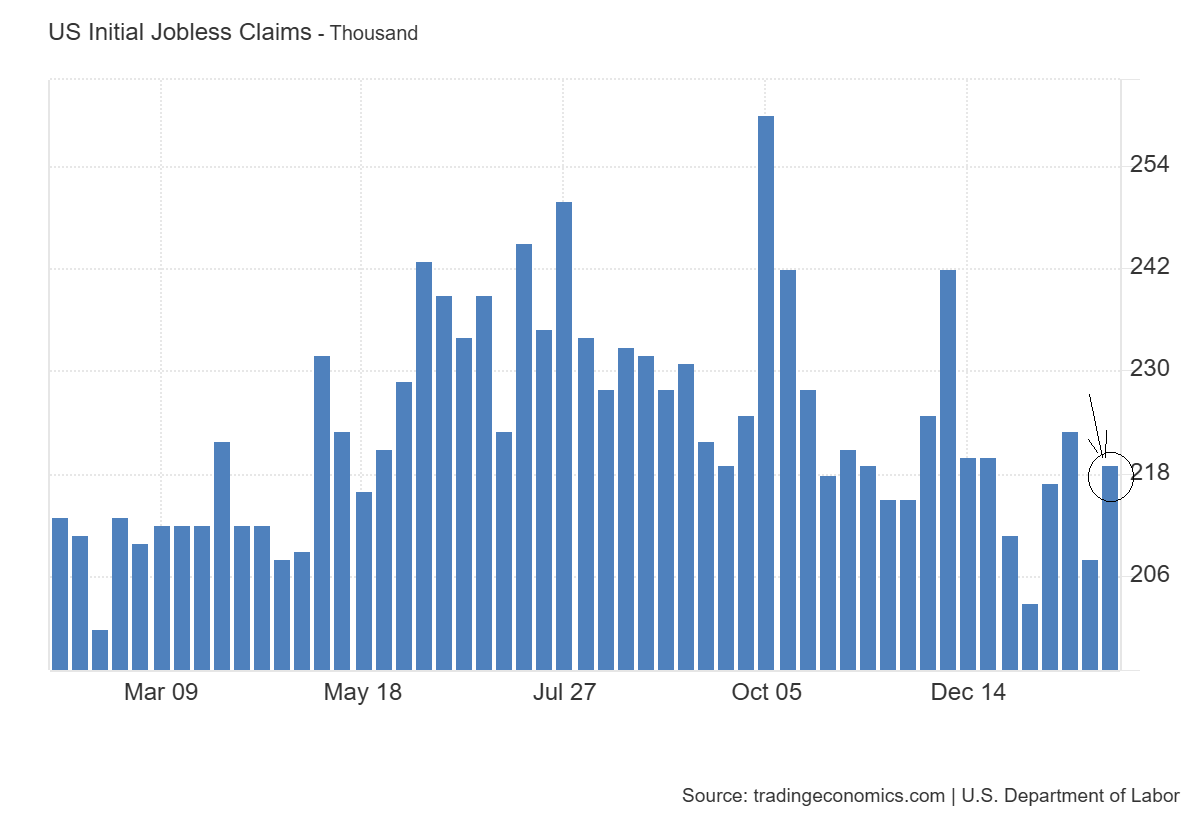
On the other hand, initial jobless claims rose by 11,000 to 219,000 in the last week of January, slightly above the 213,000 forecasts. This increase aligns with expectations of a mild labor market slowdown in 2025. Markets are now waiting for the US nonfarm payroll data, which could shape the next move for the US Dollar, gold, and silver.
Gold (XAU) Technical Analysis
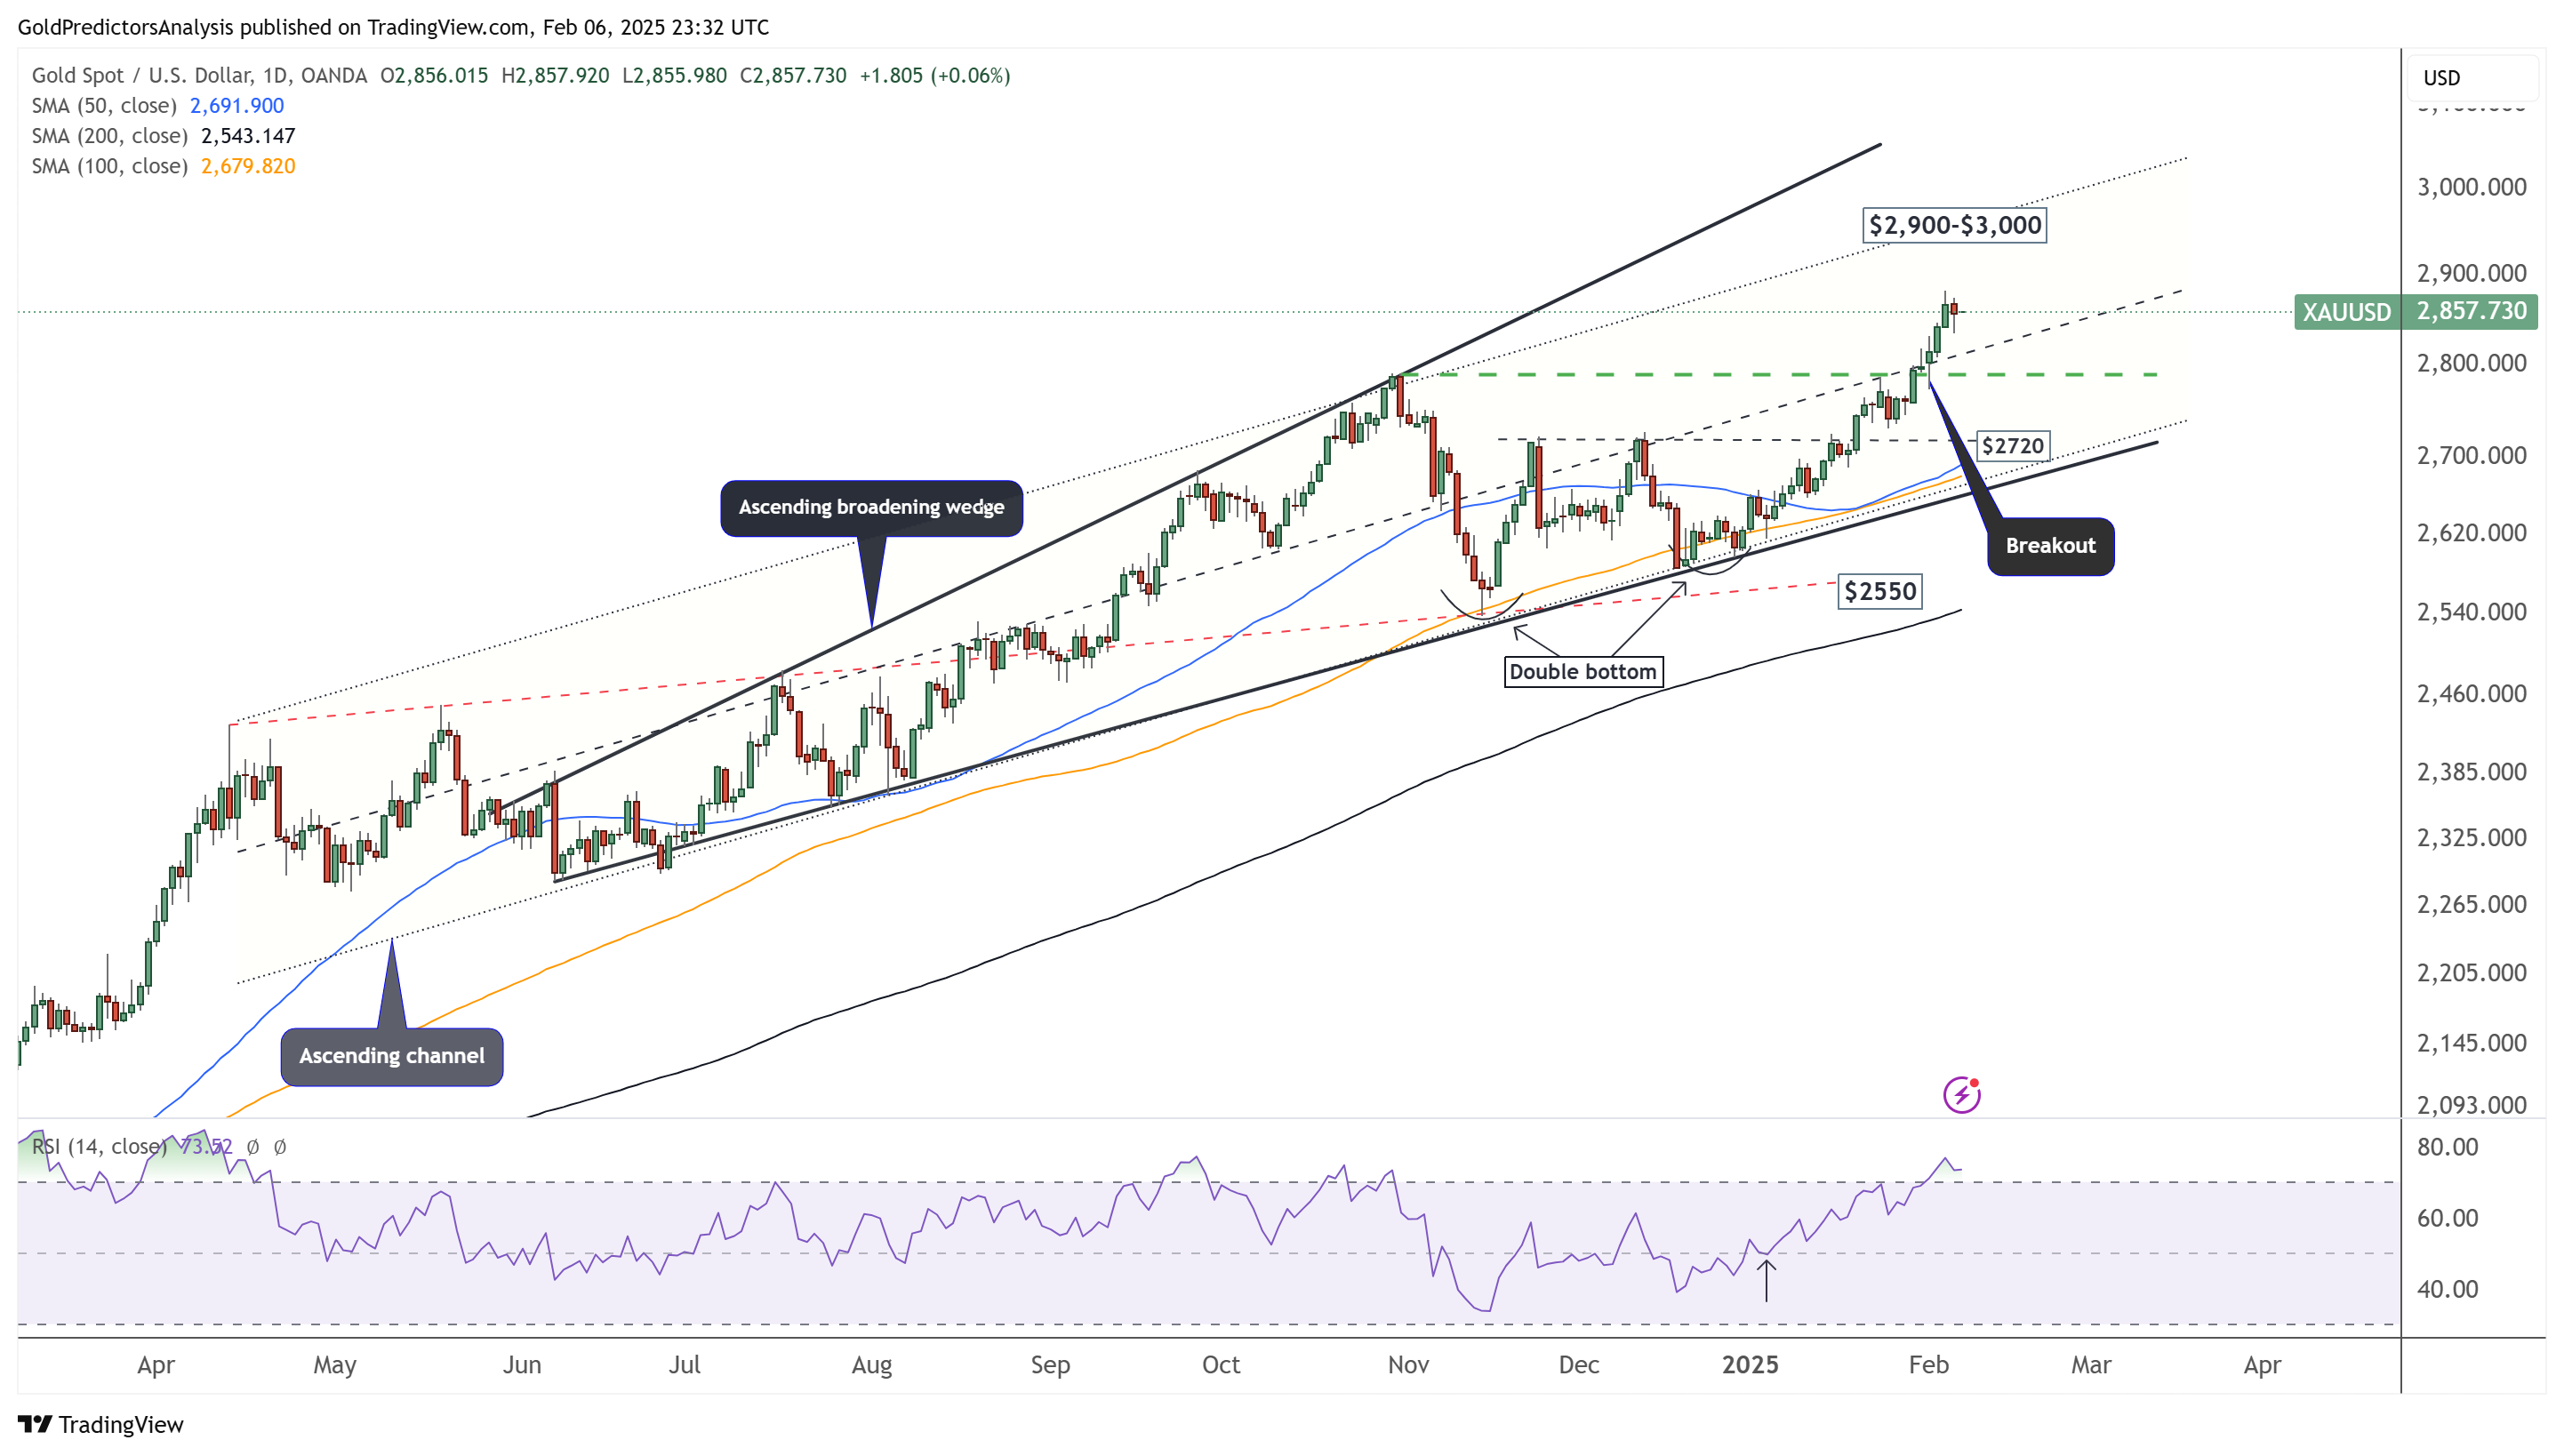
Gold Daily Chart – Bullish Momentum
The daily gold chart shows strong bullish momentum within an ascending channel and a broadening wedge formation. The breakout above $2,795 has paved the way for a potential move toward $3,000. Thursday’s price correction was quickly reversed, leaving a wick on the candle and signaling persistent bullish pressure. The market now awaits Friday’s NFP data to determine the next direction.
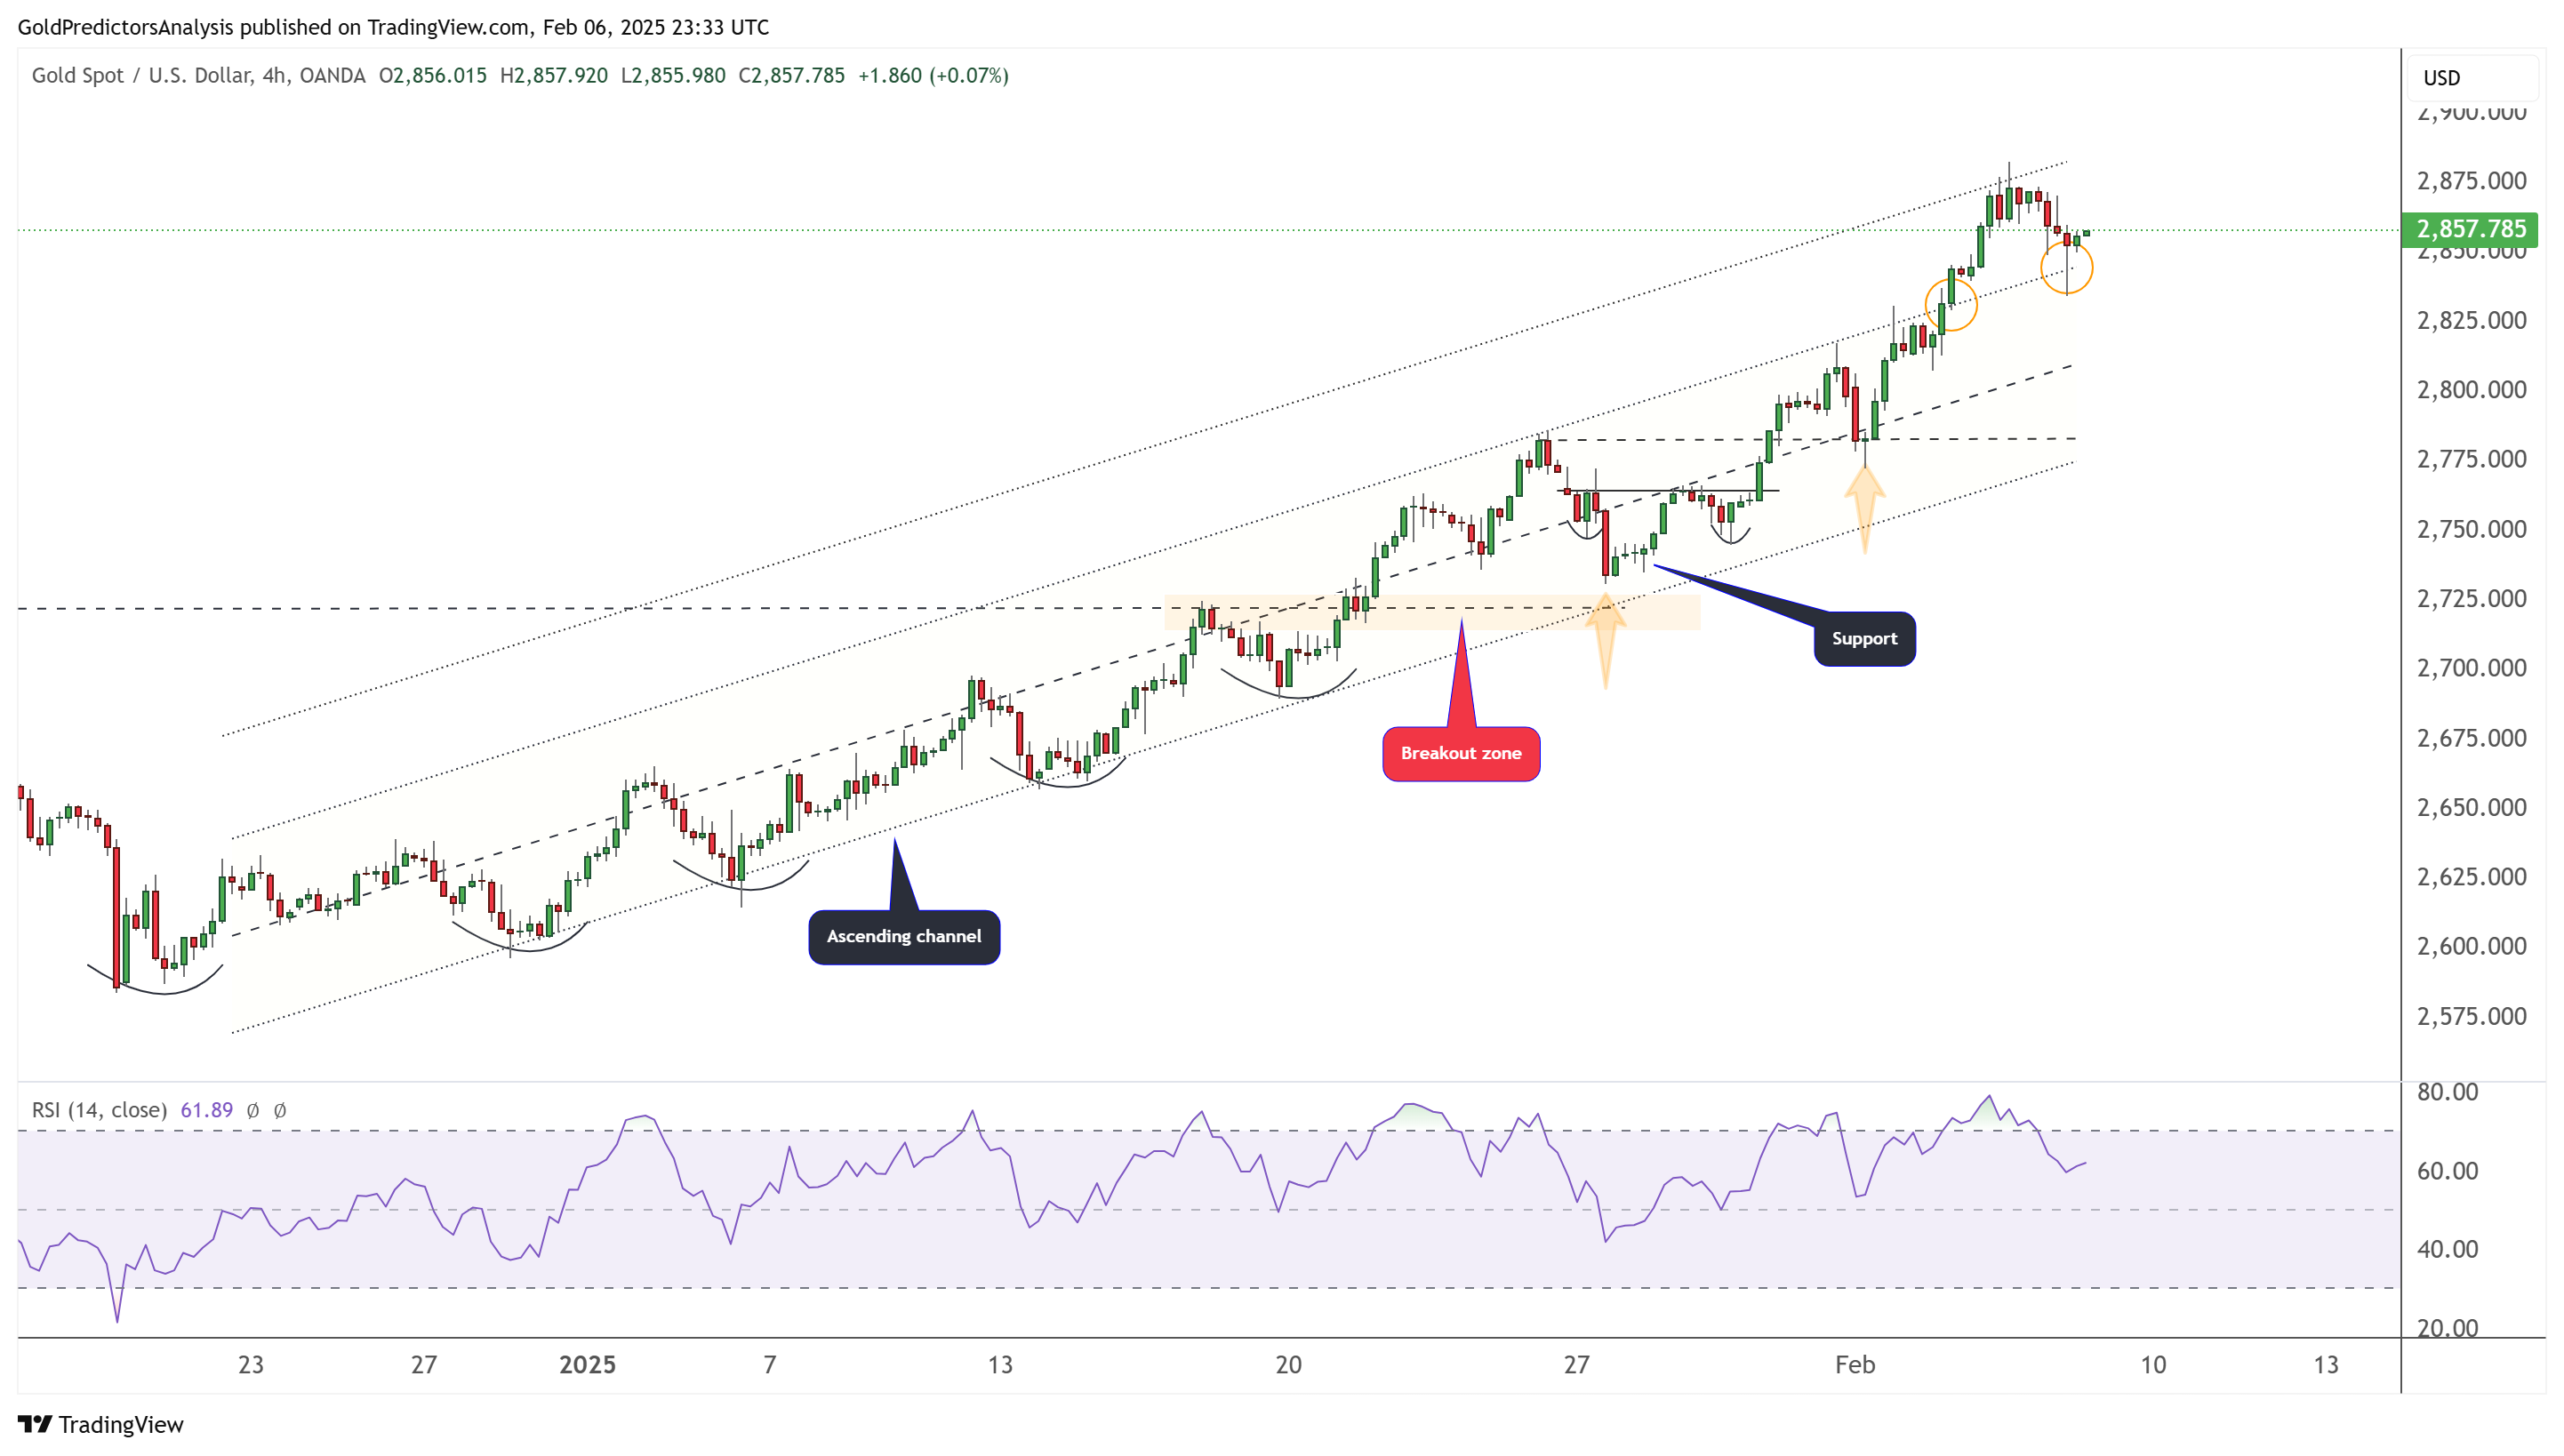
Gold 4-Hour Chart – Ascending Channel
The 4-hour chart shows that gold has extended its rally above $2,820, gradually entering the upper range of the ascending channel. Consequently, this indicates strengthening bullish momentum, potentially leading to a parabolic surge. Moreover, if the price breaks above the ascending channel resistance near $3,000 on the daily chart, it could ultimately trigger a move toward the broadening wedge resistance.
Silver (XAG) Technical Analysis
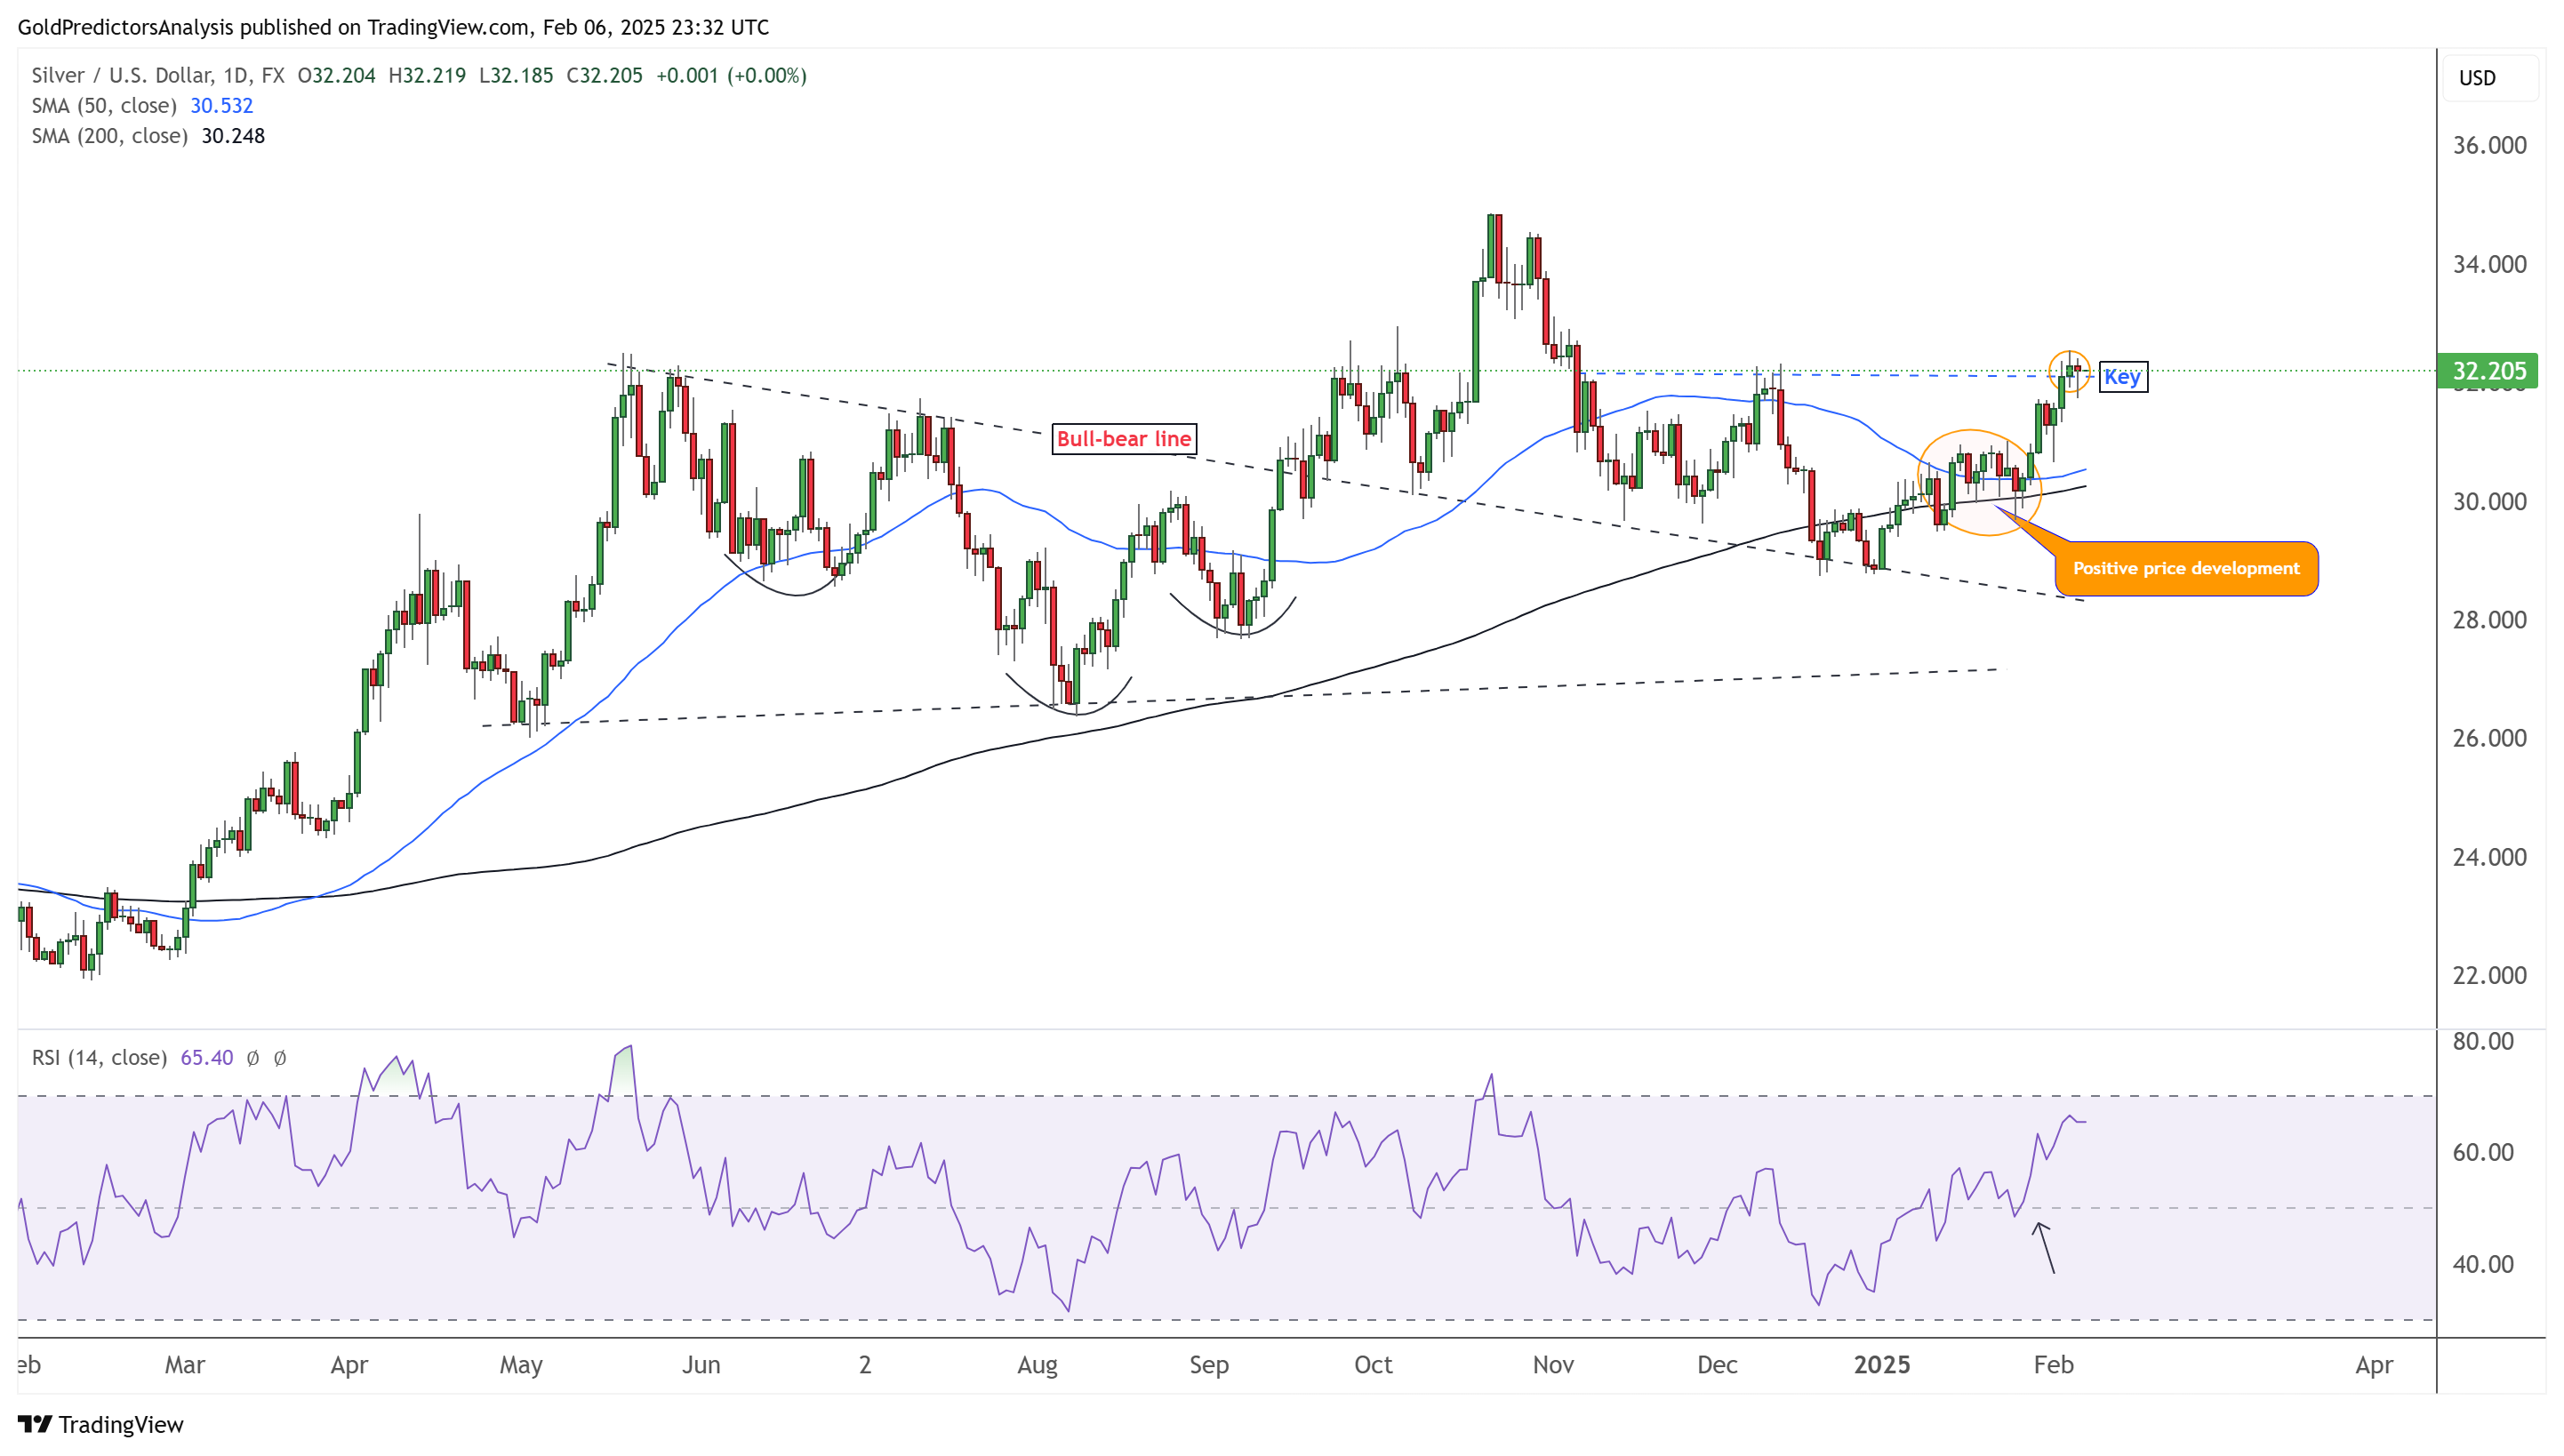
Silver Daily Chart – Positive Price Development
The daily silver chart shows that the price has reached the key $32.50 level and remains strong. Bullish price action suggests silver may follow gold’s rally. However, the current economic outlook does not favor industrial demand, causing silver to lag behind gold. A breakout above $32.50 could trigger a move toward $34.80 and $43.
Silver 4-hour Chart – Key Level
The 4-hour silver chart shows that the price has broken the descending trendline and is gradually gaining positive momentum around the $32.50 level. Furthermore, the consolidation at this level could potentially increase the likelihood of an upside breakout toward $34.80.

US Dollar Index (DXY) Technical Analysis
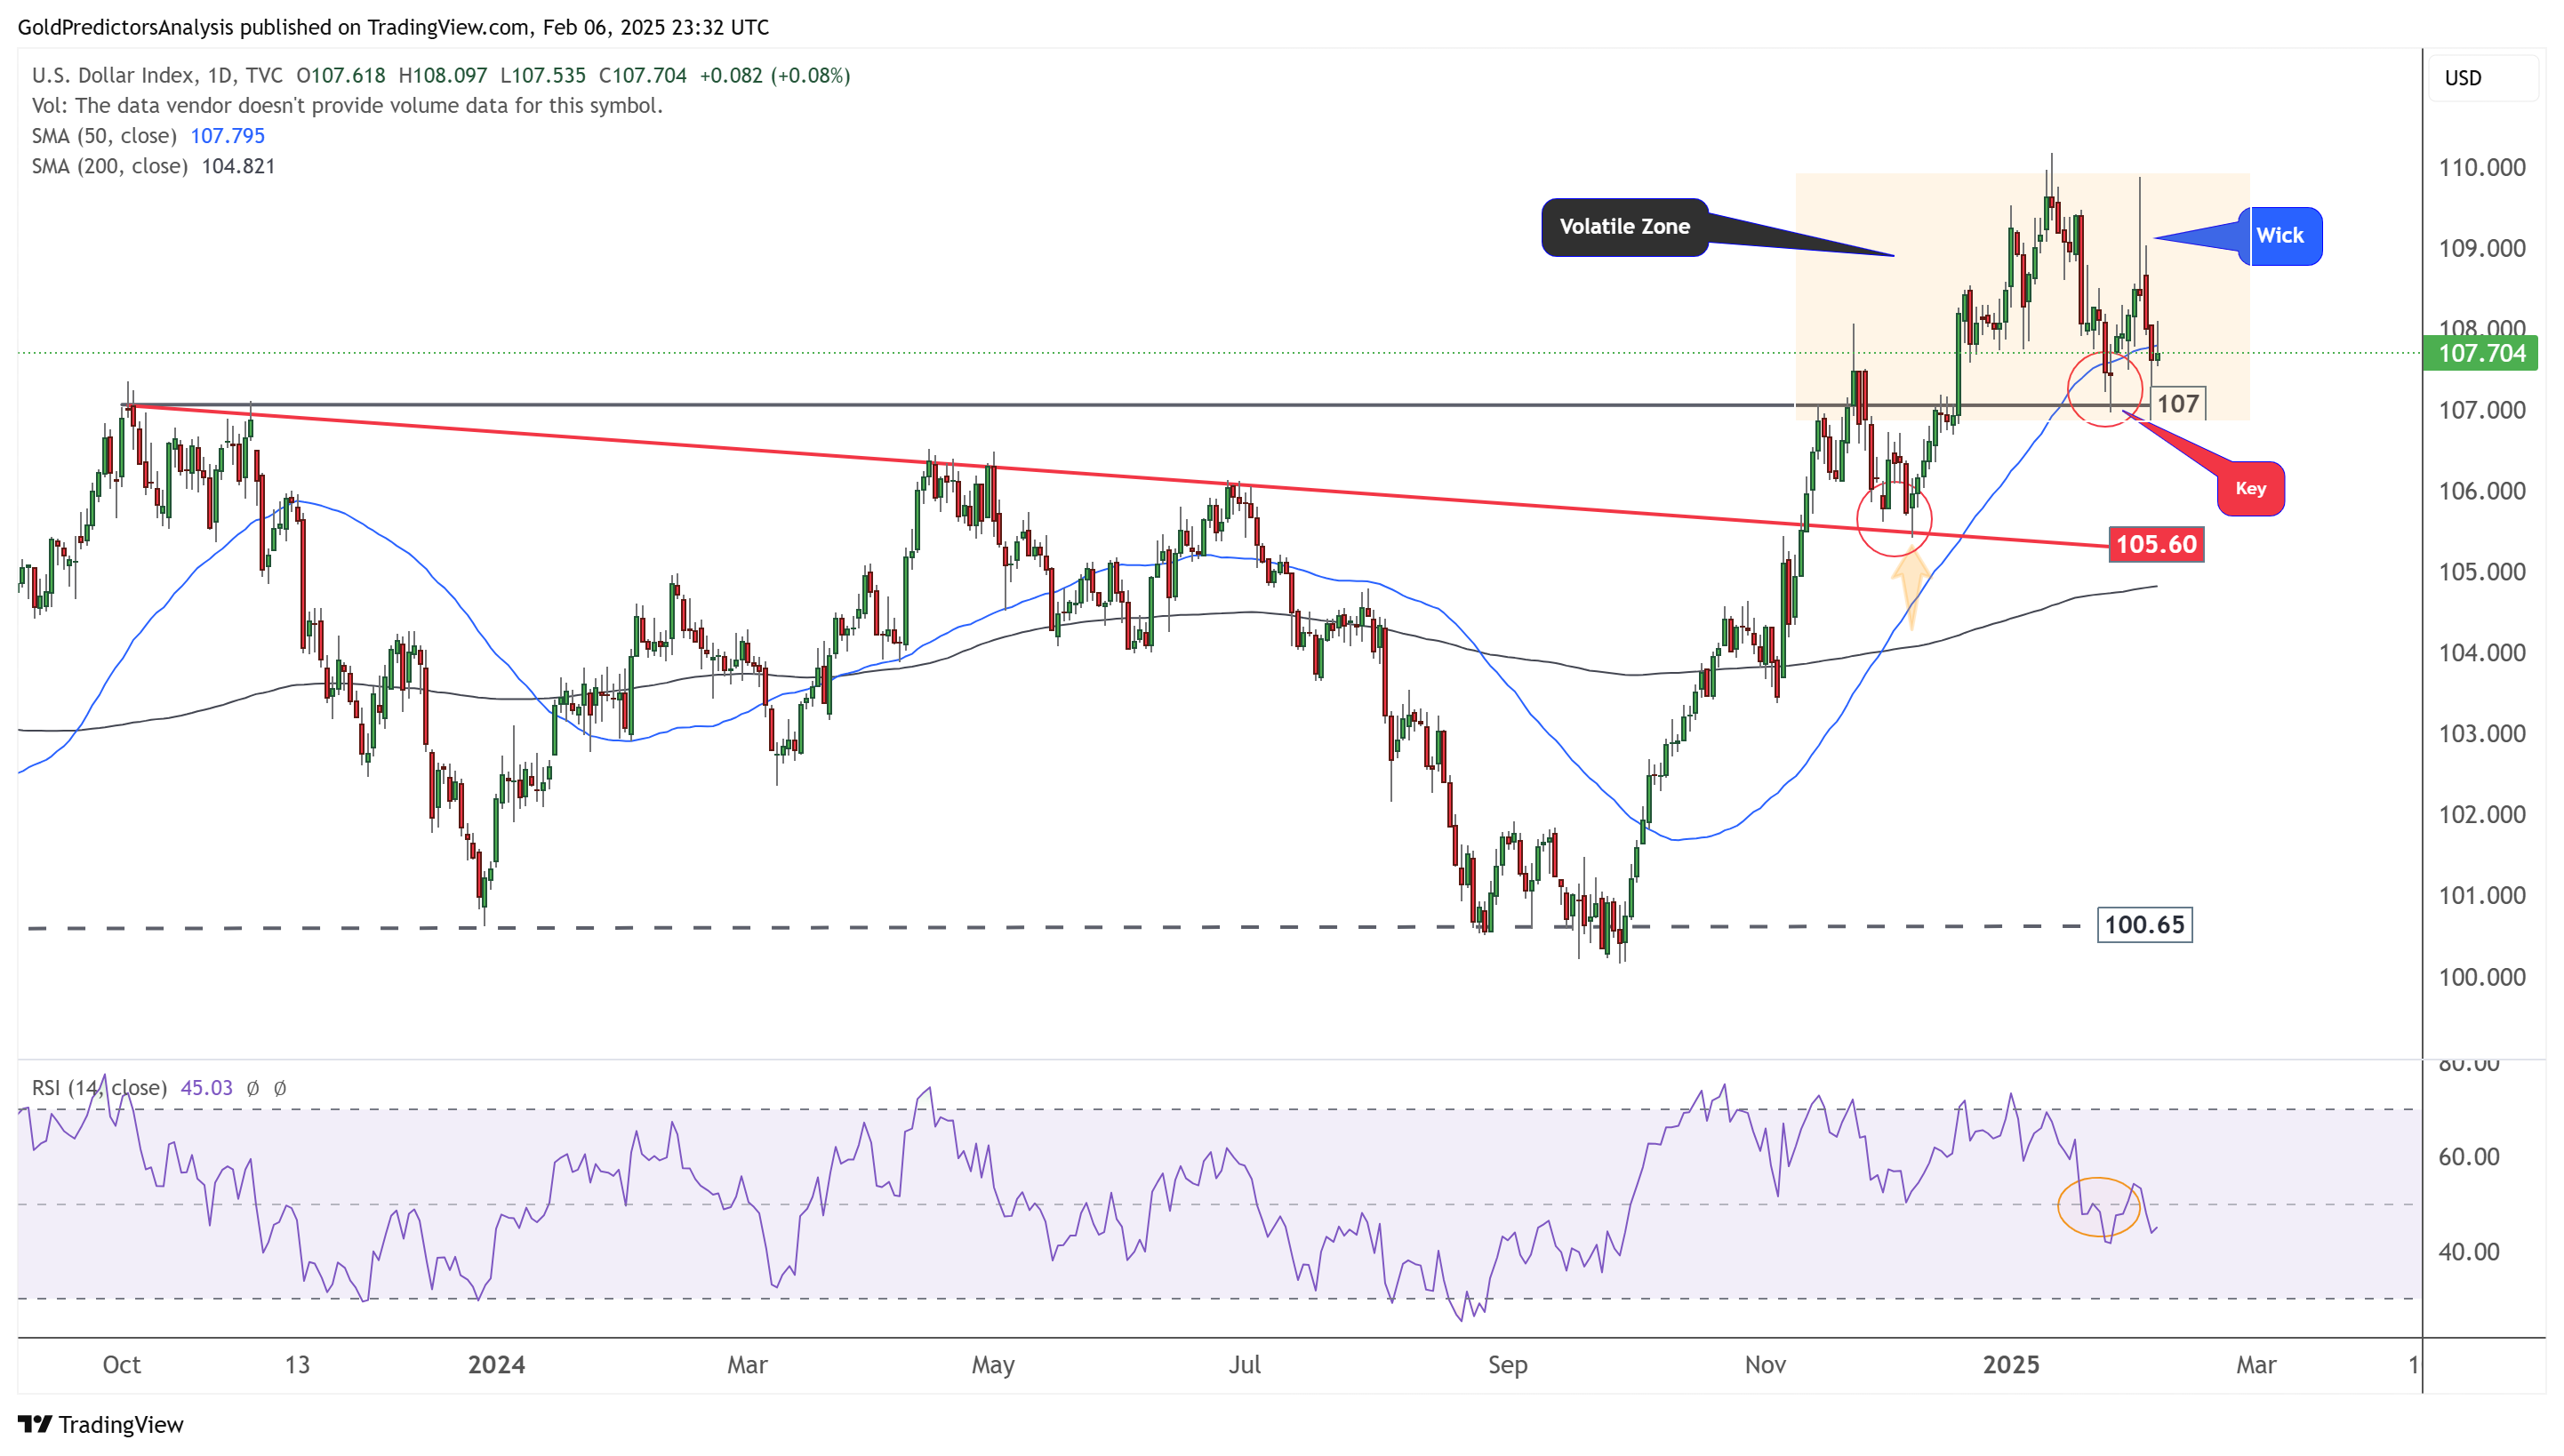
US Dollar Daily Chart – Volatile Zone
The daily chart for the US Dollar Index shows consolidation above the key 107 level with high volatility. The orange zone highlights the most volatile area on the chart. Despite this volatility, the long-term price action remains bullish as the index holds above the 105.60 and 107 levels. Additionally, moving averages confirm the positive trend. However, the short-term direction remains uncertain due to ongoing economic developments. The NFP data release on Friday may provide further directions for the US dollar index.
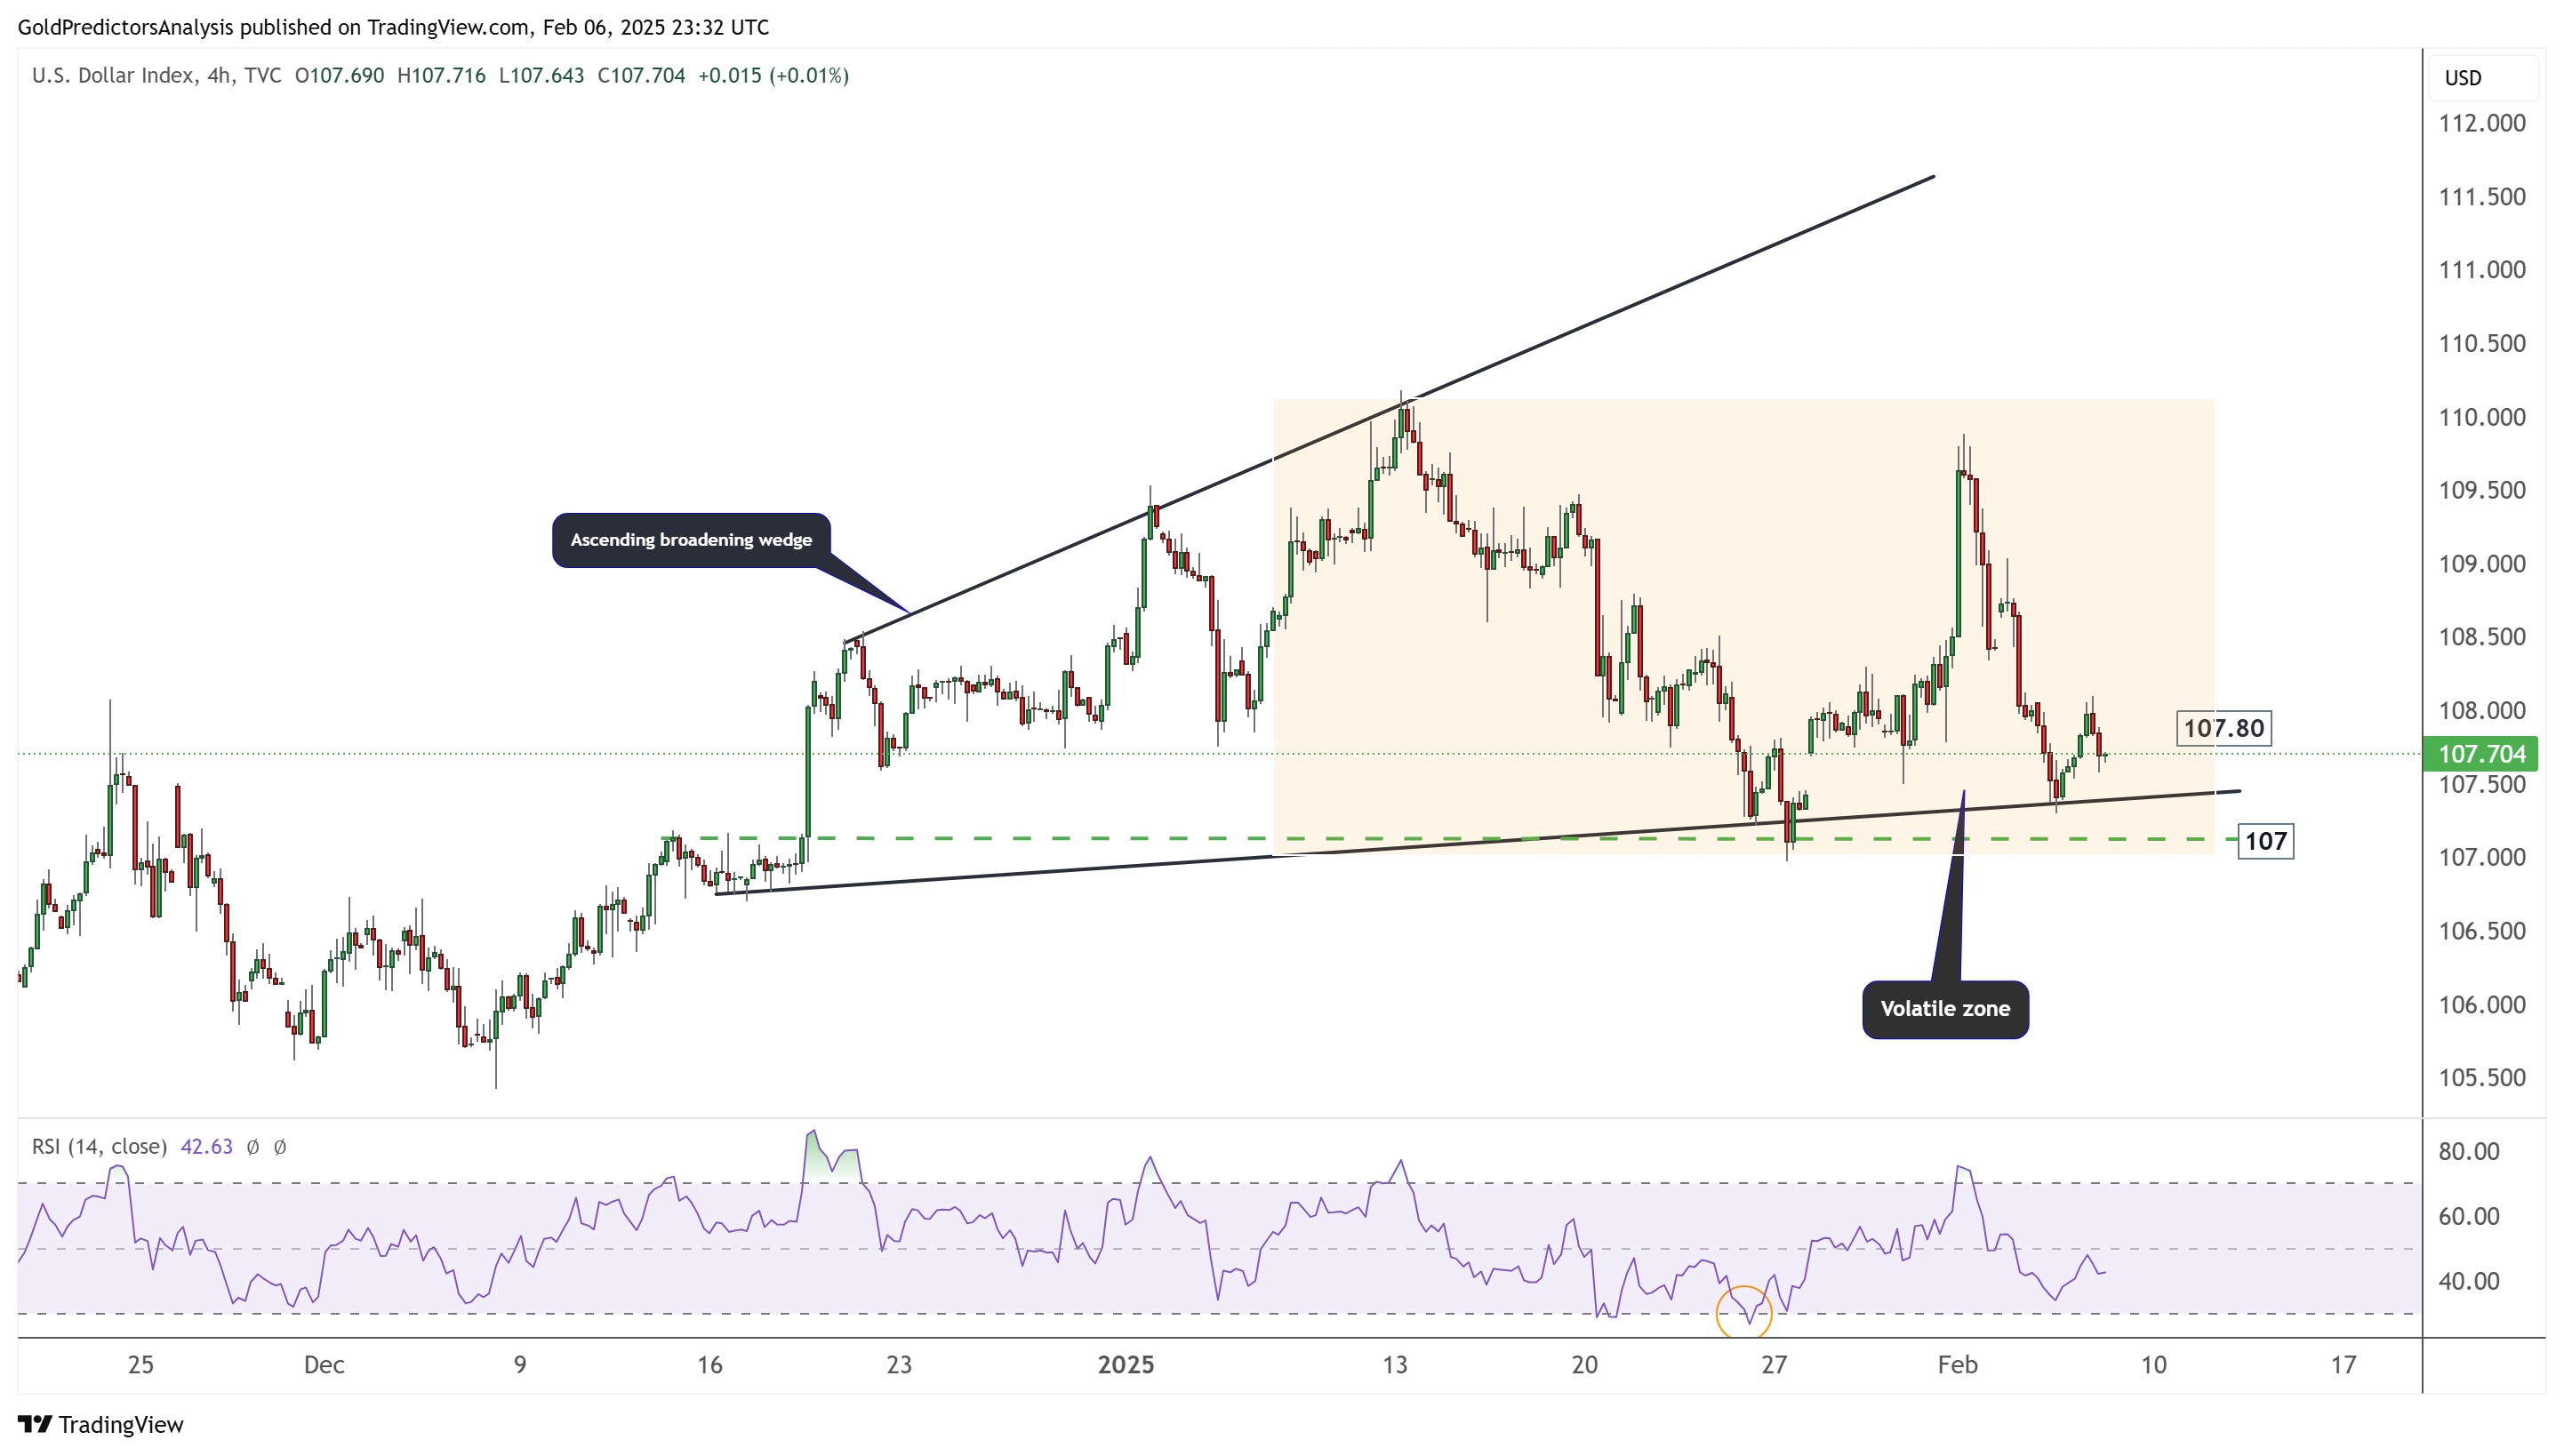
US Dollar 4-Hour Chart – Ascending Broadening Wedge
The 4-hour chart for the US Dollar Index shows the formation of an ascending broadening wedge pattern. Meanwhile, the index consolidates within a volatile zone, showing strong price swings. This consolidation increases the likelihood of a bearish move, as the index has failed to break above 110. If this trend continues, a break below 107 could push the index toward the 105.60 zone.
About the Author
Bob MasonChief Crypto Boss
TEST 30 He has written extensively for a broader audience and his current focus is on developments relating to the financial markets including, but not limited to currencies, commodities, alternative asset classes, and global equities.
Latest news and analysis


Advertisement