
Advertisement
Advertisement
Natural Gas Price Forecast: Advance Trend, Eyes $3.51 Upside Target
By:
Natural gas shows bullish signs after testing $3.39 resistance, with key targets between $3.51 and $3.69, driven by an ABCD pattern formation.
Natural gas began to advance on Thursday with a rally to an eight-day high of $3.43 before an intraday pullback kicked in. Although a minor indication, the $3.39 price level was a peak in January 2024. It was tested again as resistance during the first advance from the recent $2.99 swing low (A) and resistance was seen around the price level.
If natural gas can close above that price today, it will be a slightly more bullish closing than if Thursday’s trading session ends below that level. Nonetheless, today’s range of $3.30 to $3.43 provides near term support and resistance, respectively.
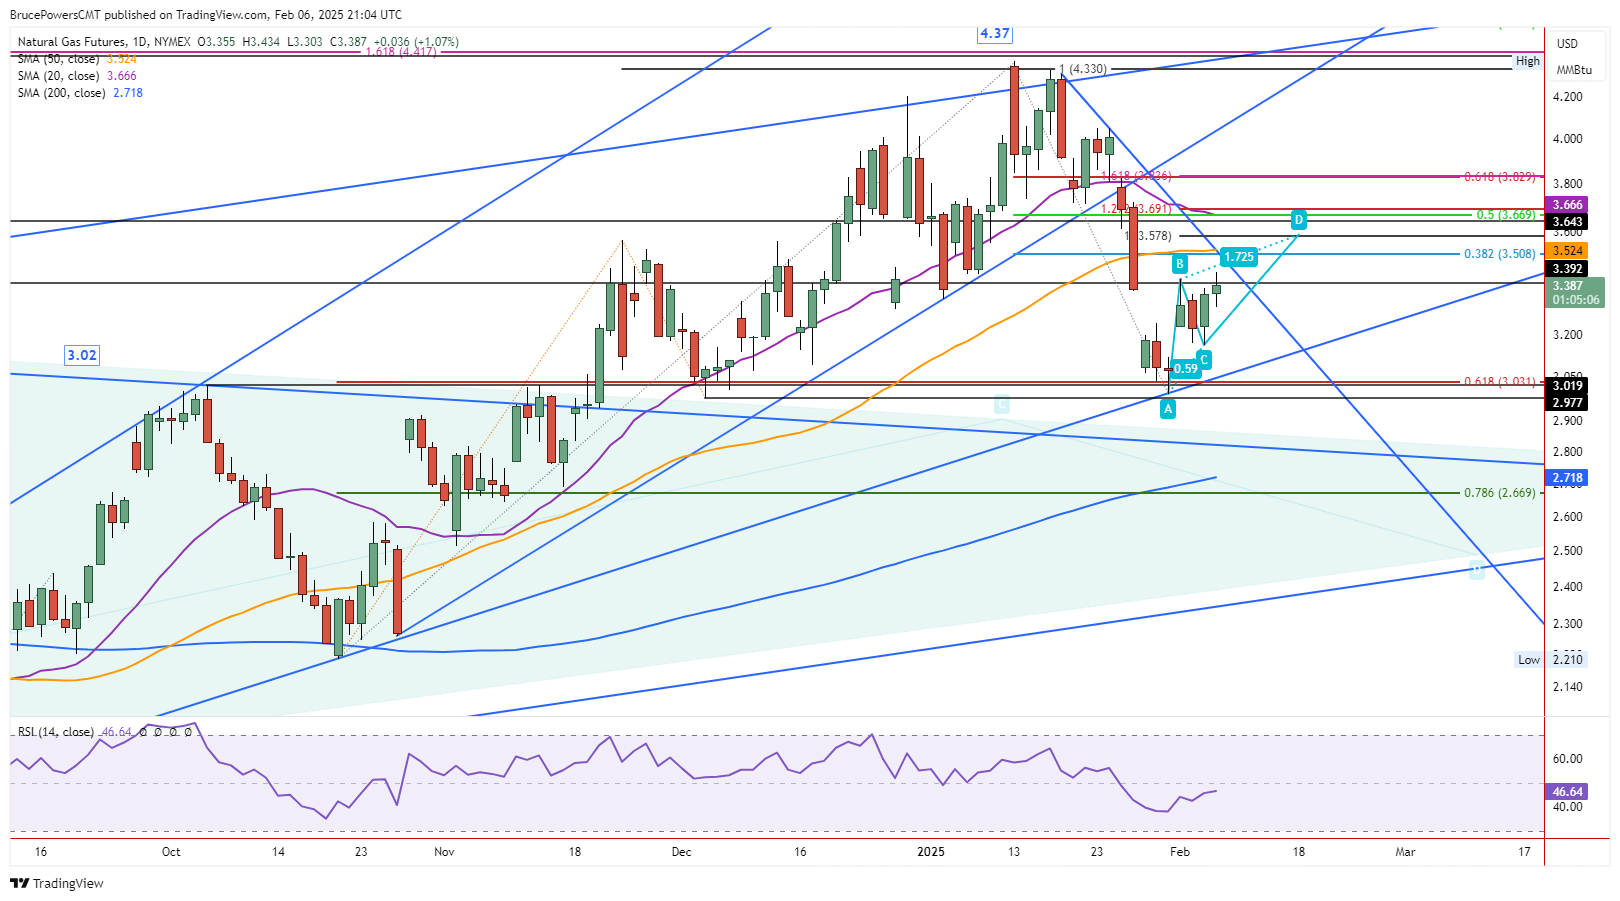
Next Upside Target is $3.51
The first upside target is shown on the chart at $3.51 to $3.52. It starts with the 38.2% Fibonacci retracement and is followed by the 50-Day MA. Note that the price represented by the 50-Day line may change slightly before it is reached. Also, be aware of the internal downtrend line near to today’s price action.
Although it may not provide a clear price to gauge from, it can help as a guide. The next more significant potential resistance zone above the 50-Day line is around the 20-Day MA, currently at $3.67. Notice that the 20-Day line has been falling recently and has entered the price range discussed previously from the $3.64 peak in 2023, and the 50% retracement at $3.67.
Rising ABCD Pattern Points to $3.58
An interim upside target has been added to the chart since as of today there is a higher swing high for the developing ABCD pattern (light blue) starting from the recent $2.99 low (A). The initial target from the patten is $3.58, approximately halfway between the 50-Day and 20-Day MAs. Further up is the 127.2% extended target from the pattern at $3.69. Therefore, that higher price target can be added to the price range around the 20-Day MA.
Wide Range Week Consolidation
Since this week’s price action is contained with a wide range from last week, it would not be surprising to see natural gas continue to slowly advance and fill more of that range. Last week’s range goes from a low of $2.99 to a high of $3.83. Last week’s high marks the next higher potential target area above the $3.69 price level.
For a look at all of today’s economic events, check out our economic calendar.
About the Author
Bruce Powerscontributor
Bruce has been involved in the financial markets for over 20 years, as an analyst, trader, educator, and writer.
Latest news and analysis


Advertisement