
Advertisement
Advertisement
Gold (XAUUSD) Breaks $3,400 as Iran-Israel Conflict and Weak US Dollar Boost Safe-Haven Demand
By:
Key Points:
- Gold (XAUUSD) breaks above $3,400 and appears poised to move higher amid escalating geopolitical tensions.
- US Treasury yields (TNX) consolidate above the 50- and 200-day SMAs.
- US Dollar Index (DXY) remains under bearish pressure and is likely to continue moving lower.

Gold (XAUUSD) prices rallied over the last week as the Israel-Iran conflict intensified, triggering a risk-off sentiment in global markets. Investors rushed to safe-haven assets, pushing XAUUSD above $3,430 before settling slightly lower at $3,422. The conflict has increased fears of broader regional instability, which benefits gold due to its status as a hedge against geopolitical risk.
On the other hand, softer US inflation data supported the rally. The latest CPI and PPI reports showed easing price pressures, strengthening expectations of a Federal Reserve rate cut. Although consumer sentiment has improved, concerns about inflation persist. The combination of geopolitical risk and a weaker dollar continues to provide bullish momentum for gold.
However, rising US Treasury yields limited further upside. The 10-year yield consolidates after rising above 4.40%, which caps the momentum of gold. The market is now focused on the Fed’s policy meeting and key economic data, including retail sales and job numbers. These releases could challenge the current bullish trend in the gold market.
Gold Technical Analysis
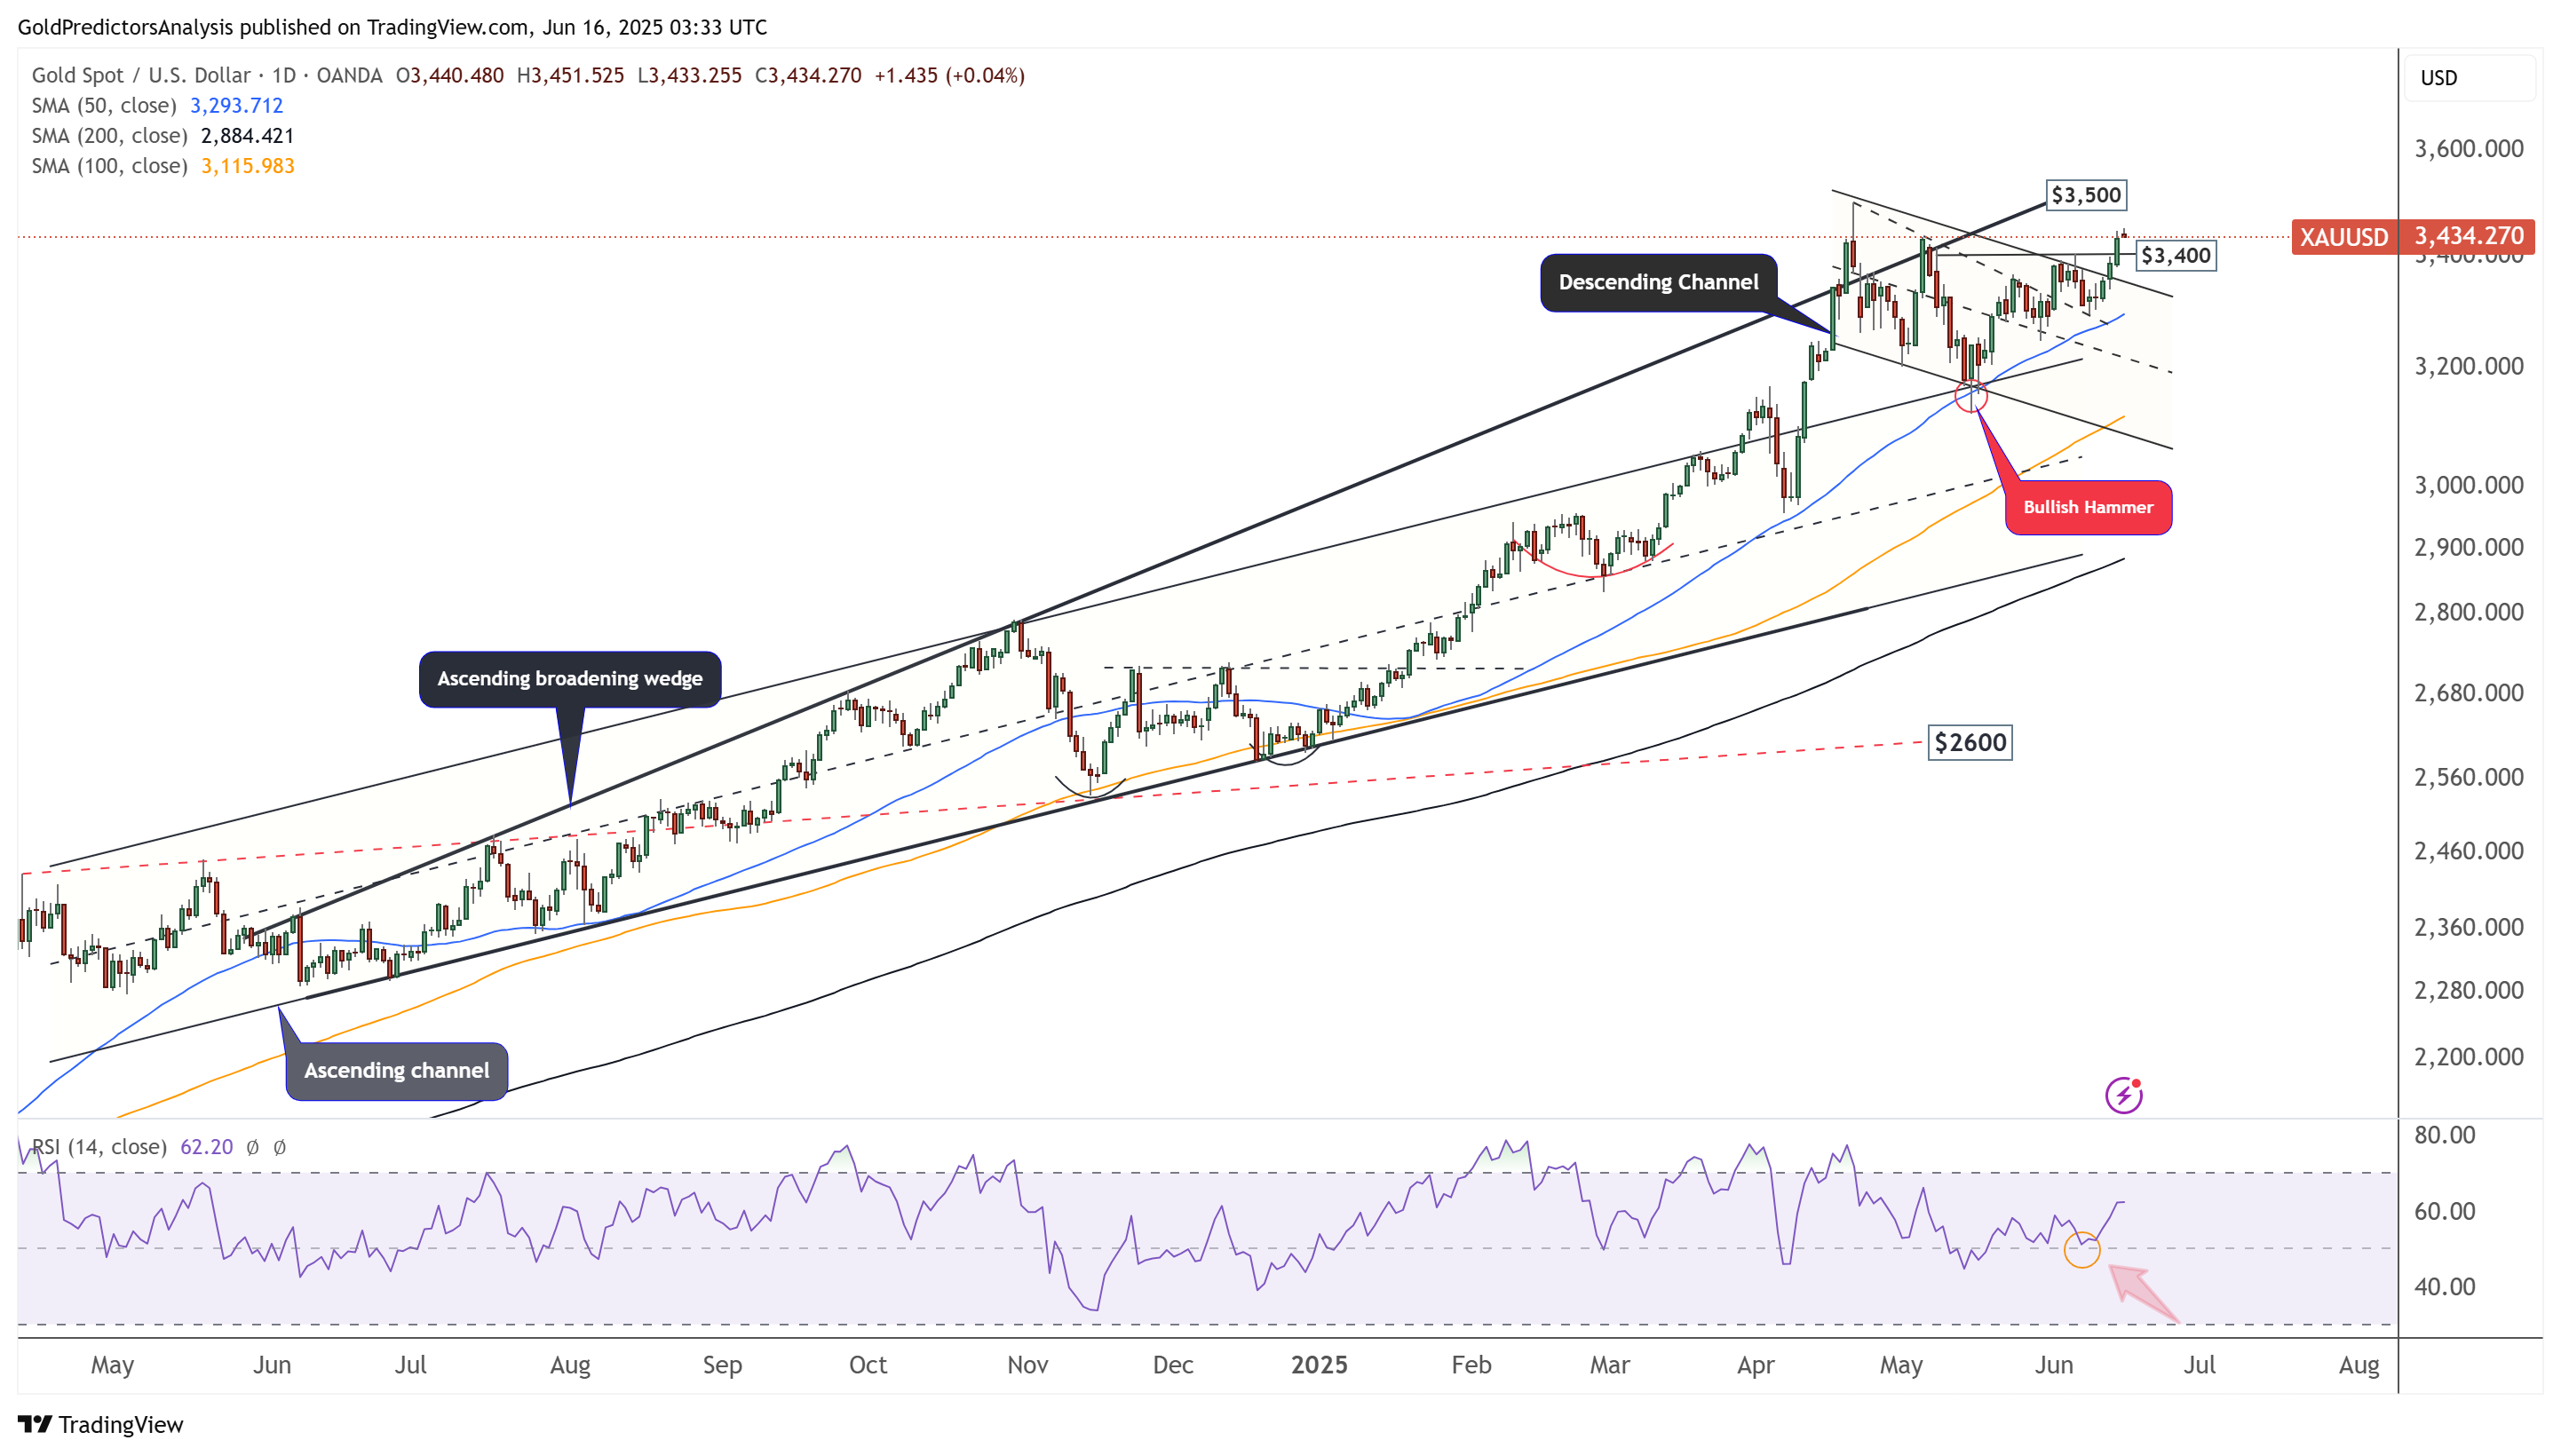
XAUUSD Daily Chart – Breaks $3,400
The daily chart for spot gold shows that the price has broken above $3,400 amid the ongoing conflict between Iran and Israel. This breakout has opened the door for a move toward the $3,500 region. However, a break above $3,500 will likely trigger a strong surge in gold prices. The RSI is rebounding from the mid-level, indicating potential for further upside in the gold market.
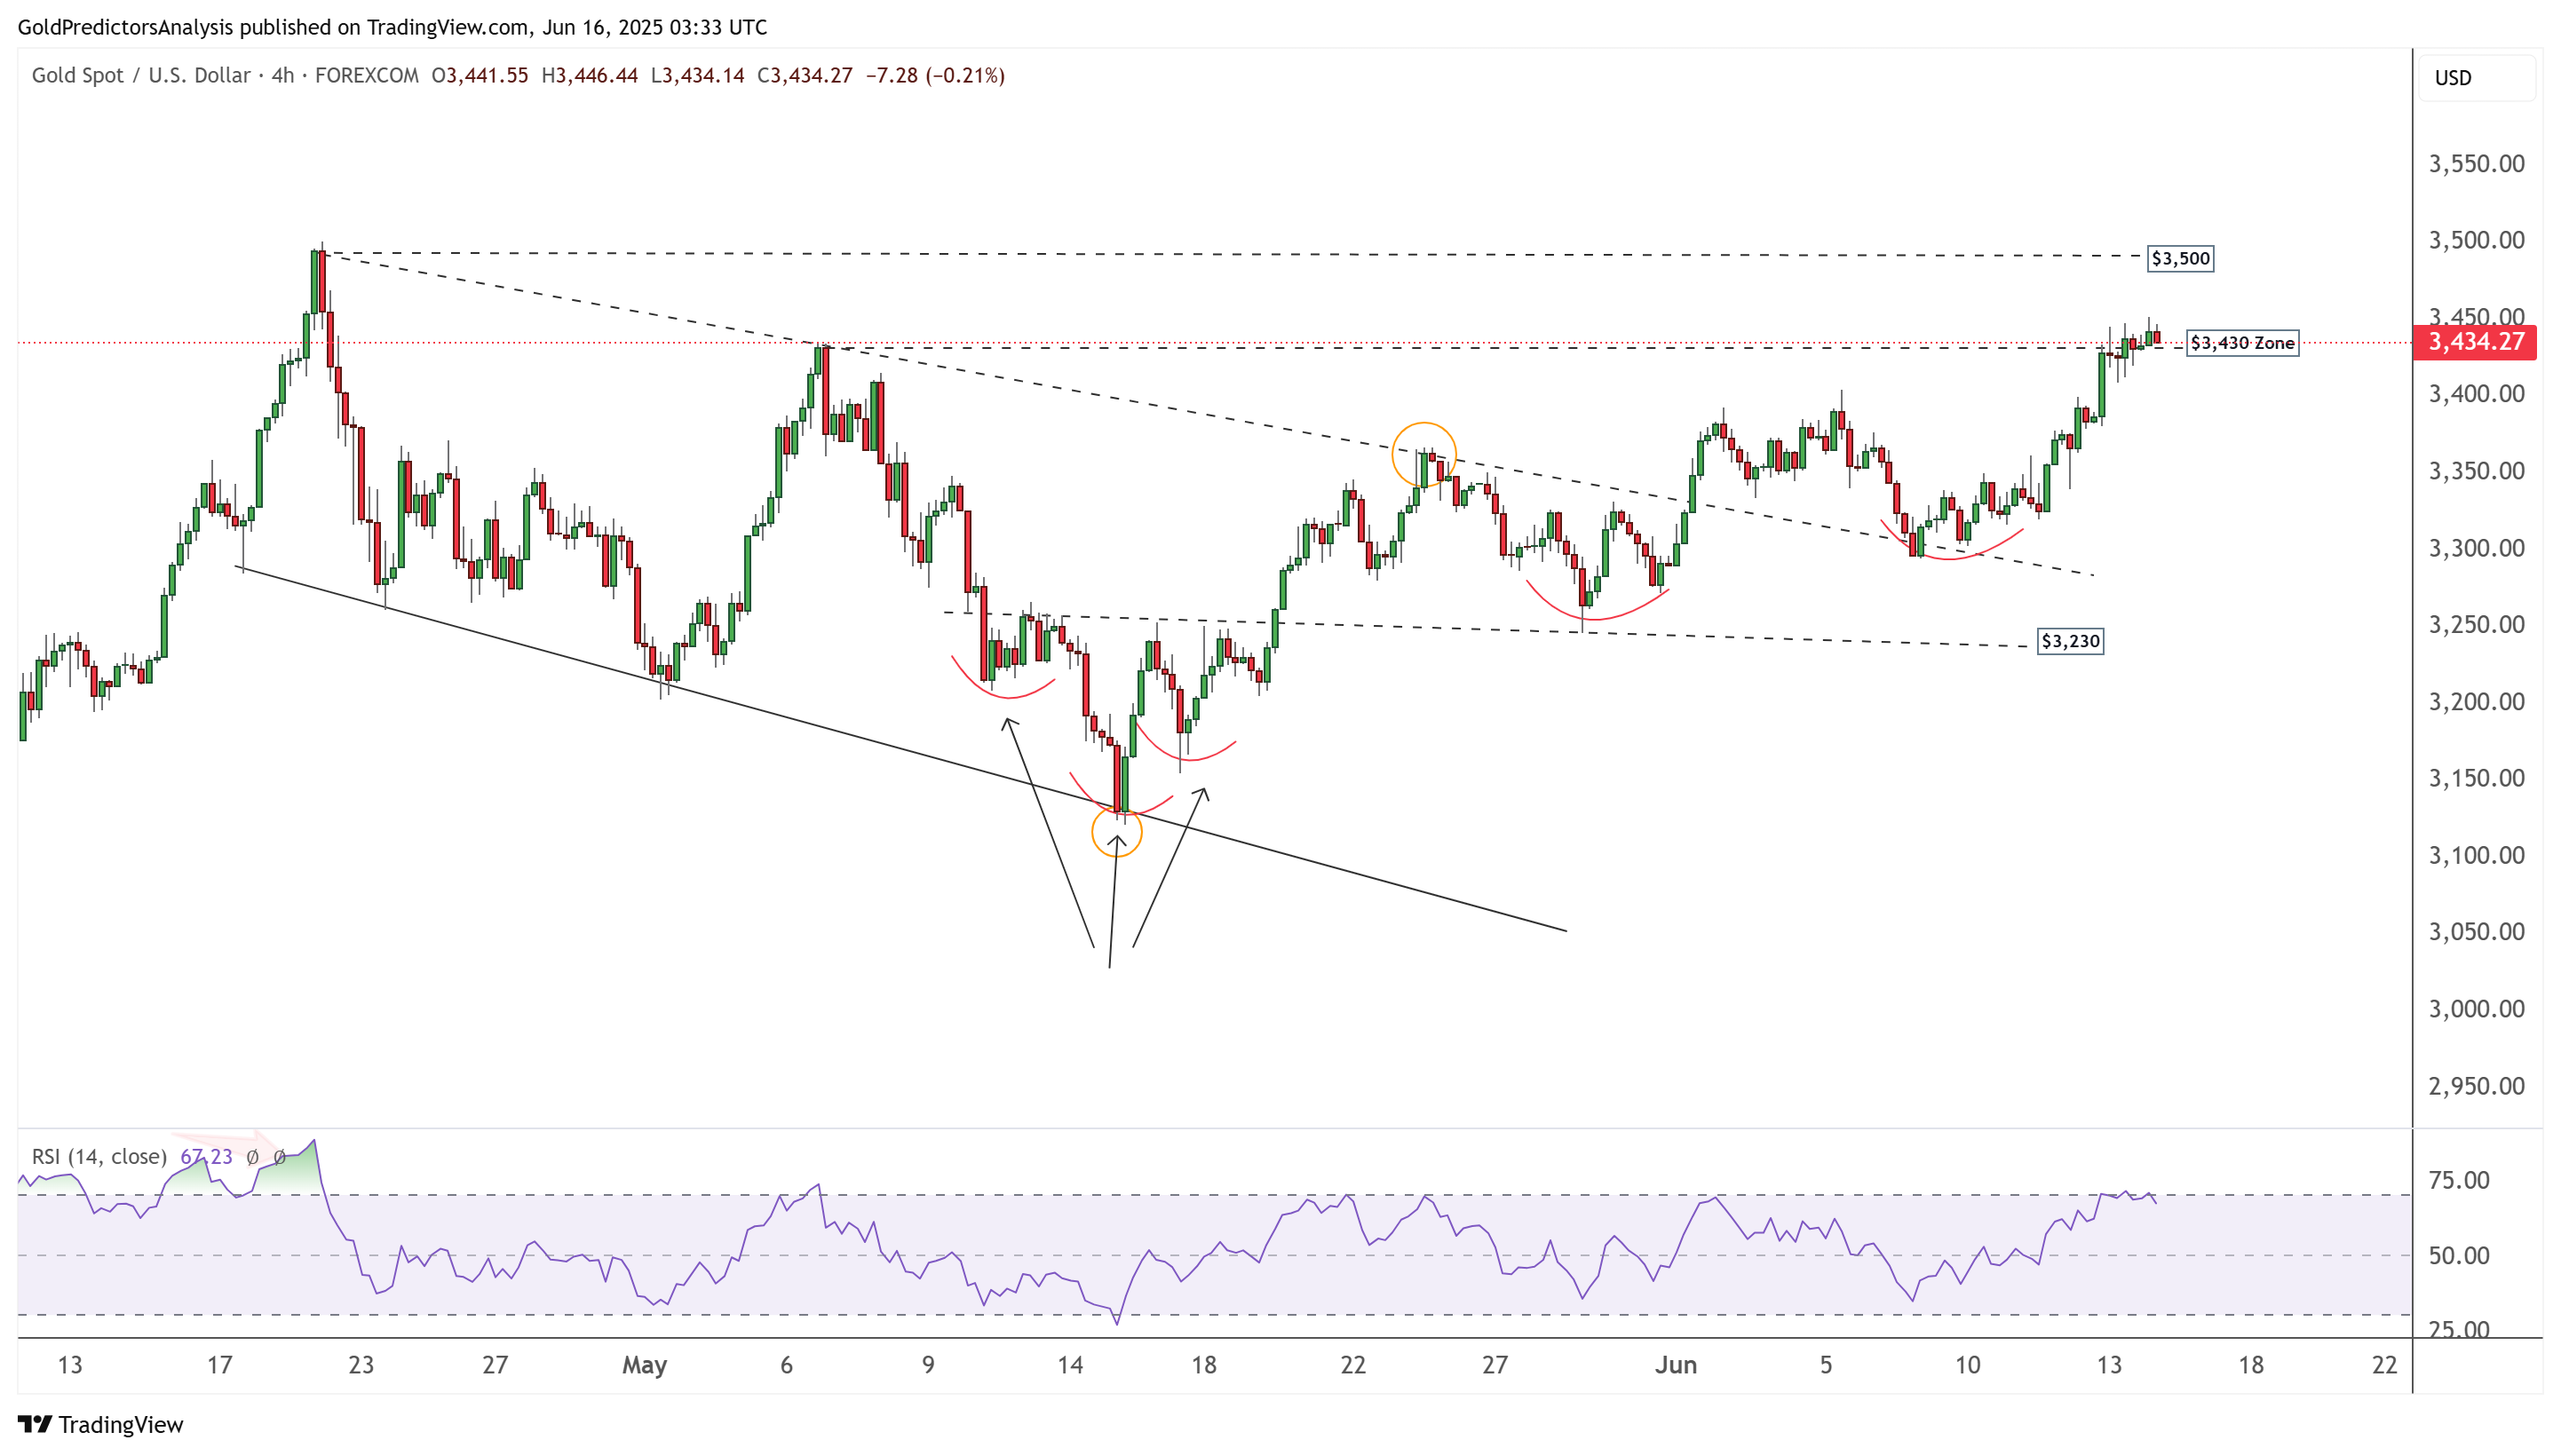
XAUUSD 4-Hour Chart – Bullish Price Structure
The 4-hour chart for spot gold shows that the rebound from the $3,120 area is very constructive. The price has formed an inverted head-and-shoulders pattern at this support level. This rebound confirms bullish intent. Last week, the market closed around the $3,430 area, signalling strong momentum.
The immediate resistance lies at $3,500, and a breakout above this level could trigger another surge in gold prices. However, the RSI indicates that the market is overbought in the short term. A price correction is likely and could establish the next bottom for a fresh bullish run.
Treasury Yields (TNX) Technical Analysis
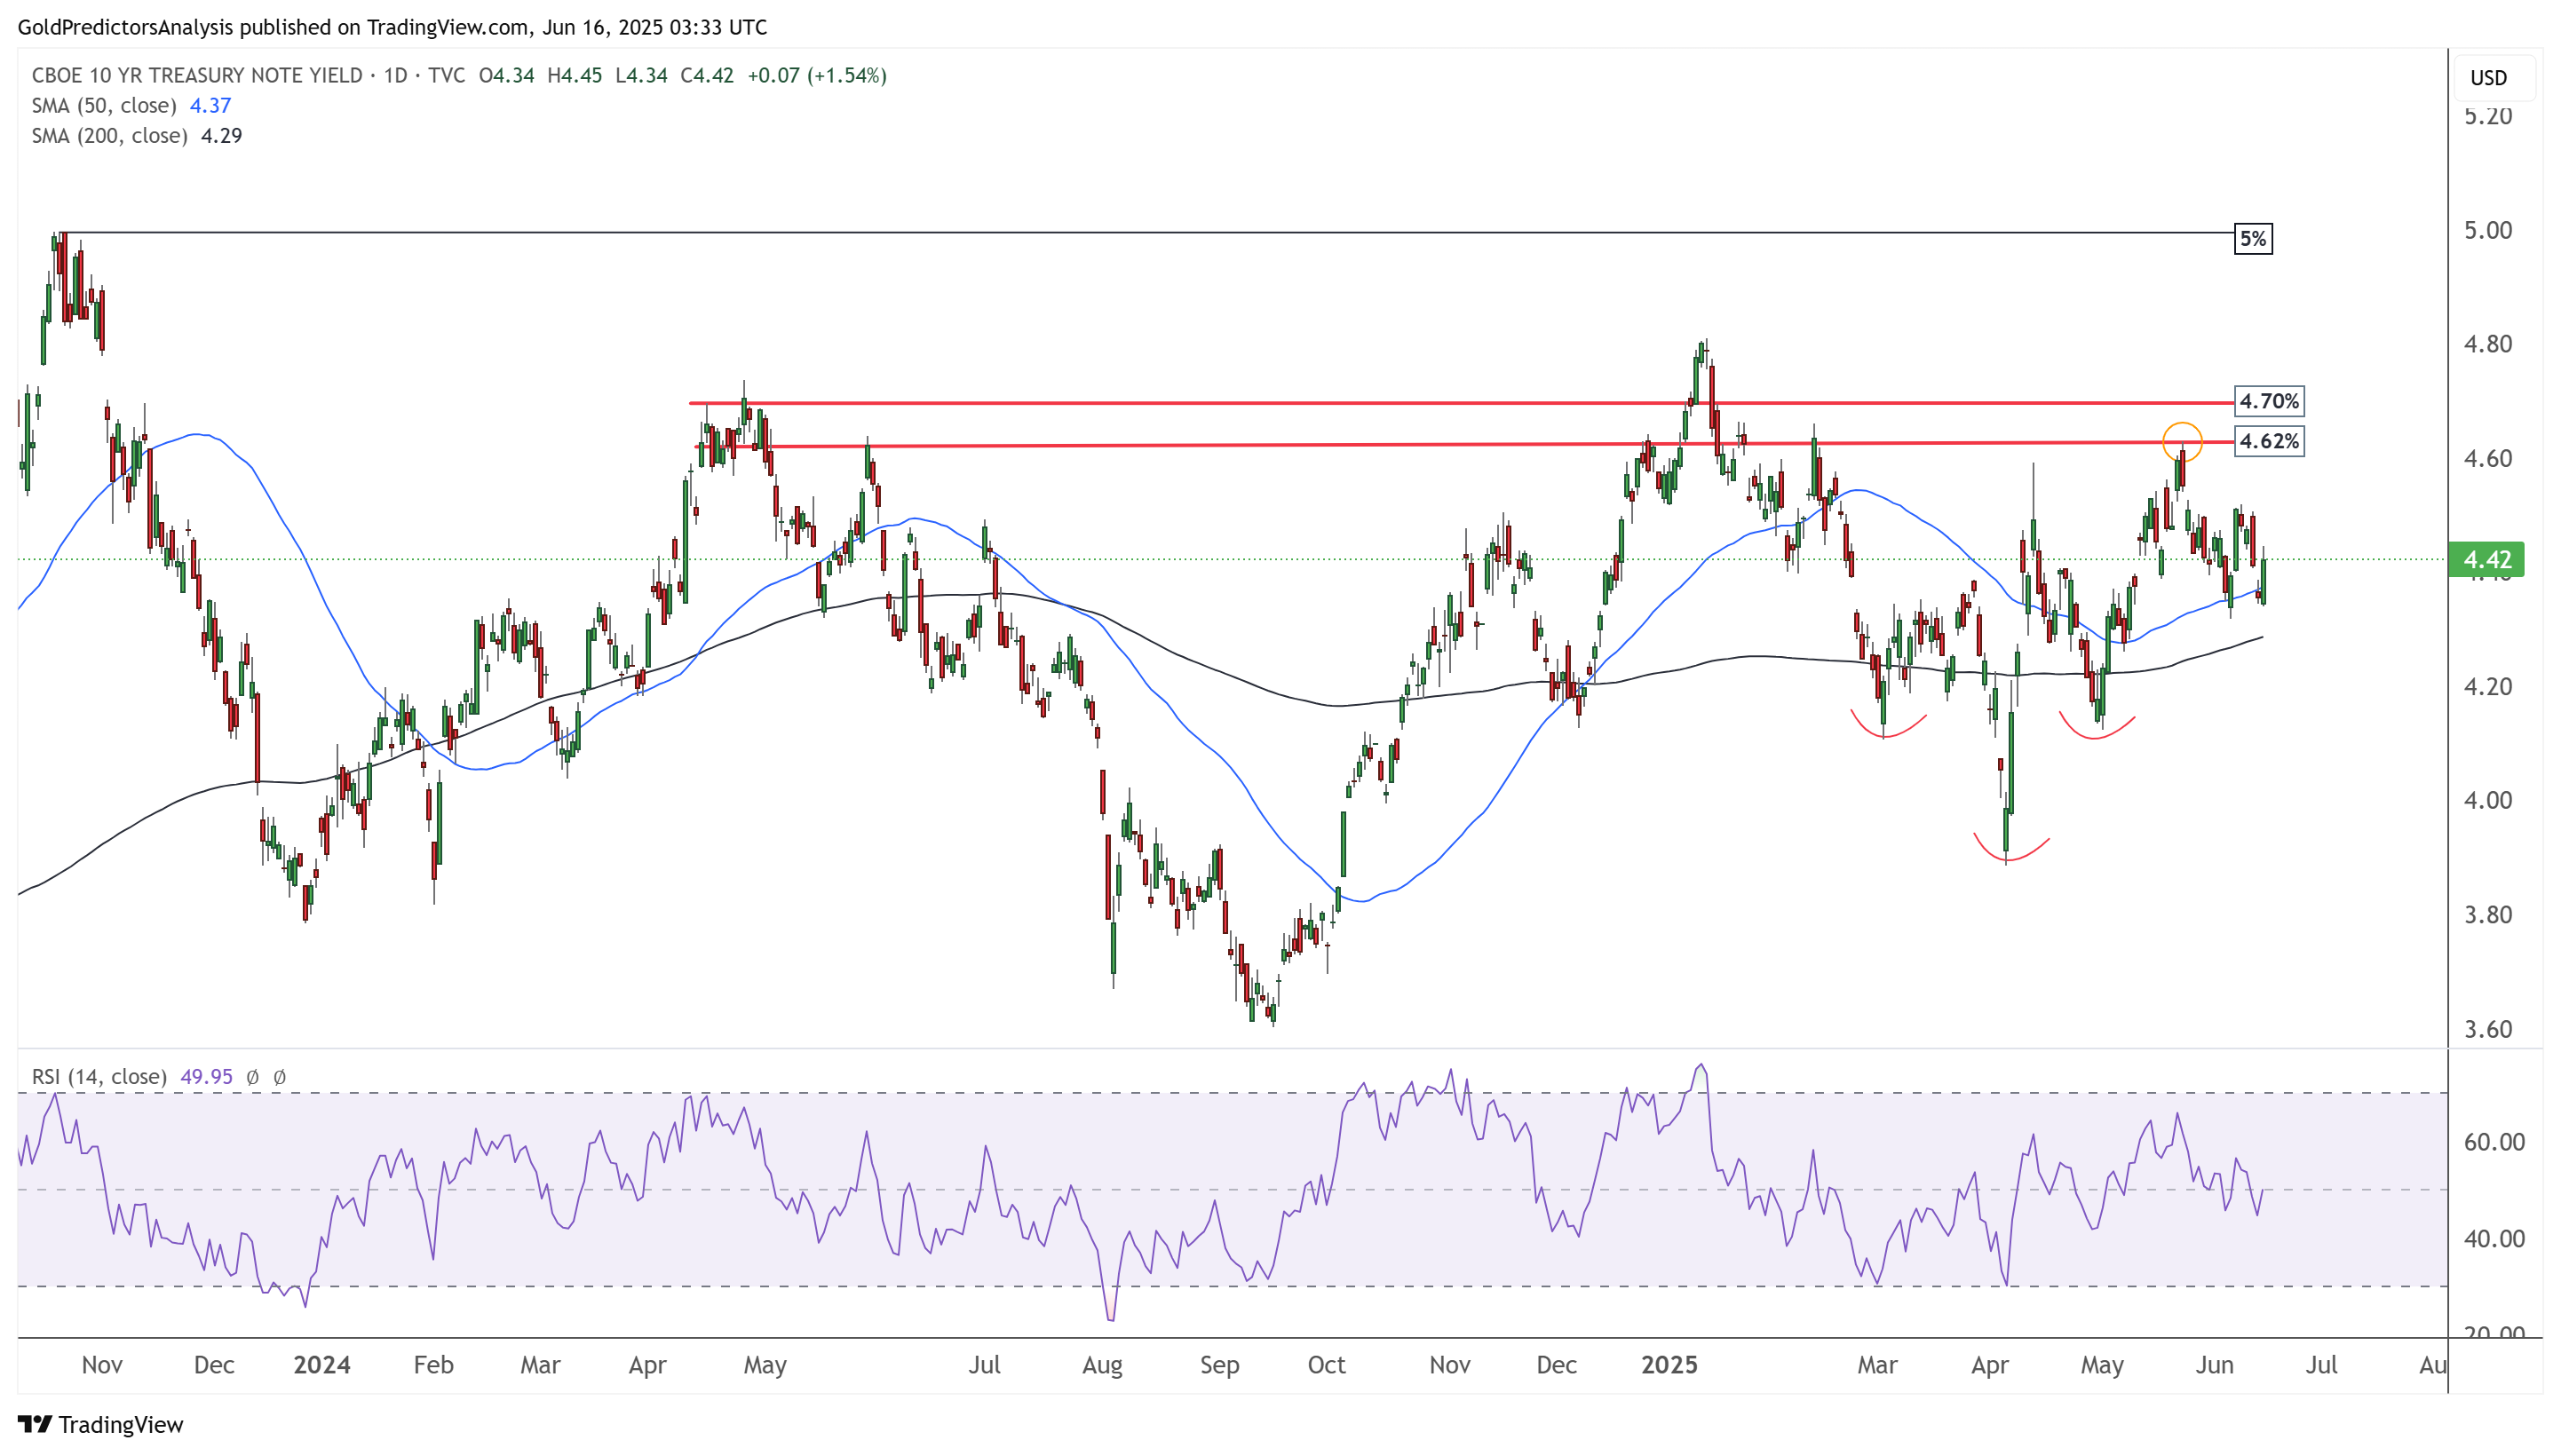
10-Year Treasury Note Yield Daily Chart – Consolidation
The daily chart for the US Treasury note yield indicates that the price is consolidating above the 50-day and 200-day SMAs. This consolidation above the 4.0% area indicates bullish price action. As long as yields remain above the 200-day SMA, the outlook remains positive. A breakout above 4.70% is likely to trigger a move toward the 5.0% area.
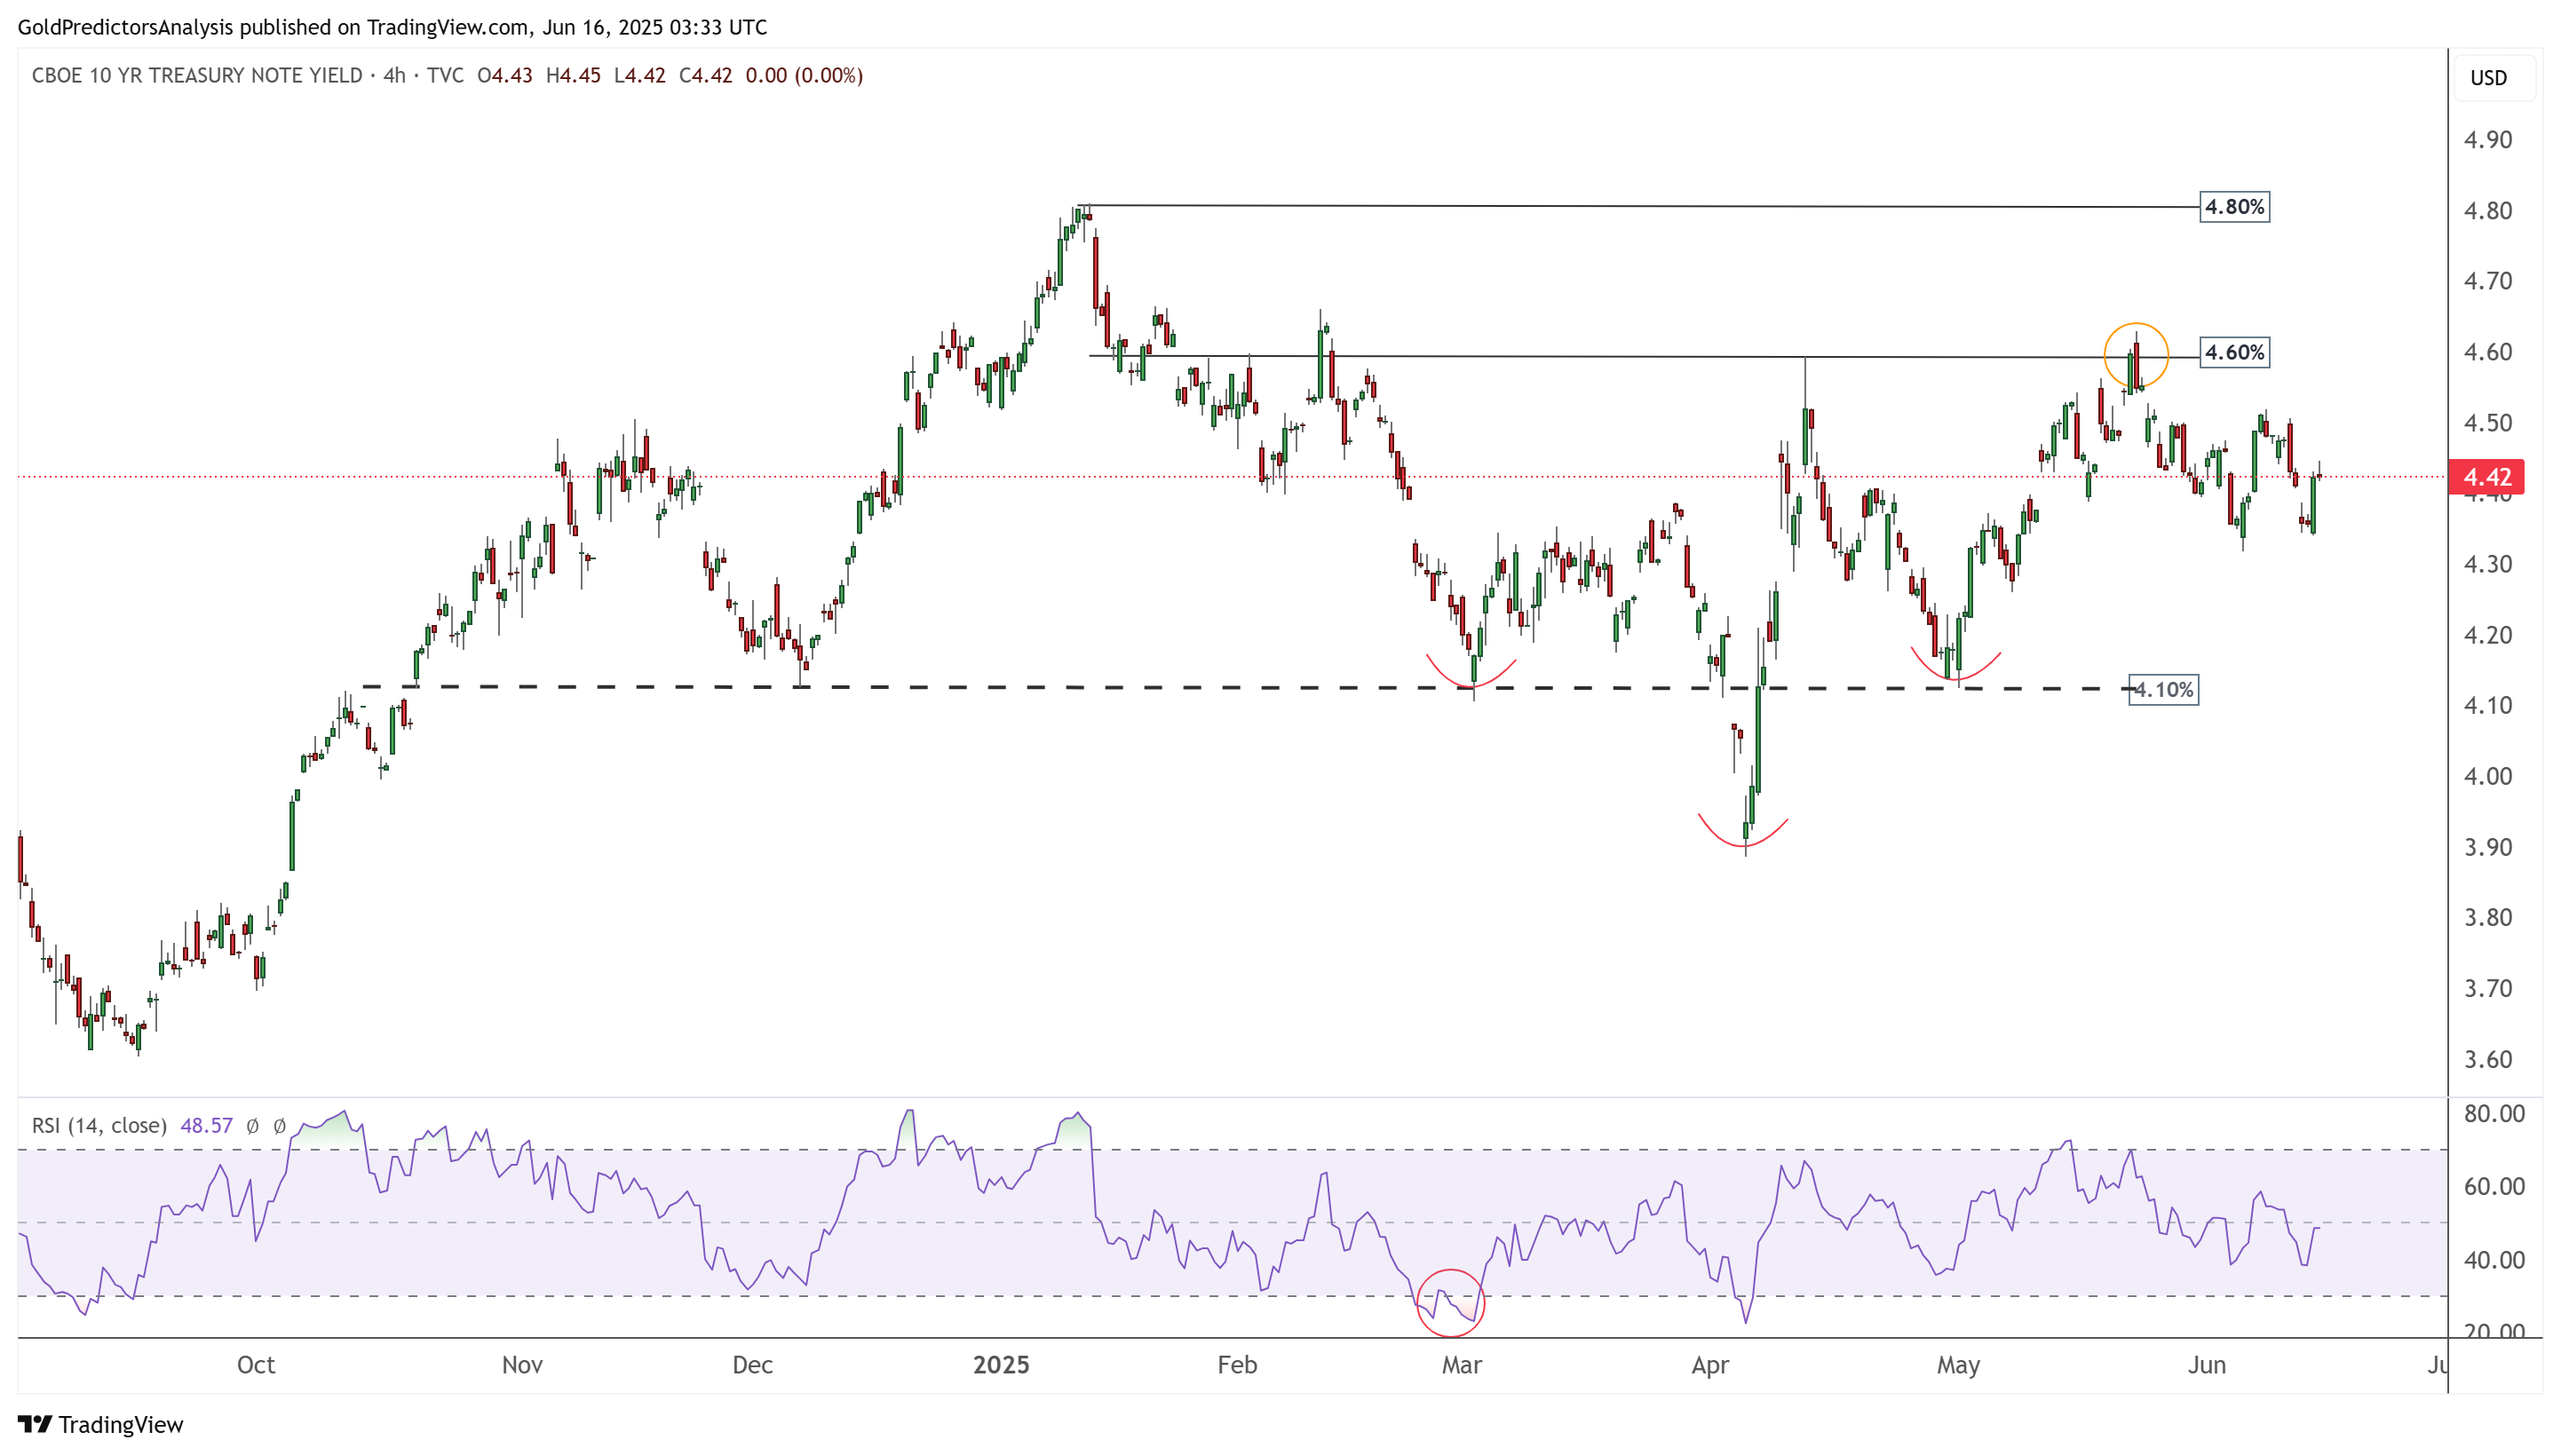
10-Year Treasury Note Yield 4-Hour Chart – Consolidation
The 4-hour chart for the US Treasury yield shows strong consolidation above the 4.10% area. A break above 4.60% could trigger a move toward 4.80%. As long as yields remain below 4.80%, consolidation is likely to continue.
US Dollar (DXY) Technical Analysis
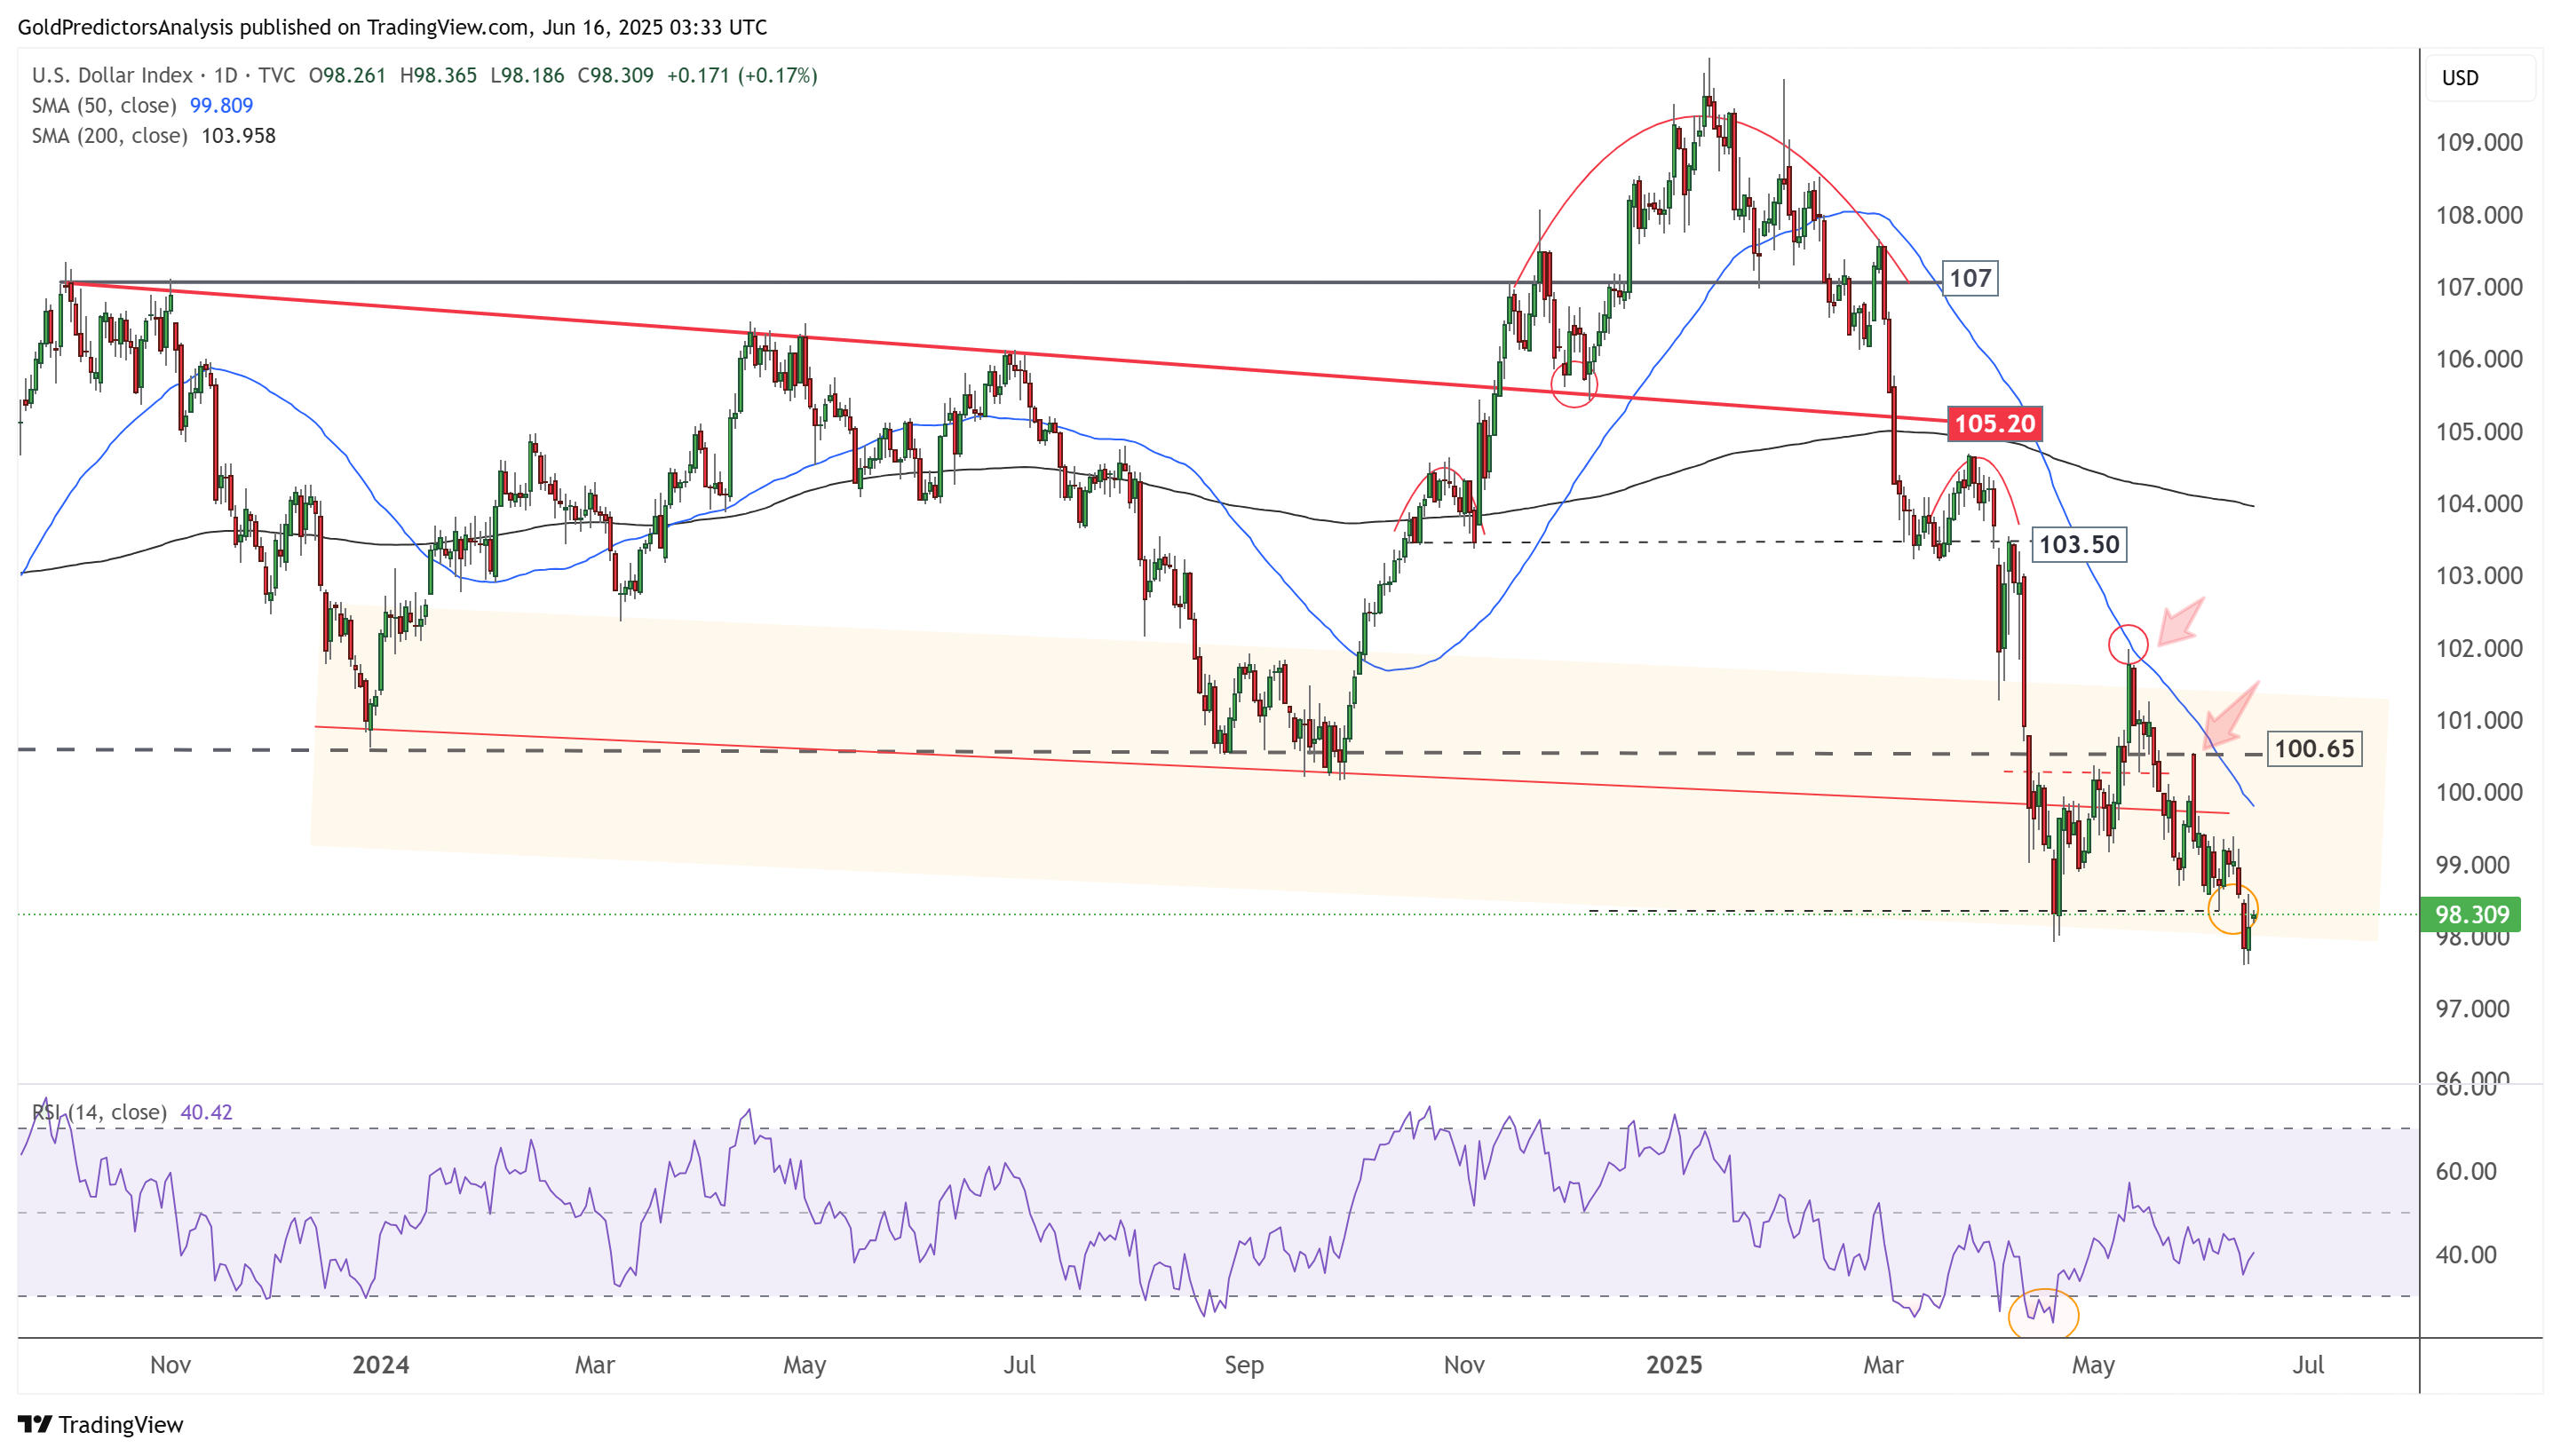
US Dollar Daily – Bearish Pressure
The daily chart for the USD Index shows that it attempted to break below the orange zone, which represents a long-term support area. The rebound on Friday was weak, and the index closed at 98.138, indicating continued bearish pressure. As long as the index remains below 100.65, it is likely to decline further toward the 96 area. A break below 96 could trigger a move toward 90, which is the long-term bearish target.
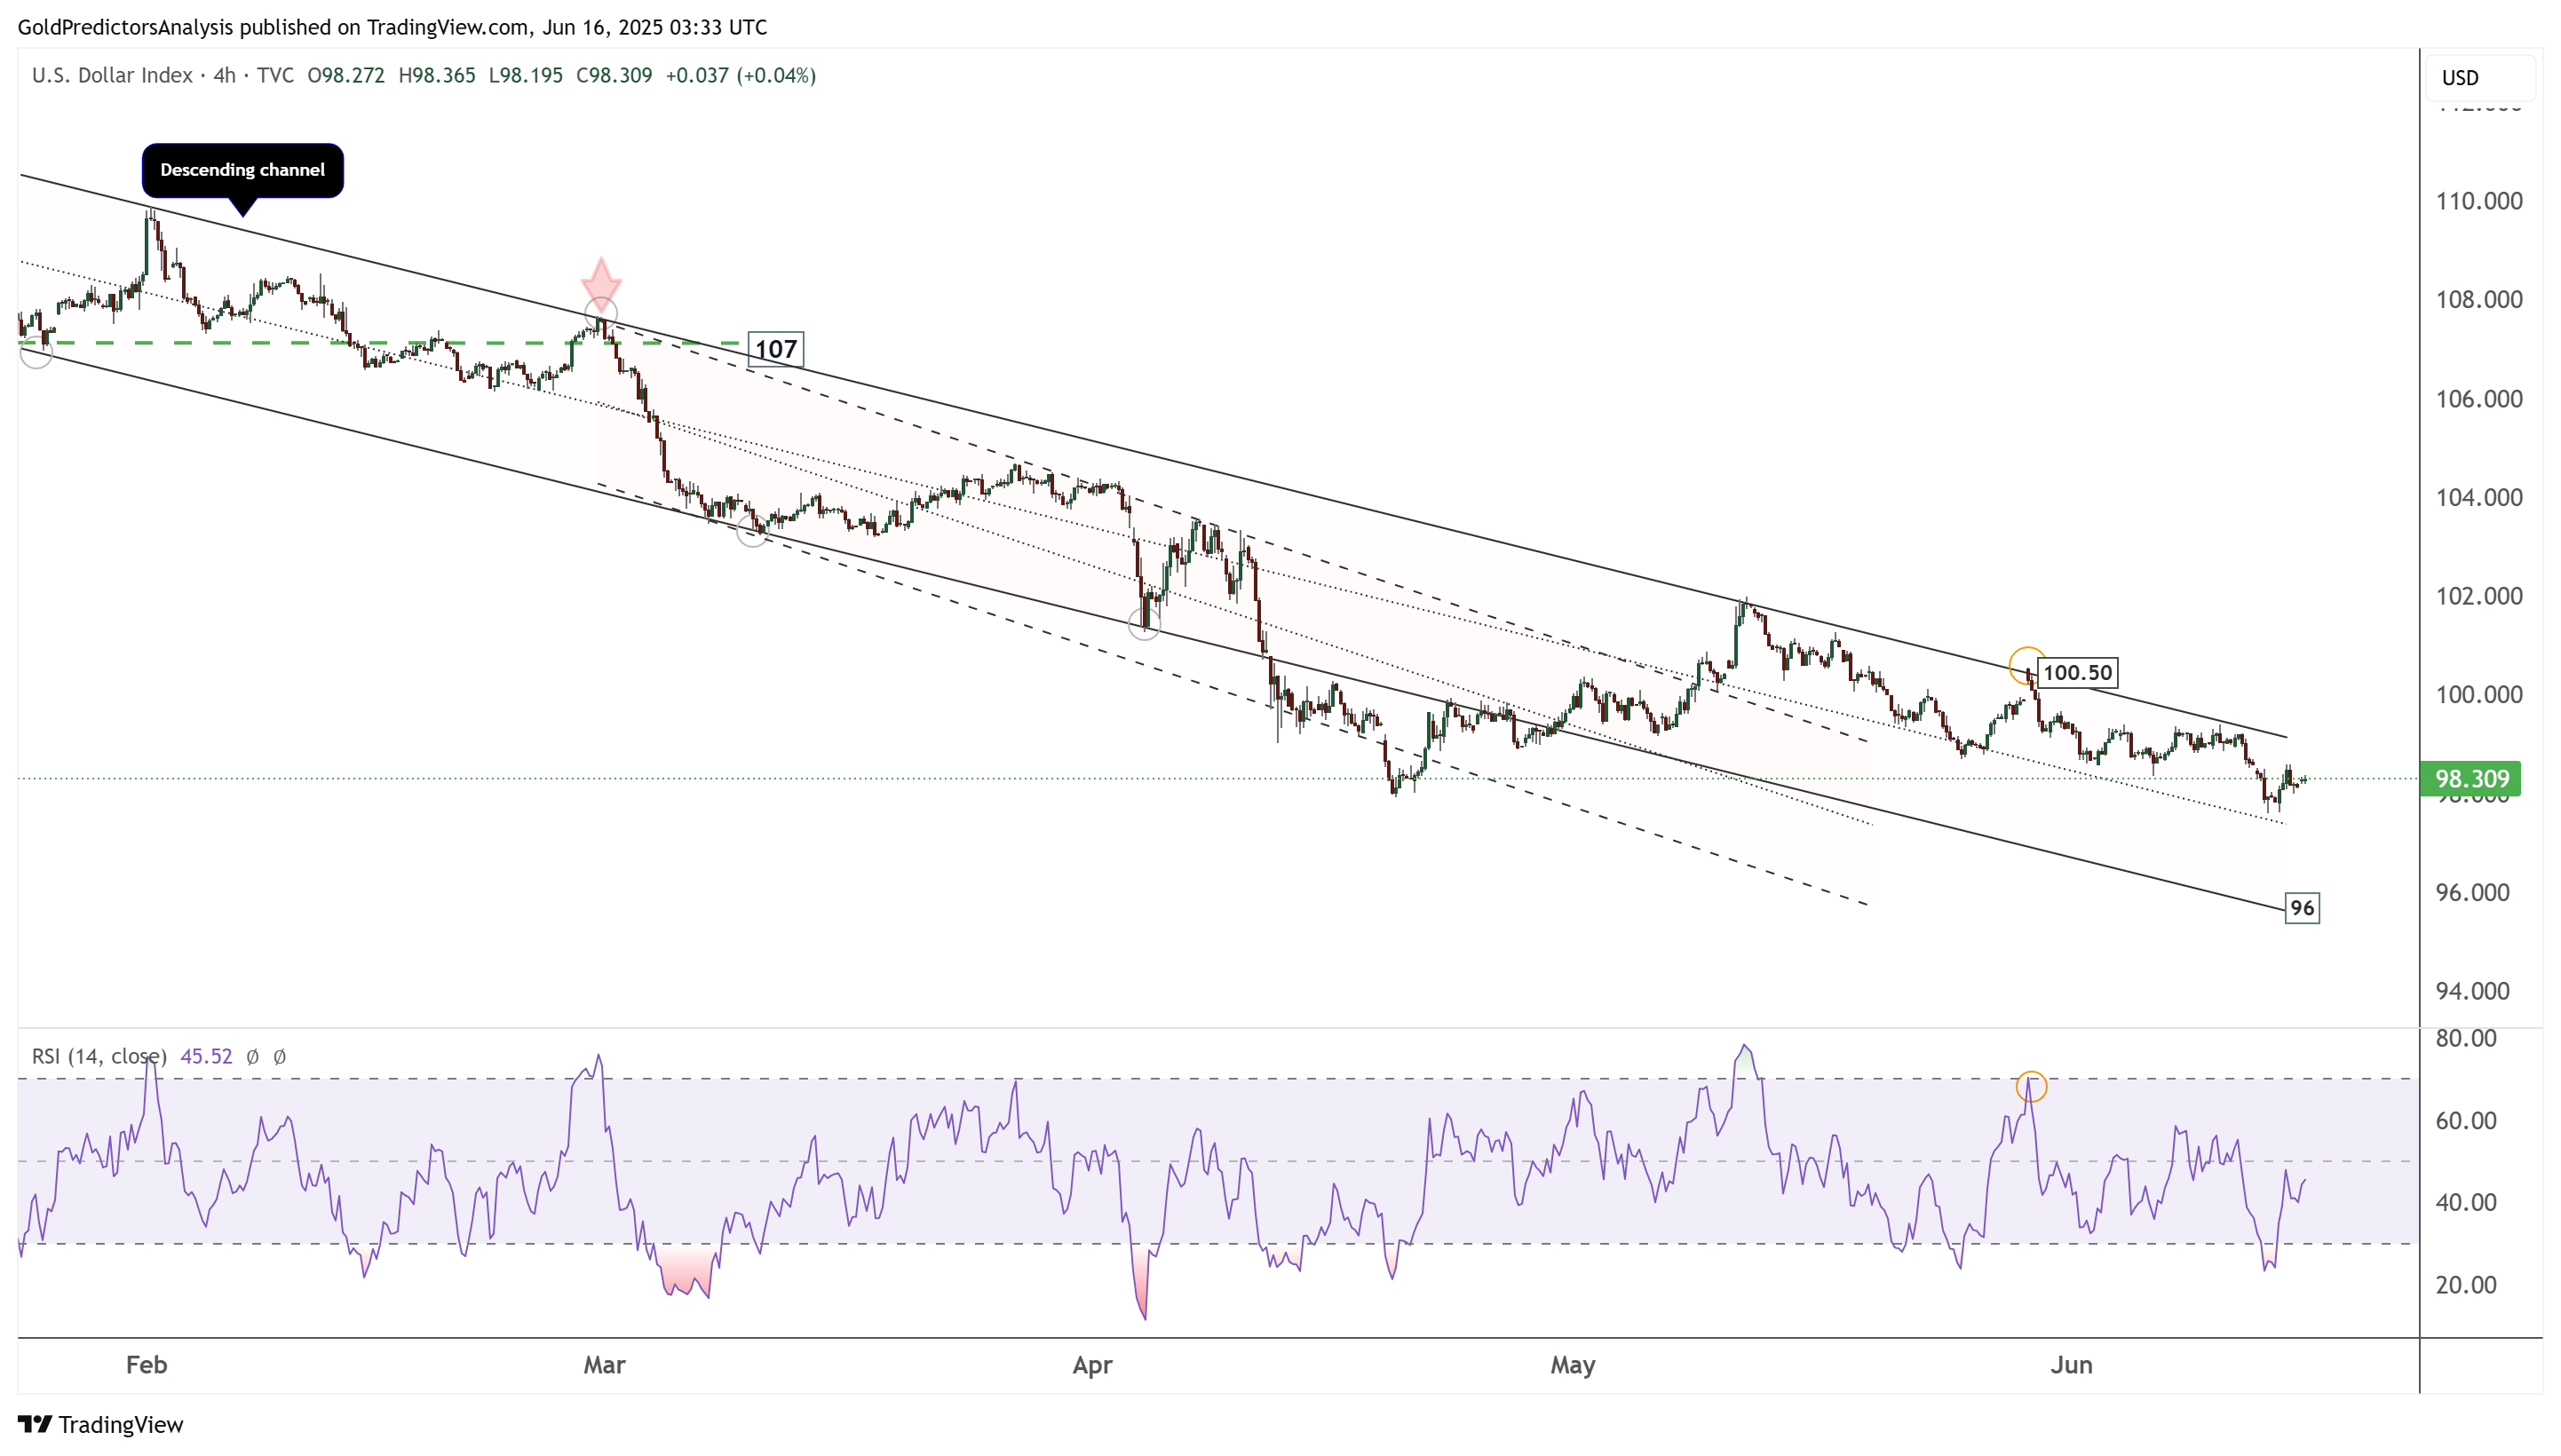
US Dollar 4-Hour Chart – Descending Channel
The 4-hour chart for the USD Index shows that it is trading within a descending channel. The index remains below 100.50, indicating a bearish market outlook. As long as it stays within this channel, the USD Index is likely to move toward the 96 area, which marks the lower boundary of the channel.
About the Author
Bob MasonChief Crypto Boss
123456789 30 He has written extensively for a broader audience and his current focus is on developments relating to the financial markets including, but not limited to currencies, commodities, alternative asset classes, and global equities.


Advertisement