
Advertisement
Advertisement
Gold (XAUUSD) & Silver Price Forecast: Range-Bound Ahead of Inflation and Fed Signals
By:
Key Points:
- Gold holds near $3,335 as Fed rate cut bets rise; traders await PCE data for next move amid political uncertainty.
- Silver reclaims both EMAs, trades at $36.35; breakout above $36.42 could target $36.89 and $37.31 in short term.
- A ceasefire eases geopolitical fears, limiting safe-haven flows into bullion despite weaker yields and USD.

Market Overview
Gold (XAU/USD) extended modest gains on Thursday, reaching $3,335 per ounce, while silver (XAG/USD) held near $36.35, up 0.2% on the session. The move followed a decline in the U.S. dollar index, which reached its lowest level since March 2022. Traders are reassessing the Federal Reserve’s policy path amid renewed political uncertainty.
Fed rate cut expectations have gained traction, with CME FedWatch data now showing a 56% probability of at least two cuts by December. “Rate expectations have shifted notably, and gold tends to benefit when real yields decline alongside a weaker dollar,” noted an ING strategist. U.S. 10-year Treasury yields hovered around 4.25%, reinforcing gold’s appeal as a non-yielding asset.
The political backdrop has added volatility.
Recent remarks from former President Donald Trump have raised questions about the tenure of Fed Chair Jerome Powell. Trump’s comments suggested a potential leadership change at the central bank by September, casting doubt on the Fed’s policy independence. Although Powell reiterated a data-driven stance during congressional testimony, market participants viewed the political rhetoric as a possible signal of future easing.
This combination of declining yields, a weaker dollar, and institutional uncertainty continues to support precious metals, though gains in both gold and silver remain measured pending further economic data.
Ceasefire Dims Safe-Haven Demand but Fails to Derail Rally
Still, the gold rally has remained contained, with resistance evident near the $3,345–$3,360 zone. A ceasefire between Middle Eastern powers has calmed geopolitical concerns, fueling a mild recovery in equities and limiting demand for safe-haven flows into bullion. Silver similarly faces resistance near $36.42, with traders cautious ahead of key macroeconomic releases.
Data and PCE Inflation Gauge Take Center Stage
Investor attention now turns to a batch of U.S. economic data, including jobless claims, durable goods orders, and final Q1 GDP figures. However, the core focus is Friday’s release of the Personal Consumption Expenditures (PCE) Price Index—a critical inflation metric for the Fed.
A softer print could reinforce the case for monetary easing and push gold higher, while a hotter number might stall the current uptrend. Gold and silver remain range-bound for now, but policy clarity and inflation data could define their next move.
Short-Term Forecast
Gold holds near $3,335 but faces resistance at $3,360, while silver eyes a breakout above $36.42. Upcoming PCE data may determine if this rebound turns into sustained upside.
Gold Prices Forecast: Technical Analysis
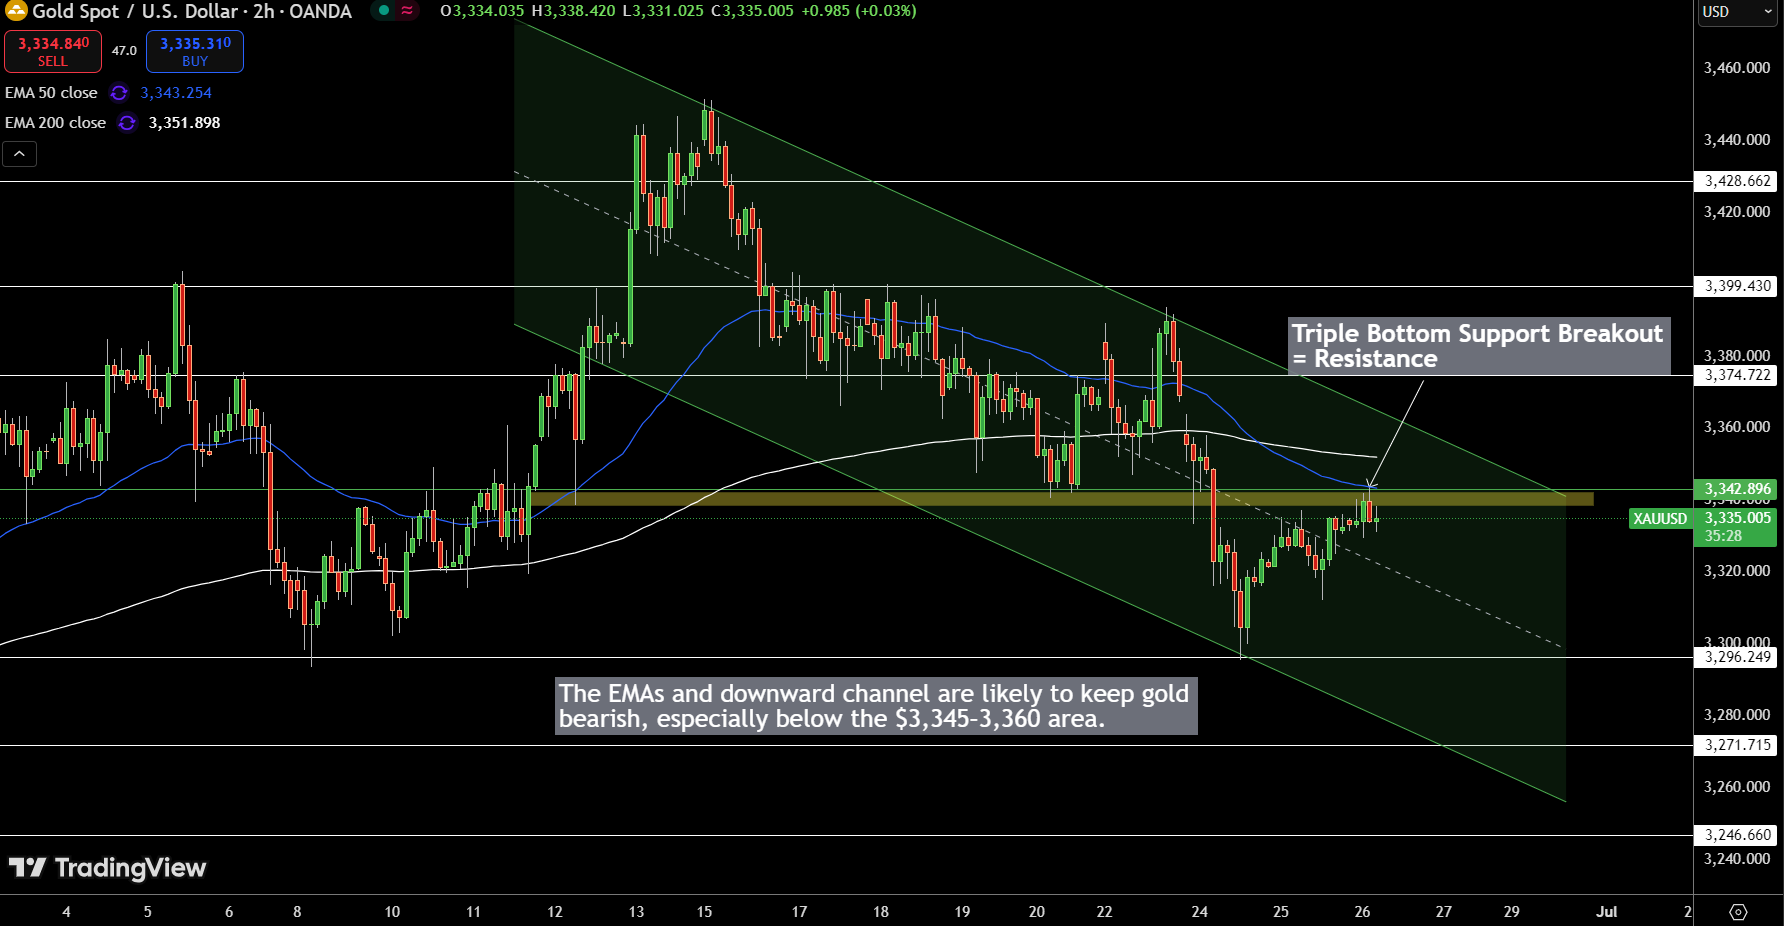
Gold (XAU/USD) is trading near $3,335 but remains capped by the $3,345–$3,360 zone, where the 50-EMA, 200-EMA, and descending channel resistance intersect. This former triple-bottom support now acts as a barrier, reinforcing the downtrend. Price action has repeatedly failed to sustain above this zone, and EMAs continue to slope lower.
As long as gold stays below $3,360, the trend favors sellers. A drop through $3,314 could expose $3,296 and $3,271. Short trades beneath $3,345 remain viable while that ceiling holds. A decisive close above $3,360, however, would challenge the current structure and could shift momentum toward $3,374 and $3,399.
Silver (XAG/USD) Price Forecast: Technical Outlook
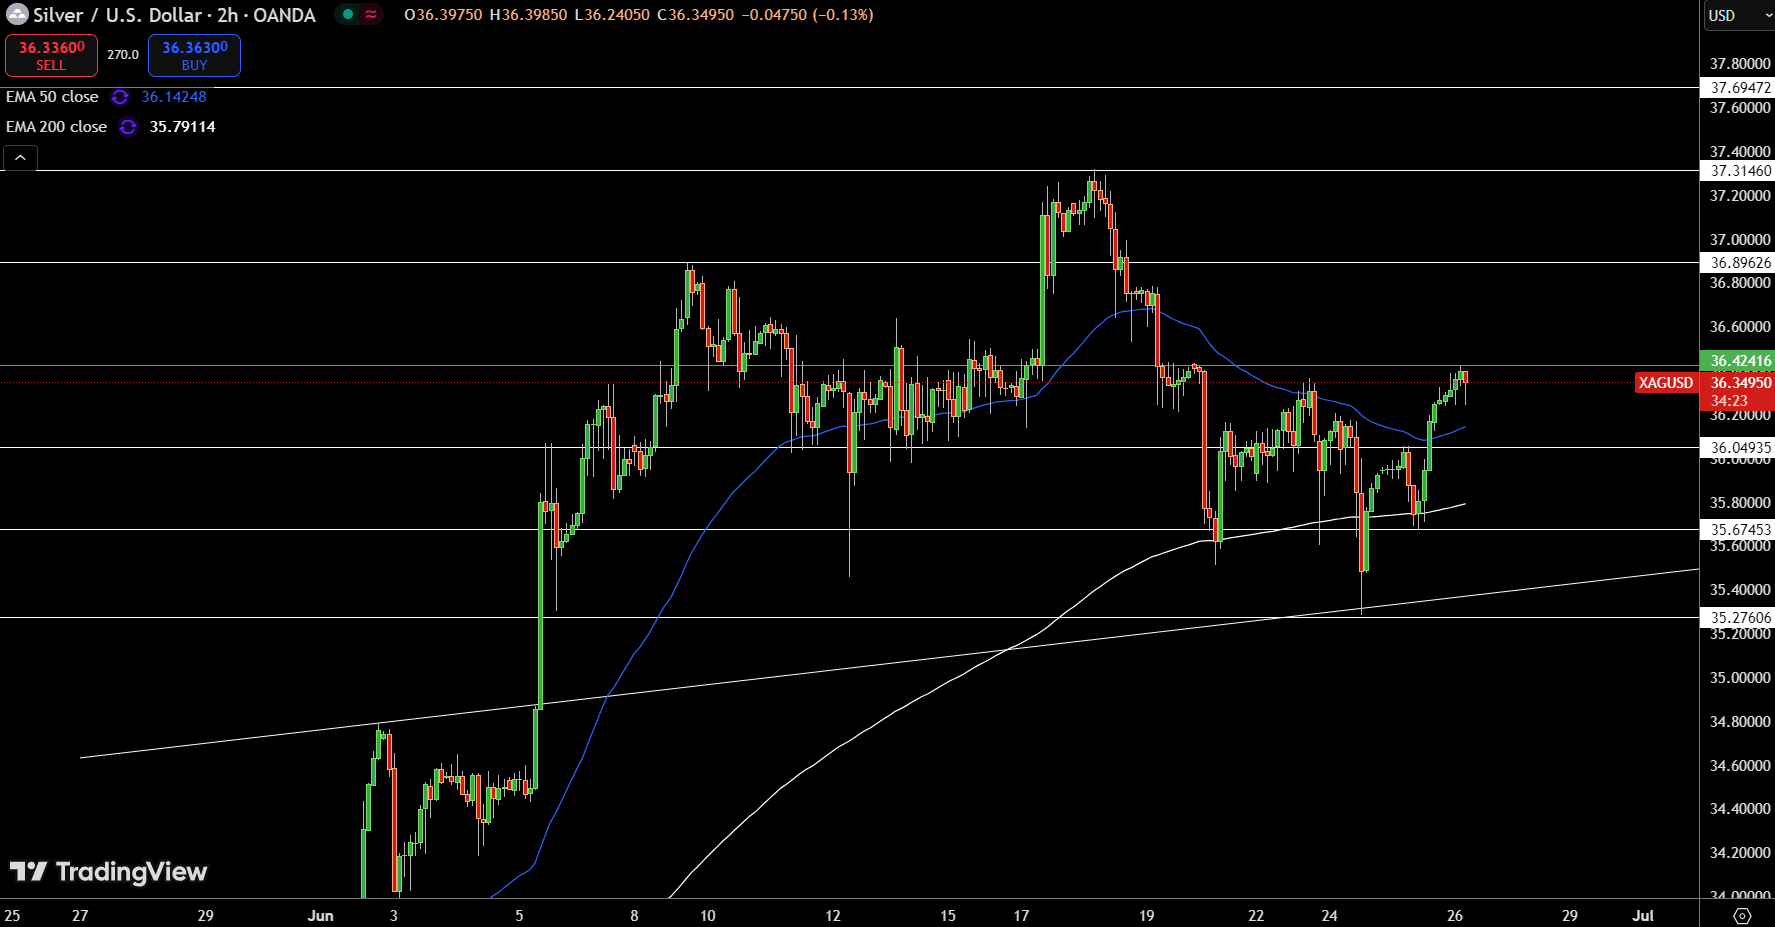
Silver (XAG/USD) is edging higher near $36.35 after reclaiming both the 50-EMA ($36.14) and 200-EMA ($35.79) on the 2-hour chart, a bullish technical shift supported by strong follow-through from the $35.27 support zone.
Price is now testing the $36.42 resistance—a key level that capped advances earlier this month. A confirmed break above this level could open the door toward $36.89 and $37.31, while failure here may lead to a pullback toward the EMA cluster near $36.00.
About the Author
Bob MasonChief Crypto Boss
123456789 30 He has written extensively for a broader audience and his current focus is on developments relating to the financial markets including, but not limited to currencies, commodities, alternative asset classes, and global equities.


Advertisement