
Advertisement
Advertisement
Natural Gas and Oil Forecast: Gasoline Demand Surges but Oil Rally Stalls Below $67
By:
Key Points:
- U.S. crude stockpiles dropped by 5.8M barrels, signaling strong demand and supporting a short-term oil price rebound.
- Natural gas futures hover at $3.577 but face bearish pressure as price tests a fragile support zone between $3.58 and $3.49.
- WTI crude consolidates near $65, with bearish bias intact unless bulls reclaim resistance near $67.62 and $67.97.

Market Overview
Oil prices edged higher on Thursday, extending Wednesday’s nearly 1% gains, driven by a sharper-than-expected 5.8 million-barrel draw in U.S. crude inventories, signaling robust demand. Gasoline stocks also fell by 2.1 million barrels, with summer driving activity hitting its highest pace since late 2021.
Brent traded at $68 and WTI at $65.12 per barrel by early Asia hours. While easing geopolitical tensions offers some relief, market sentiment remains cautious amid uncertainty around global production policy.
Analysts suggest WTI may stabilize in the $60–$65 range, with attention shifting to OPEC+ output decisions and U.S. consumption trends heading into Q3.
Natural Gas Price Forecast
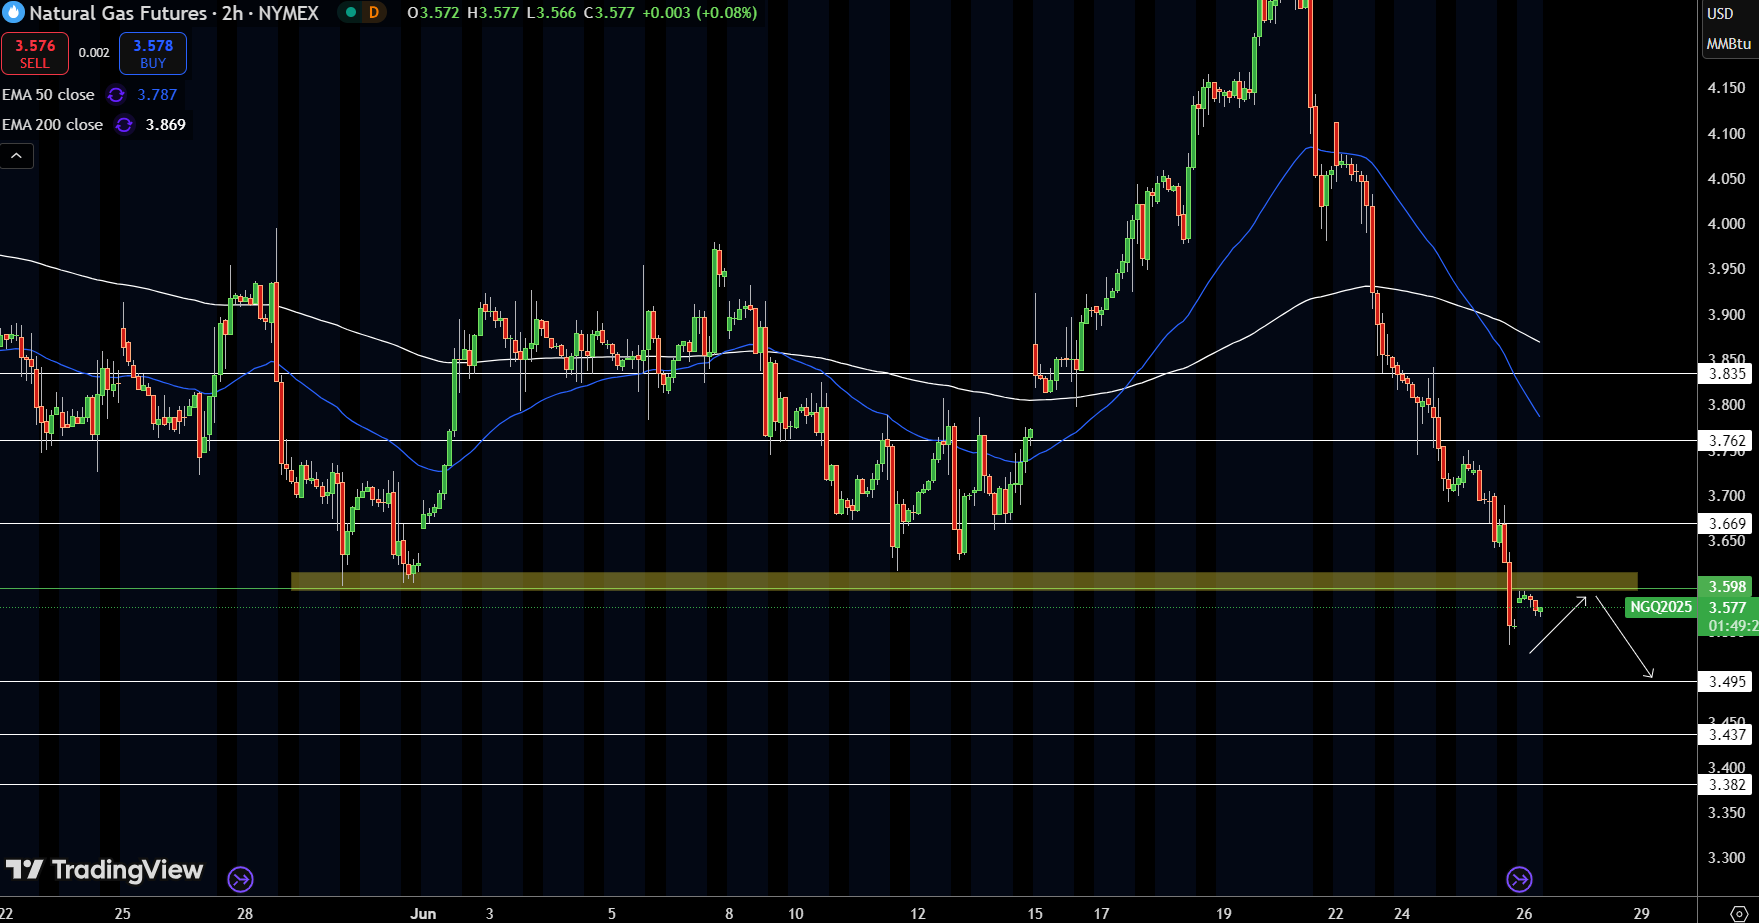
Natural Gas Futures (NGQ2025) are hovering near $3.577 after an aggressive selloff from the $4.15 region. Price has now returned to a key demand zone between $3.58 and $3.49 — a level that previously triggered multiple bullish reversals in early June. However, the structure remains fragile. The 50-EMA ($3.787) and 200-EMA ($3.869) are now positioned well above price, adding to bearish pressure.
Price action indicates a weak bounce attempt from the support zone, but no bullish candle confirmation has yet formed. If bulls fail to reclaim the $3.598–$3.66 region, this bounce may fade, potentially opening the door to a breakdown below $3.495, with targets of $3.437 or even $3.382. Caution is warranted — confirmation will define the next leg.
WTI Oil Price Forecast
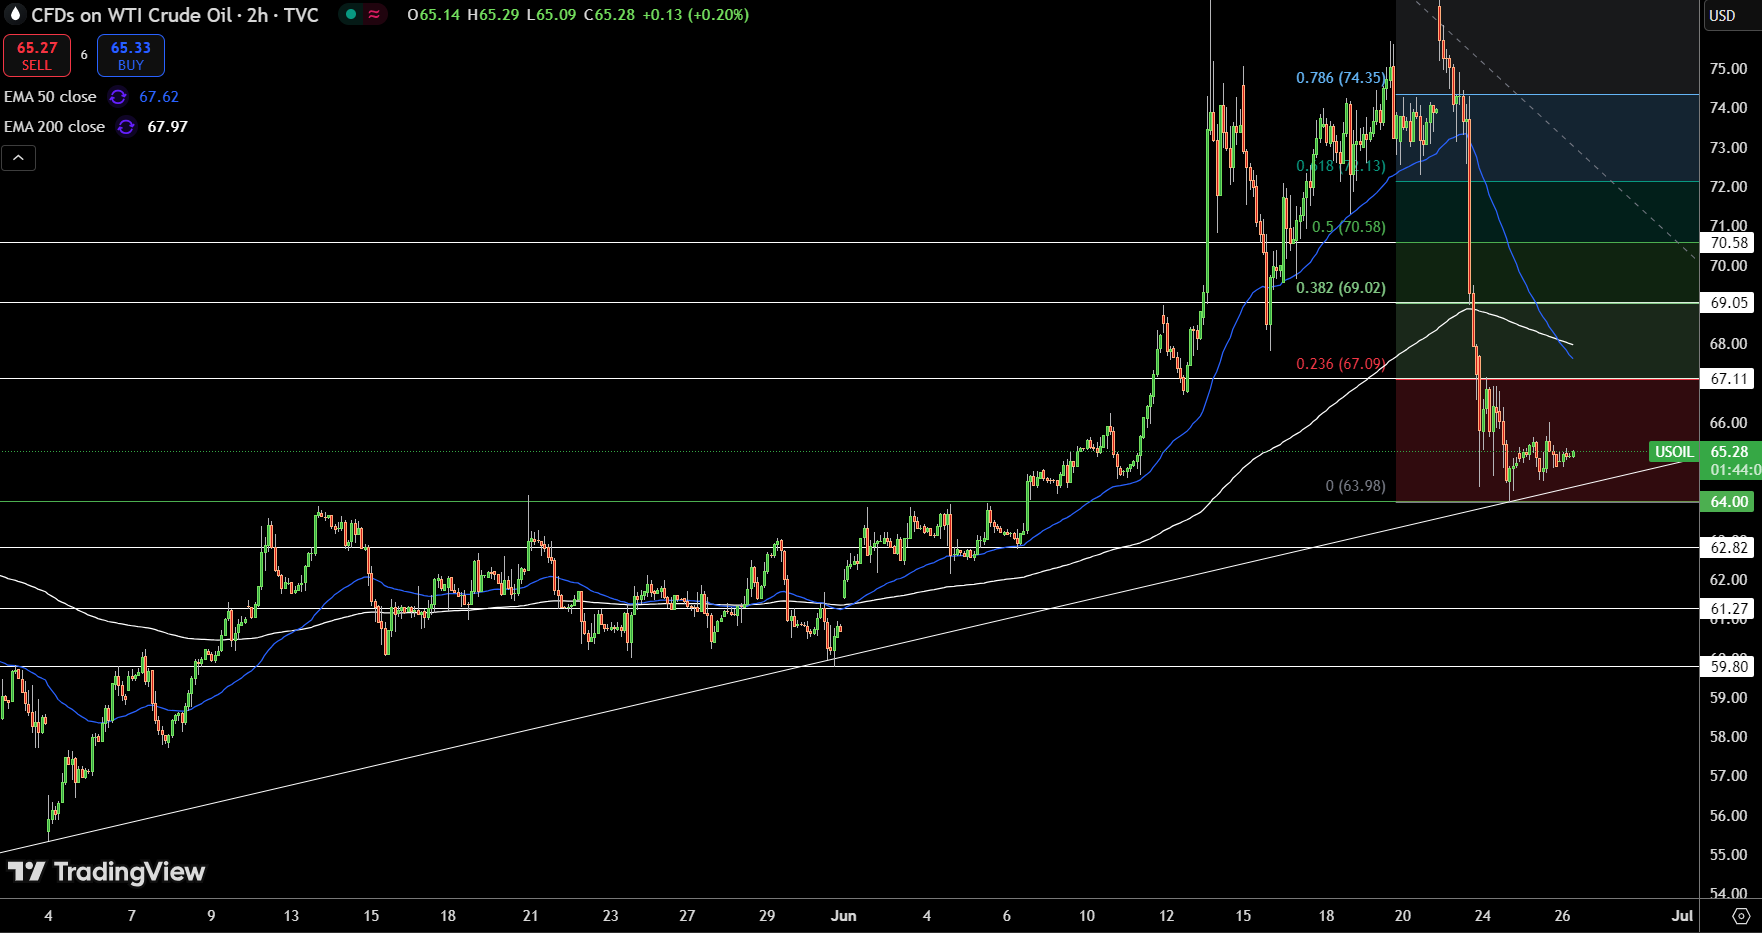
WTI Crude Oil (USOIL) is consolidating just above $65 after a steep $12 decline from the recent $77.11 high. Price has found support near the 0% Fibonacci retracement at $63.98 and is holding along a key ascending trendline drawn from May lows.
The $67.11 level, aligning with the 23.6% Fib retracement, marks near-term resistance. Above that, the 50-EMA ($67.62) and 200-EMA ($67.97) create a tight resistance zone. Unless bulls reclaim that range, the broader bias remains bearish.
A break below $64.00 could trigger downside toward $62.82 and $61.27. For now, crude is range-bound and building pressure, with the next breakout likely to define direction heading into July.
Brent Oil Price Forecast
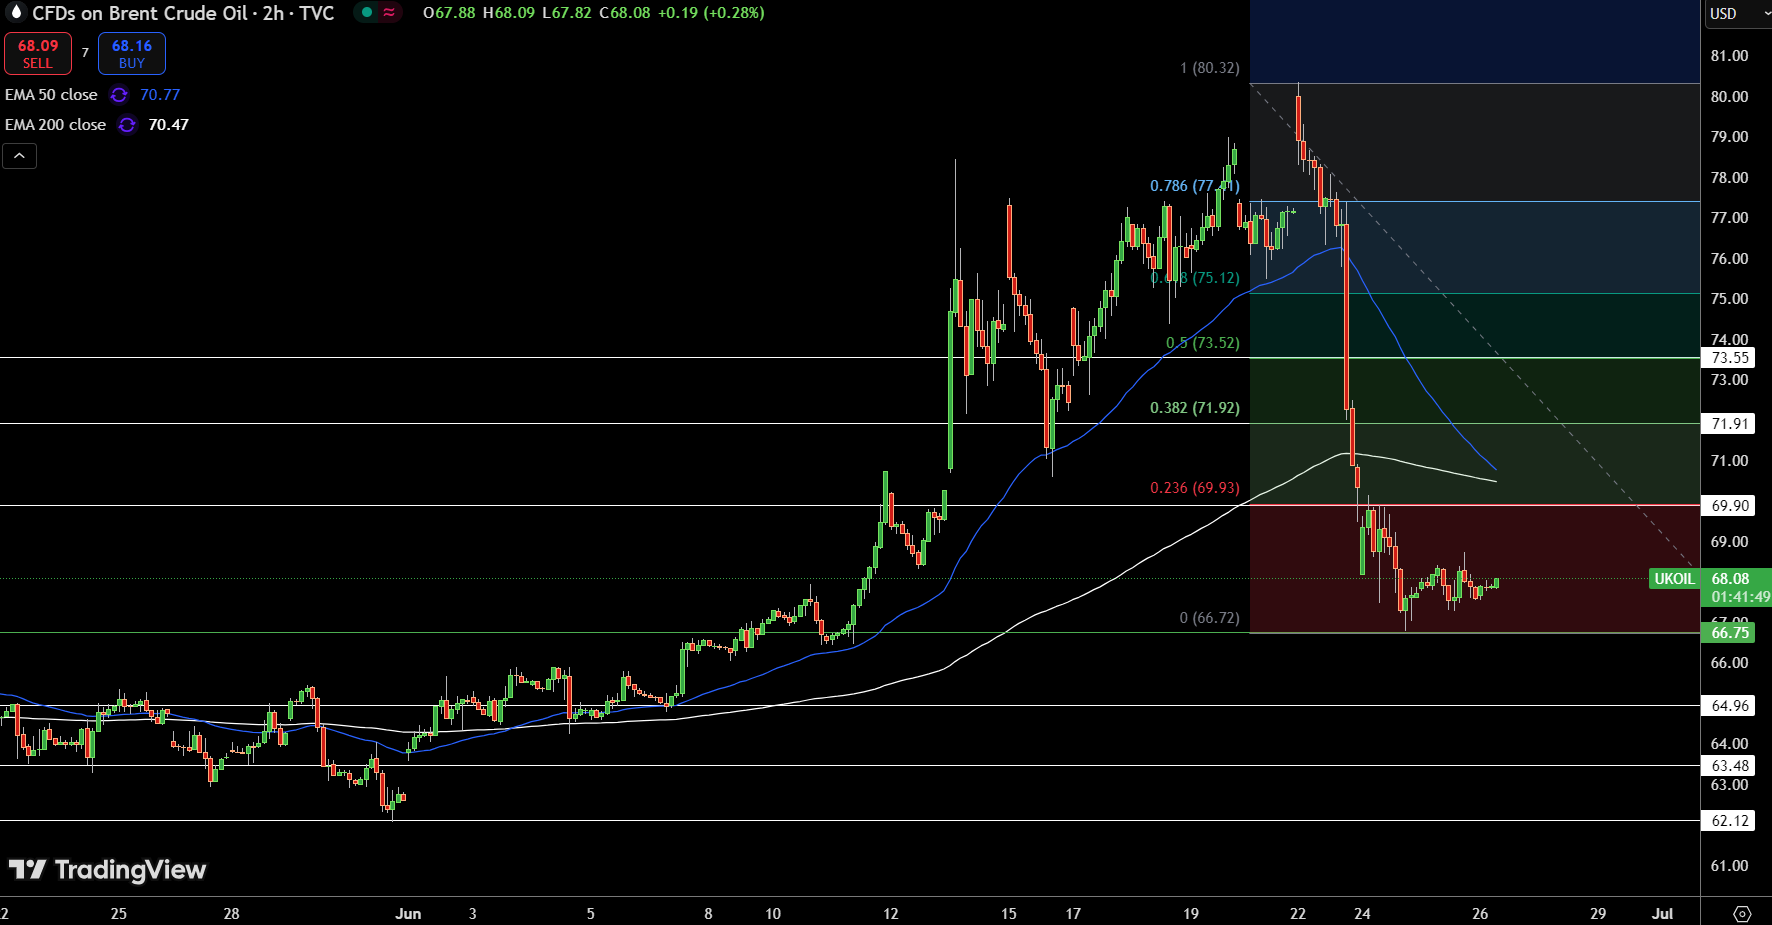
Brent Crude Oil (UKOIL) is trading near $68 after a sharp $12 drop from the recent high at $80.32. The price has stabilized just above the $66.75 low, testing the 0% Fibonacci retracement while remaining capped below the 23.6% Fibonacci level at $69.93. Both the 50-EMA ($70.77) and 200-EMA ($70.47) hover above as resistance, creating a bearish overhead cluster.
Price action is forming a tight consolidation range, with no clear breakout yet. A reclaim of $69.93 would open the door toward $71.91 (38.2% Fib), while failure to break higher may trigger a retest of $66.75 or even lower.
For now, Brent remains in limbo, with momentum favoring bears unless bulls step in above $70.
About the Author
Bob MasonChief Crypto Boss
123456789 30 He has written extensively for a broader audience and his current focus is on developments relating to the financial markets including, but not limited to currencies, commodities, alternative asset classes, and global equities.


Advertisement