
Advertisement
Advertisement
Natural Gas and Oil Forecast: Bearish Risks Loom as Prices Test Critical Support Zones
By:
Key Points:
- Oil prices rebound after Saudi Aramco's price hike, but volatility remains amid a 10% decline from 2025 highs.
- Natural Gas holds near $3.28 pivot; a breakout could push prices toward $3.41, while a drop risks declines to $3.01.
- WTI Oil forms a double bottom, signaling a potential trend reversal if it stays above key support at $70.98.

Market Overview
Oil prices steady in Asian trading following Saudi Aramco’s sharp price hike for March, though this barely offset Brent’s steepest decline in nearly three months. Previously, a 2% drop the previous day was driven by surging U.S. crude and gasoline inventories, signaling weaker demand, alongside concerns over new global trade measures impacting energy flows.
Prices have fallen around 10% from their 2025 highs, with analysts forecasting heightened volatility amid shifting geopolitical dynamics. While short-term gains are expected due to technical support and supply adjustments, broader economic uncertainties continue to weigh on both oil and natural gas markets.
Natural Gas Price Forecast
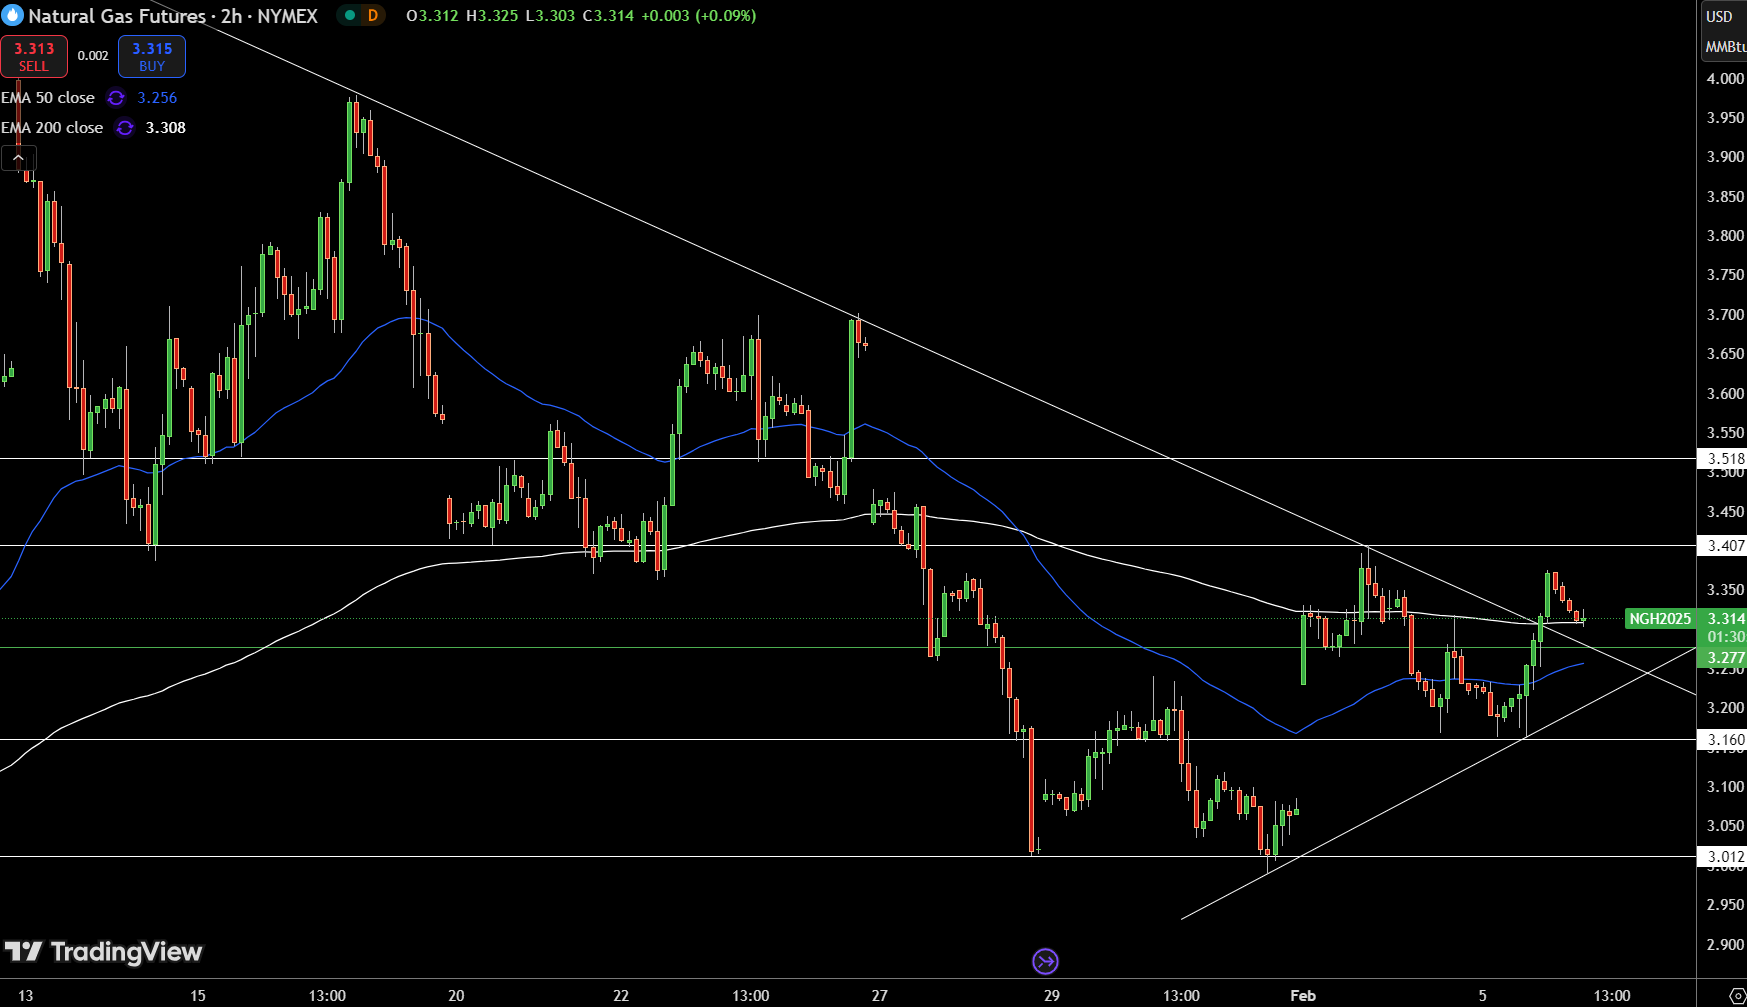
Natural Gas (NG) is trading at $3.31, down 0.91%, showing signs of hesitation near its 200-day EMA, which coincides with the current price. The key level to watch is $3.28, acting as a pivot point. If NG holds above this, we could see bullish momentum pushing prices toward $3.41 and potentially $3.52.
However, a decisive break below $3.28 might trigger sharp selling, with support levels at $3.16 and $3.01 offering potential floors.
Interestingly, NG recently broke out of a downward trendline, and it’s now testing that breakout around the $3.28 mark. This retest could be the catalyst for an upward move if buyers step in. Keep an eye on the 50 EMA at $3.26; holding above this strengthens the bullish case.
WTI Oil Price Forecast
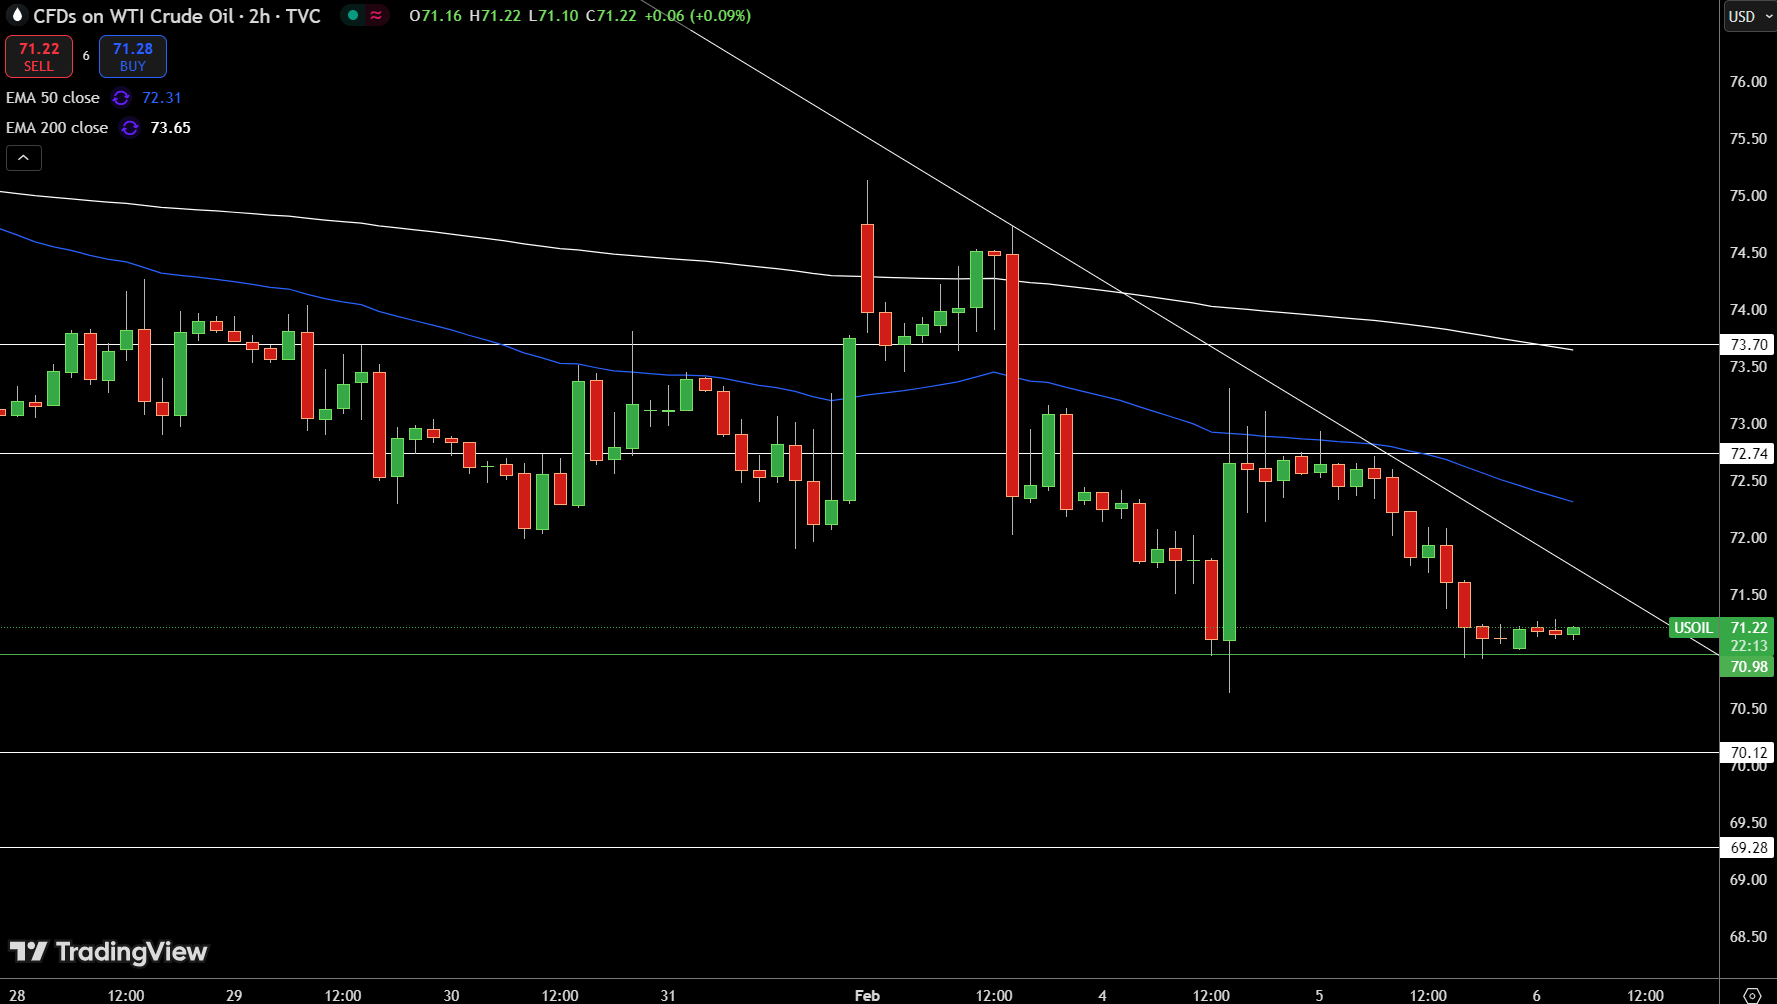
USOIL is trading at $71.26, up 0.21%, showing early signs of bullish momentum. The key level to watch is the pivot point at $70.98. Staying above this level could attract more buyers, potentially driving prices toward the immediate resistance at $72.74 and even $73.70 if the momentum holds.
What’s interesting here is the formation of a double bottom pattern—a classic sign that the downtrend might be losing steam.
However, caution is warranted. The 50-day EMA sits at $72.31 and the 200-day EMA at $73.65, both acting as resistance levels that could stall upward movement. If USOIL slips below $70.98, we might see sharp selling pressure, with support around $70.12 and $69.28. It’s a delicate balance right now.
Brent Oil Price Forecast
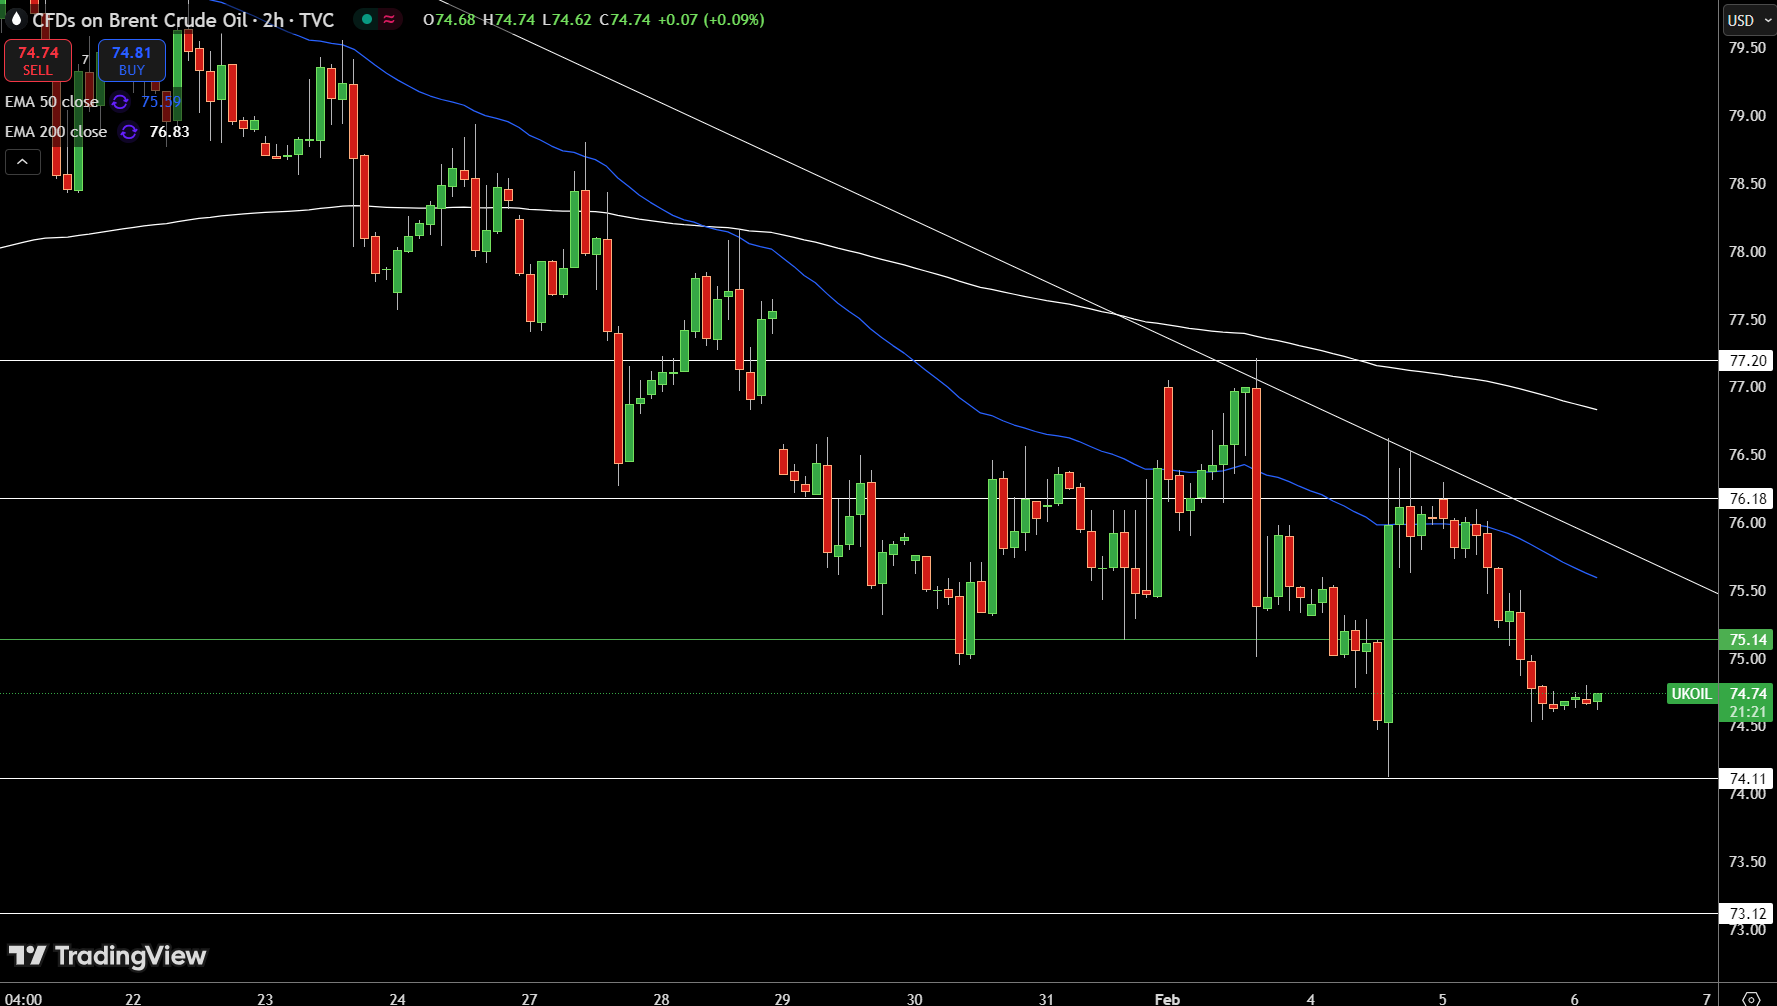
UKOIL is trading at $74.78, up 0.20%, navigating just below the pivot point at $75.14. The price action suggests a cautious bullish bias, but the real test lies in breaking above $75.14. If it manages that, we could see a push toward $76.18, with $77.20 as the next key resistance.
The 50-day EMA at $75.59 adds an extra layer of resistance, and the 200-day EMA at $76.83 could limit further gains unless strong buying momentum kicks in.
On the flip side, if UKOIL dips below immediate support at $74.11, it could trigger sharper declines, with $73.12 as the next support zone. Right now, the market seems indecisive—hovering between bullish potential and the risk of a quick reversal.
About the Author
Bob MasonChief Crypto Boss
TEST 30 He has written extensively for a broader audience and his current focus is on developments relating to the financial markets including, but not limited to currencies, commodities, alternative asset classes, and global equities.
Latest news and analysis


Advertisement