
Advertisement
Advertisement
Natural Gas, WTI Oil, Brent Oil Forecasts – Oil Dives As OPEC+ Plans To Boost Production
By:
Key Points:
- Natural gas climbed back above the $4.00 level.
- WTI oil declined towards the $68.00 level as OPEC+ decided to raise production.
- Brent oil pulled back towards the $71.00 level.

Natural Gas
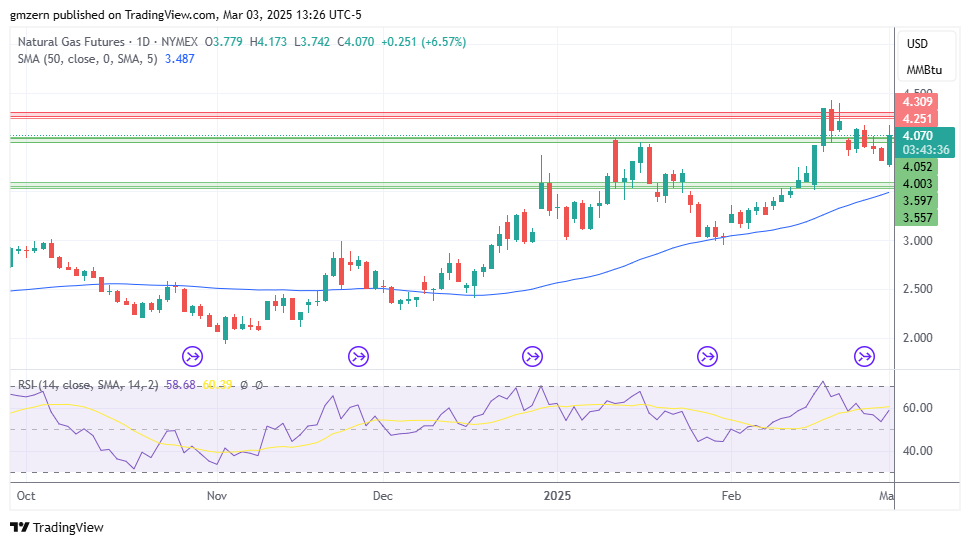
Natural gas gained upside momentum at the start of the week and is trying to settle back above the $4.00 – $4.05 level.
In case this attempt is successful, natural gas will move towards the next resistance level, which is located in the $4.25 – $4.30 range.
WTI Oil
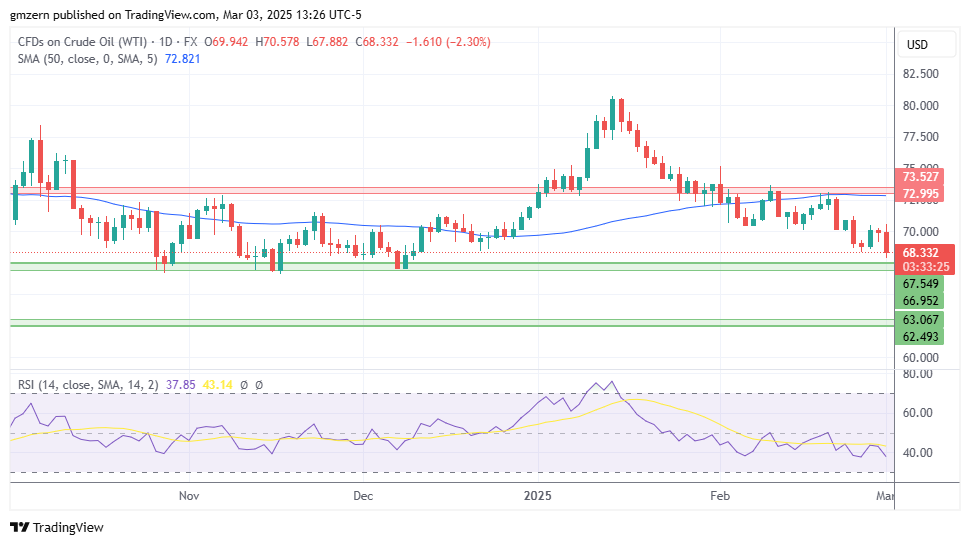
WTI oil tests new lows as OPEC+ plans to increase oil production in April, in line with the previous plan.
The nearest support level for WTI oil is located in the $67.00 – $67.50 range. If WTI oil declines below this level, it will head towards the next support at $62.50 – $63.00.
Brent Oil
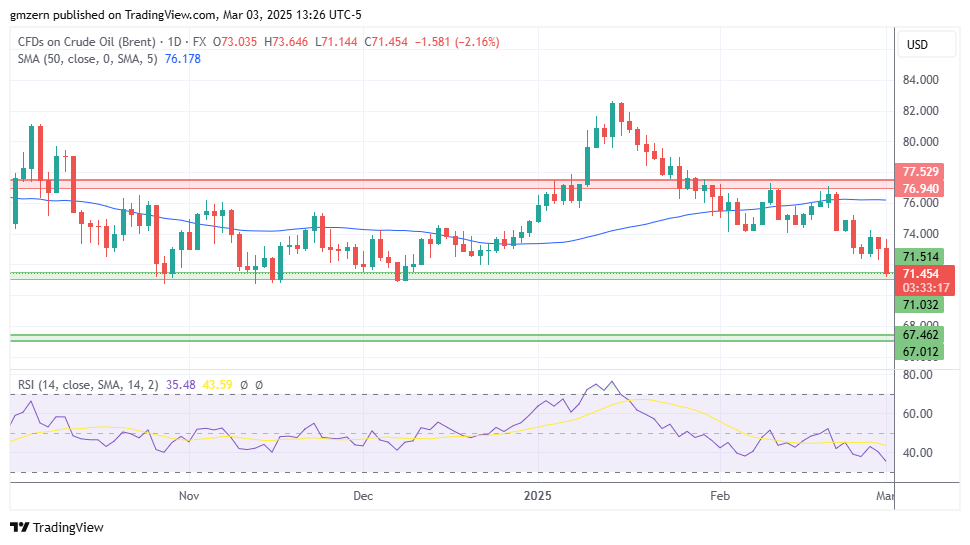
Brent oil tests support at $71.00 – $71.50 as traders react to OPEC+ decision to boost production.
A move below the $71.00 level will push Brent oil towards the support at $67.00 – $67.50.
For a look at all of today’s economic events, check out our economic calendar.
About the Author
Vladimir Zernovauthor
In more than 15 years of trading in the financial markets, Vladimir dealt with a wide range of brokers and financial instruments. His career as a day-trader at a proprietary trading firm goes back to 2007. Later, Vladimir turned to longer time frames and became an independent trader and analyst managing his own portfolio. Using his experience, he helps traders find the best broker in his reviews.
Latest news and analysis


Advertisement