
Advertisement
Advertisement
Natural Gas, WTI Oil, Brent Oil Forecasts – Oil Tested Yearly Lows
By:
Key Points:
- Natural gas gained ground as Canada reduced exports to the U.S.
- WTI oil tested yearly lows as traders reacted to the EIA report.
- Brent oil made an attempt to settle below the $68.50 level.

Natural Gas
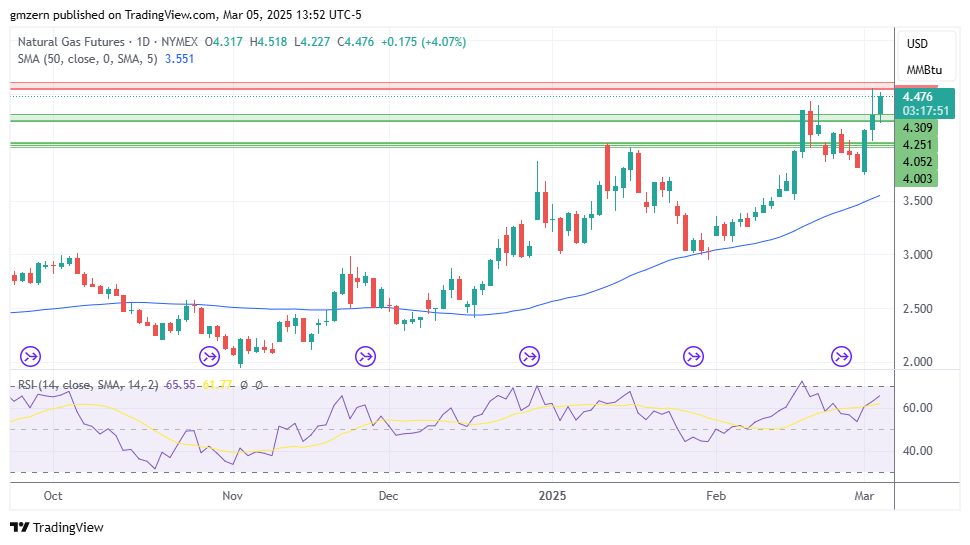
Natural gas continues to move higher as Canada reduced exports to the U.S. due to tariffs.
It should be noted that RSI remains in the moderate territory, so there is plenty of room to gain momentum in the near term.
WTI Oil
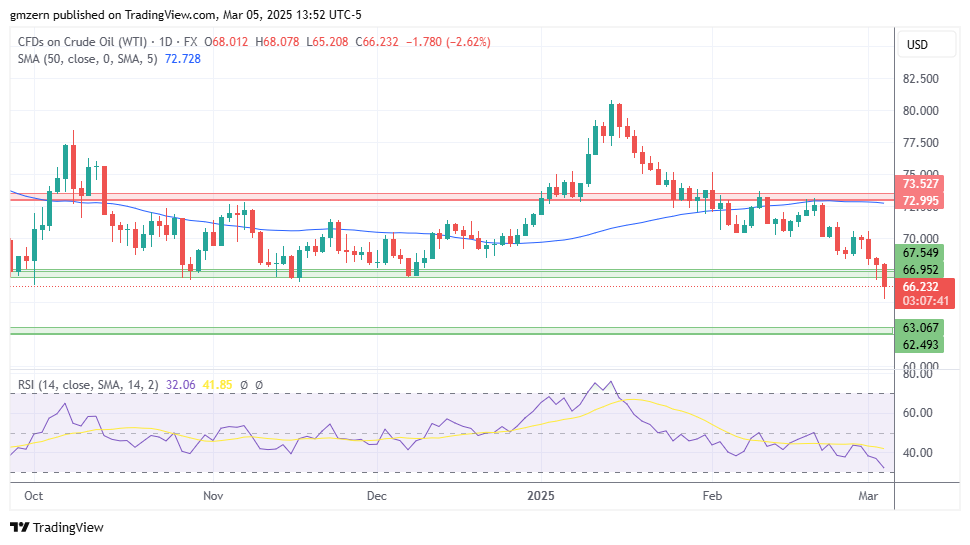
WTI oil tested yearly lows as traders reacted to the EIA report, which showed that crude inventories increased by 3.6 million barrels from the previous week.
In case WTI oil stays below the $67.00 level, it will head towards the next support at $62.50 – $63.00.
Brent Oil
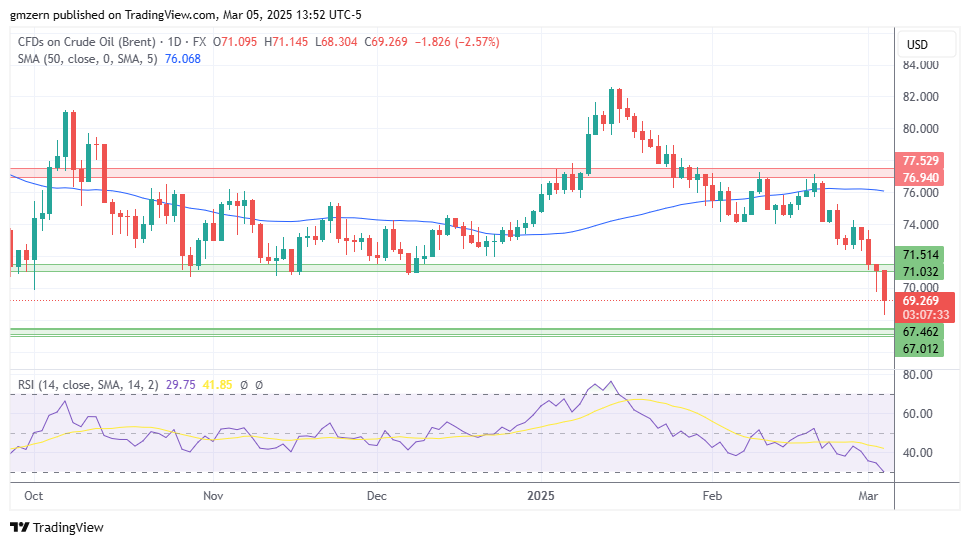
Brent oil has also tested new lows as traders remained worried that trade wars would hurt demand for oil.
A move below the $69.00 level will push Brent oil towards the support at $67.00 – $67.50.
For a look at all of today’s economic events, check out our economic calendar.
About the Author
Vladimir Zernovauthor
In more than 15 years of trading in the financial markets, Vladimir dealt with a wide range of brokers and financial instruments. His career as a day-trader at a proprietary trading firm goes back to 2007. Later, Vladimir turned to longer time frames and became an independent trader and analyst managing his own portfolio. Using his experience, he helps traders find the best broker in his reviews.
Latest news and analysis


Advertisement